AVIATION NOISE 101 Gregory Maxwell - Casper Airport Solutions - UC Davis Aviation Noise & Emissions Symposium: February 25, 2017 - Long Beach, CA ...
←
→
Page content transcription
If your browser does not render page correctly, please read the page content below

AVIATION NOISE 101
               Gregory Maxwell – Casper Airport Solutions

UC Davis Aviation Noise & Emissions Symposium: February 25, 2017 – Long Beach, CA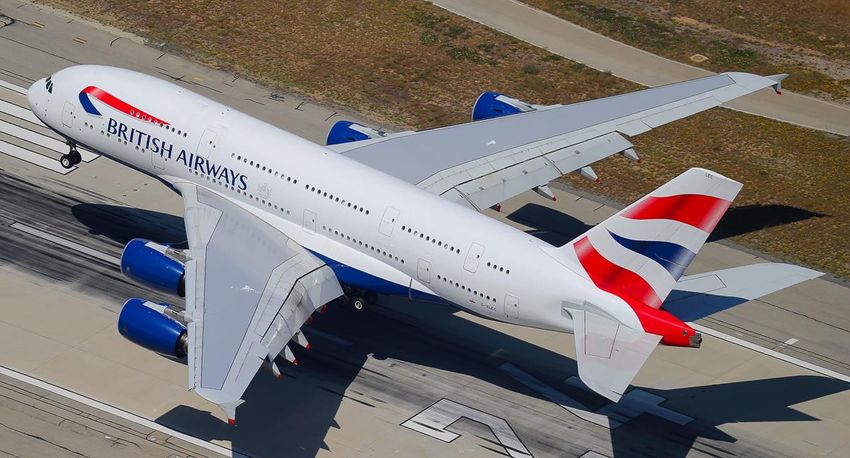
FLIGHTPLAN
TOPIC                                PRESENTER           TIME
Introduction/Ice Breaker             Steve & Greg        12:00
Evolution of Aviation Noise          Steve               12:15
Break                                -----------------   13:00
Science of Aviation Noise            Gregory             13:15
Quantifying Aviation Noise           Steve               13:45
Break                                -----------------   14:15
Regulating Aviation Noise            Steve               14:30
Mitigating Aviation Noise            Steve               15:00
Break                                -----------------   15:30
Aircraft Performance and Noise       Greg                15:45
Performance Based Navigation         Greg                16:15
Flight Procedure Design              Greg                16:35

THE SCIENCE OF AVIATION NOISE
WHAT IS SOUND?

A mechanical wave that results from the back and forth vibration of the particles of the medium
                           through which the sound wave is moving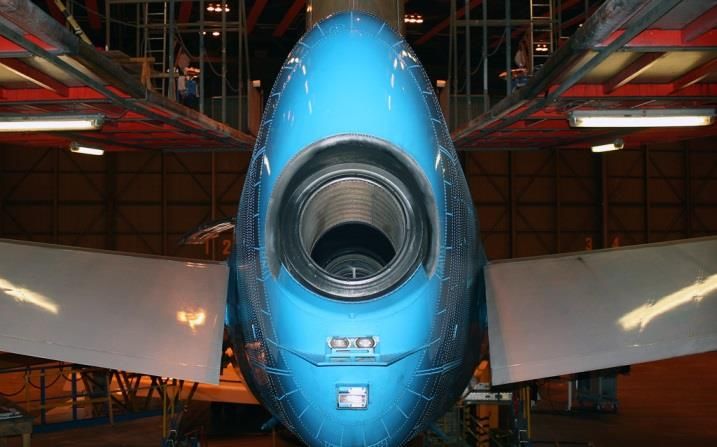
HOW DOES SOUND TRAVEL?

Sound is transmitted through the air by the vibration of air molecules
HOW IS SOUND ENERGY MEASURED?
                       dB    Sound Energy   Perceived Loudness
       Rock Concert    120     1,000,000           64x
         Ambulance     110     100,000            32x
          Fire Alarm   100      10,000            16x
       Subway Train    90       1,000              8x
       Urban Street    80        100               4x
  Department Store     70         10               2x
Typical Conversation   60         1                1
     Suburban Area     50         .1              1/2x
         Rural Area    40        .01              1/4x
           Whisper     30        .001             1/8x
         Wilderness    20       .0001            1/16x
          Breathing    10       .00001           1/32x
Threshold of Hearing   0       .000001           1/64x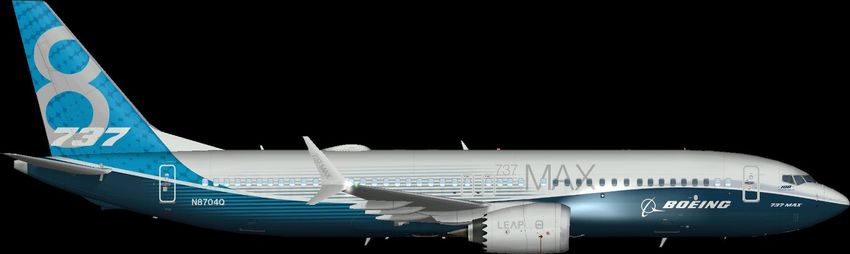
WEATHER’S EFFECT ON SOUND TRASMISSION
                                                    Direction

Calm and Cloudy

                                                                Windy
Calm and Sunny

                                                                Nighttime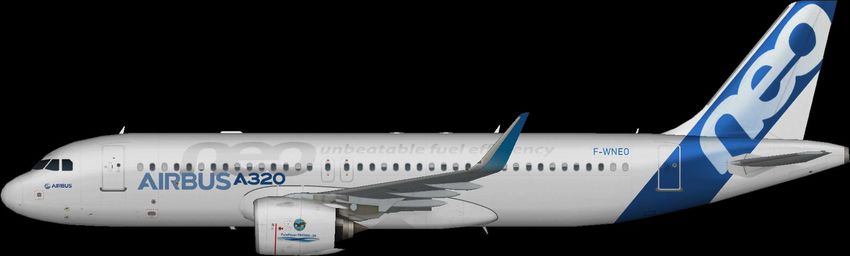
WHAT IS NOISE?

Noise – a sound, especially one that is loud or unpleasant
     or that causes disturbance. (unwanted sound)
AIRPORT NOISE SOURCES

Aircraft Departures         Engine Run-Ups         Running APU

 Aircraft Arrivals          Reverse Thrust    Aircraft Idling / Taxiing
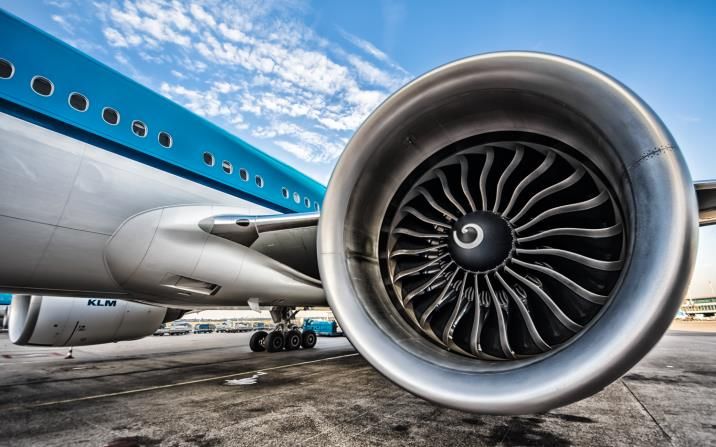
AIRCRAFT NOISE SOURCES
                                        Engine Nacelle

     Landing
      Gear

    Fan Blades
Thrust Reversers                       Flaps

 Turbine / Fan Core                       Speed Brakes               APU

     Jet / Fan Exhaust
                                                         Fuselage
                   Slats     Wingtip Vortices
                                                                    Photo - Victor J. Pody
WHO REGULATES AIRPLANE NOISE IN THE UNITED STATES? Federal Aviation Regulations Part 36 – Noise Standards: Aircraft Type and Airworthiness Certification Subpart B – Transport Category Large Airplanes and Jet Airplanes FAR 36.101 – Noise Measurement and Evaluation FAR 36.103 – Noise Limits
HOW IS AIRCRAFT NOISE MEASURED?
          Aircraft Noise Certification Points:
             Approach, Sideline, Takeoff

Aircraft Noise is measured in A weighted decibels (dBA)
HOW LOUD CAN A COMMERCIAL JET BE?
FAR 36.103 – Noise Limits: A sliding scale based on aircraft weight (Stage IV)
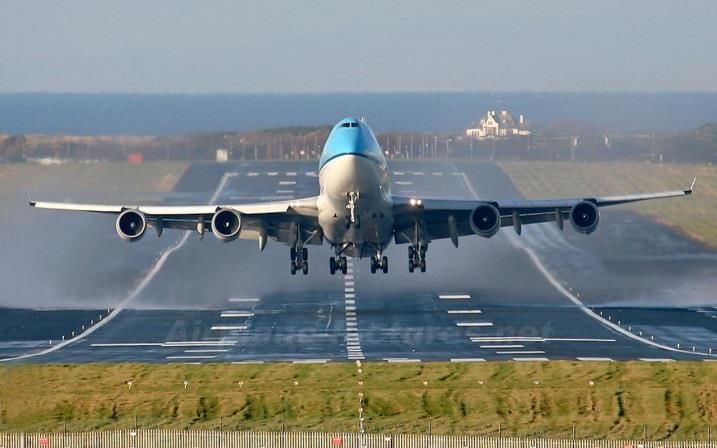
Boeing 747-8I, Max Takeoff Weight = 987,000 lb.
Certification Level Sideline Approach Takeoff
Noise Level (EPNdB) 94.0 100.9 94.5
Noise Limit (EPNdB) 103.0 105.0 106.0
Margin Below Stage IV 9.0 4.1 11.5
Boeing 787-8, Max Takeoff Weight = 502,500 lb.
Certification Level Sideline Approach Takeoff
Noise Level (EPNdB) 91.6 94.2 86.6
Noise Limit (EPNdB) 100.9 104.3 98.0
Margin Below Stage IV 9.3 10.1 11.4
Boeing 737-8 MAX, Max Takeoff Weight = 181,200 lb.
Certification Level Sideline Approach Takeoff
Noise Level (EPNdB) 88.5 94.2 82.6
Noise Limit (EPNdB) 97.2 100.9 92.1
Margin Below Stage IV 8.7 6.7 9.5WHAT DOES A 10 DECIBEL INCREASE IN NOISE EQUATE TO?
= 60 dB
= 70 dB
10 dB increase = 10x sound energy but is only perceived to be 2x louderHOW DOES THE FAA QUANTIFY AIRPLANE NOISE?
DNL – Day-night average sound level over a 24-hour periodDNL NIGHTTIME NOISE PENALTY
DAYTIME AIRCRAFT NOISE NIGHTTIME AIRCRAFT NOISE
1 Event = 1 Event 1 Event = 10 Events
Aircraft operations between the hours of 10 pm and 7 am have a 10 dB penalty added to them to account for the lower ambient noise levels in communities,
which increases the likelihood of these events causing annoyance and sleep disturbanceWHY WAS 65 DNL CHOSEN AS THE THRESHOLD?
Federal Interagency Committee on Urban Noise (FICUN)
Guidelines for Considering Noise in Land Use Planning and Control (1980)
http://www.nonoise.org/epa/Roll7/roll7doc20.pdf
This report established the Federal government’s DNL 65 dB standard and related guidelines for land use compatibilityHOW DOES THE FAA DEFINE SIGNIFICANT NOISE? According to the FAA noise levels of DNL 65 dB or above are generally considered incompatible with residential land uses and people living within the DNL 65 dB or higher contour are considered to be significantly impacted by aircraft noise.
EQUIVELANT DNL NOISE LEVELS

      1 Event/Day SEL 114.4 dBA = 65 DNL

      10 Events/Day SEL 104.4 dBA = 65 DNL

      100 Events/Day SEL 94.4 dBA = 65 DNL
HOW DOES NOISE GET INTO MY HOME?
ChimneyAIRCRAFT PERFORMANCE AND NOISE
AERODYNAMIC FORCES ACTING ON AN AIRPLANE

                          LIFT

DRAG                                              THRUST

                         WEIGHT
THE EVOLUTION OF THE COMMERCIAL JET ENGINE
Pratt & Whitney JT8D-7
Low Bypass Turbofan Pratt & Whitney JT9D-3A
Bypass Ratio = 1:1 1964 High Bypass Turbofan
Fan Diameter = 42.5 in 1970 Fan Diameter = 95.6 in
Max Thrust = 14,000 lbf Bypass Ratio = 5:1
Sideline Noise = 105 dB Max Thrust = 44,250 lbf
727-100 Sideline Noise = 98 dB
Pratt & Whitney JT3C-6
Turbojet 747-100
Bypass Ratio = 0:0 1958
Fan Diameter = 38.8 in
Max Thrust = 11,200 lbf
Sideline Noise = 115 dB 707-120
GE90-94B
High Bypass Turbofan
1995 Bypass Ratio = 9:1
Rolls Royce Trent 1000-A Fan Diameter = 123.0 in
Ultra High Bypass Turbofan Max Thrust = 94,700 lbf
Bypass Ratio = 10:1 2011 Sideline Noise = 93 dB
Fan Diameter = 112.0 in
Max Thrust = 69,294 lbf
Sideline Noise = 87 dB 777-200
787-8AERODYNAMIC EVOLUTION OF THE BOEING 737 FAMILY
Boeing 737 Aerodynamic Efficiency Improvement
30%
737-600W
25%
737-600 737-600
20%
Wingspan 112.6 ft.
15%
10%
737-200 Adv
Wingspan 93.0 ft.
5%
737-200 Adv. 737-500
0%
737-600W 1965 1970 1975 1980 1985 1990 1995 2000 2005
Wingspan 117.4 ft.
Aerodynamic Efficiency Improvement Source: BoeingEVOLUTION OF THE NARROWBODY COMMERCIAL JET
EPNdB Narrowbody Jet Sideline Noise Certification Measurements
120
707
115
-28 dB
110
105
727 737
DC-9
100
95
MD-80 A320
757 737NG
90
737CL MD-90 737 MAX
717
A320 Neo C-Series
85
80
1955 1965 1975 1985 1995 2005 2015 Cert. YearFACTORS THAT EFFECT AIRCRAFT TAKEOFF PERFORMANCE
Aircraft Weight Weather Conditions Airport Elevation Runway Length
Colder
Hotter Higher Lower Longer Higher Shorter Lower
Plane Payload Fuel Engine Thrust Increased Lift Produced Payload Uplift
Reduced Thrust Less Dense Air More Dense Air Weight Weight
ThrustEXPLAINING THE VARIABILITY IN DEPARTURE PROFILES
Los Angeles (LAX) to Sydney (SYD)
Aircraft Assigned: Boeing 747-438 (VH-OJS)
Flight Plan Distance: 7,560 miles
Los Angeles (LAX) to New York (JFK)
Aircraft Assigned: Boeing 747-438 (VH-OJT )
Flight Plan Distance: 2,536 milesHOW MUCH DOES A BOEING 747 WEIGH?
BOEING 747-400 (4x RB211-524H) WEIGHTS
OPERATING EMPTY WEIGHT 394,088 lb. / 178,755 kg.
MAX STRUCTURAL PAYLOAD 148,412 lb. / 67,319 kg.
MAX ZERO FUEL WEIGHT 542,500 lb. / 246,074 kg.
MAX USEABLE FUEL 382,336 lb. /173,425 kg.
MAX TAXI WEIGHT 877,000 lb. / 397,801 kg.
MAX TAKEOFF WEIGHT 875,000 lb. / 396,893 kg.
MAX LANDING WEIGHT 630,000 lb. / 285,763 kg.HOW MUCH FUEL DO WE NEED FOR OUR TRIP?
105,727lbs
No. 2 Tank No. 3 Tank
499,815lbs 83,800 lb. 83,800 lb.
38,011 kg. 38,011 kg.
499,815lbs No. 1 Tank No. 4 Tank
24,000lbs 29,200 lb. 29,200 lb.
11,400lbs 13,245 kg. 13,245 kg.
11,139lbs
546,354lbs
546,354lbs
324,164lbs
870,518lbs
Center Tank
119,500 lb.
870,518lbs 54,204 kg.
3,000lbs
Left Reserve Tank Right Reserve Tank
873,518lbs 8,800 lb. 8,800 lb.
3,992 kg. 3,992 kg.
Left Stabilizer Tank Right Stabilizer Tank
11,450 lb. 11,450 lb.
Boeing 747-400 Fuel Capacity
5,194 kg. 5,194 kg.
Capacity = 386,000 lb. Useable = 382,336 lb. Unusable = 3,664 lb.
175,087 kg. 173,425 kg. 1,662 kg.FUEL LOAD PLANNING
QFA11 LAX-JFK = 2,536 miles QFA18 LAX-SYD = 7,560 miles
Flight Time = 4 hr 39 min Flight Time = 14 hr 5 min
Empty Weight = 394,088 lb. Empty Weight = 394,088 lb.
Fuel = 120,557 lb. Fuel = 373,703 lb.
394,088 lb.
Takeoff Weight = 514,645 767,791 lb.
Takeoff Weight = 394,088
Takeoff Weight Difference
0 lb. lb.
253,146HOW ARE PASSENGER AND CARGO WEIGHTS CALCULATED?
FAA Average Summer Weights (Estimates) Palletized and Containerized Cargo
29 lb. 59 lb.
13 kg. 15 lb. 27 kg.
190 lb. 7 kg.
82 lb.
86 kg. 37 kg.
Adult Child (2-13 years) Checked Carry-On Overweight Weighed prior to loadingCARGO LOAD PLANNING
QFA11 LAX-JFK = 2,536 miles QFA18 LAX-SYD = 7,560 miles
Flight Time = 4 hr 39 min Flight Time = 14 hr 5 min
Empty Weight = 394,088 lb. Empty Weight = 394,088 lb.
Fuel = 120,557 lb. Fuel = 373,703 lb.
Bags/Cargo = 24,888 lb. Bags/Cargo = 33,735 lb.
514,645 lb.
Takeoff Weight = 539,533 801,526 lb.
Takeoff Weight = 767,791
Takeoff Weight Difference
253,146
261,993 lb.PASSENGER LOAD PLANNING
QFA11 LAX-JFK = 2,536 miles QFA18 LAX-SYD = 7,560 miles
Flight Time = 4 hr 39 min Flight Time = 14 hr 5 min
Empty Weight = 394,088 lb. Empty Weight = 394,088 lb.
Fuel = 120,557 lb. Fuel = 373,703 lb.
Bags/Cargo = 24,888 lb. Bags/Cargo = 33,735 lb.
Passengers = 187 (32,435 lb.) Passengers = 416 (71,992 lb.)
539,533 lb.
Takeoff Weight = 568,968 870,518 lb.
Takeoff Weight = 801,526
Takeoff Weight Difference
261,993
301,550 lb.HOW MUCH RUNWAY DO WE NEED TO TAKEOFF?
CALCULATING TAKEOFF DISTANCE

                 Current Automatic Terminal Information Service (ATIS): Los Angeles Int’l Airport (LAX)
          Temperature                Dew Point           Winds   Altimeter Setting             Field Elevation               Departing
          59°F / 15°C                36°F / 2°C          Calm    29.92 in / 1030 mb.           128 ft. / 39 m.               Runway 25R
QFA11 LAX-JFK                                                                  QFA18 LAX-SYD
Density Altitude = 251 ft. / 77 m.                                             Density Altitude = 251 ft. / 77 m.
Takeoff Weight = 568,968 lb. / 258,079 kg.                                     Takeoff Weight = 870,518 lb. / 394,860 kg.
Flap Setting: 20°                                                              Flap Setting: 20°
Power Setting: 1.76 EPR (0% Derate)                                            Power Setting: 1.76 EPR (0% Derate)
Takeoff Runway = 25R (12,091 ft. / 3,685 m. available)                         Takeoff Runway = 25R (12,091 ft. / 3,685 m. available)
Takeoff Distance = 6,050 ft. / 1,844 m.                                        Takeoff Distance = 10,323 ft. / 3,146 m.
Takeoff Speeds = V1-126 kts. VR-126 kts. V2-146 kts.                           Takeoff Speeds = V1-153 kts. VR-168 kts. V2-180 kts.
TEMPERATURE AND PERFORMANCE
°C °F The volume of air ingested into a jet engine is fixed, but the density of that same air is not.
43 110
38 100
Air Intake Volume
32 90
27 80
Air Molecule
21 70
16 60
10 50 Air Density
4 40
-1 30
-7 20
-12 10
Temperature has an inverse correlation with Air Density
Hot air is less dense than cold air and thus the warmer the temperature the less net thrust a jet engine
produces. Warmer temperatures also decrease lift, which increases the length of runway needed for
takeoff, reduces climb performance and lessens the payload weight that can be lifted.TEMPERATURE’S EFFECT ON TAKEOFF PERFORMANCE
Current Automatic Terminal Information Service (ATIS): Los Angeles Int’l Airport (LAX)
Temperature Dew Point Winds Altimeter Setting Field Elevation Departing
59°F
90°F / 15°C
32°C 36°F / 2°C Calm 29.92 in / 1030 mb. 128 ft. / 39 m. Runway 25R
QFA11 LAX-JFK QFA18 LAX-SYD
2,218
Density Altitude = 251 ft.ft. / 676
/ 77 m. m. 2,218
Density Altitude = 251 ft.ft. / 676
/ 77 m. m.
Takeoff Weight = 568,968 lb. / 258,079 kg. Takeoff Weight = 870,518 lb. / 394,860 kg.
Flap Setting: 20° Flap Setting: 20°
Power Setting: 1.76
1.75 EPR (0% Derate) 1.75 EPR (0% Derate)
Power Setting: 1.76
Takeoff Runway = 25R (12,091 ft. / 3,685 m. available) Takeoff Runway = 25R (12,091 ft. / 3,685 m. available)
Takeoff Distance = 6,050 ft. / 1,844 m. Takeoff Distance = 10,323
10,802 ft. / 3,146
3,292 m.
Takeoff Speeds = V1-126 kts. VR-126 kts. V2-146 kts. Takeoff Speeds = V1-153 kts. VR-168 kts. V2-180 kts.
Takeoff Length Difference = 0 ft. / 0 m. Takeoff Length Difference = 0479
ft. ft.
/ 0/m.
146 m.WHY DO AIRPLANES TAKEOFF AND LAND INTO THE WIND?
A headwind equals airspeed over the wings which increases lift
Airplanes takeoff and land into the wind to increase lift and reduce the amount of runway
needed for takeoff and landing. An aircraft sitting at the end of the runway pointed into a 15
knot headwind has ground speed of 0 and an airspeed of 15 knots.WIND’S EFFECT ON TAKEOFF PERFORMANCE
Current Automatic Terminal Information Service (ATIS): Los Angeles Int’l Airport (LAX)
Temperature Dew Point Winds Altimeter Setting Field Elevation Departing
59°F / 15°C 36°F / 2°C Calm
250°/15 29.92 in / 1030 mb. 128 ft. / 39 m. Runway 25R
QFA11 LAX-JFK QFA18 LAX-SYD
Density Altitude = 251 ft. / 77 m. Density Altitude = 251 ft. / 77 m.
Takeoff Weight = 568,968 lb. / 258,079 kg. Takeoff Weight = 870,518 lb. / 394,860 kg.
Flap Setting: 20° Flap Setting: 20°
Power Setting: 1.76 EPR (0% Derate) Power Setting: 1.76 EPR (0% Derate)
Takeoff Runway = 25R (12,091 ft. / 3,685 m. available) Takeoff Runway = 25R (12,091 ft. / 3,685 m. available)
Takeoff Distance = 6,050
5,601 ft. / 1,844
1,707 m. Takeoff Distance = 10,323
9,676 ft.ft./ /2,949
3,146m.
m.
Takeoff Speeds = V1-126 kts. VR-126 kts. V2-146 kts. Takeoff Speeds = V1-153 kts. VR-168 kts. V2-180 kts.
Takeoff Length Difference = 0-449
ft. /ft.0 /m.-137 m. Takeoff Length Difference = 0-647
ft. /ft.0 /m.-197 m.ALTITUDE AND TAKEOFF PERFORMANCE
0 Temperature = 59°F / 15°C
Dew Point = 36°F / 2°C
Altimeter = 29.92 Hg.
ALT Winds = Calm
CALIBRATED
TO 1
0000
5
4
3
2
35,000 FEET
LAX Field Elevation = 128 ft. / 39 m.
DEN Field Elevation = 5,434 ft. / 1,656 m.
Altitude has an inverse correlation with air density
At higher altitudes the air is less dense, decreasing the lifting effectiveness of the wing. Altitude
also effects engine performance, reducing the net thrust output from a jet engine. Both of these
factors combined increase the amount of runway needed for takeoff, negatively impact aircraft
climb performance and restrict the payload weight that can be lifted.ALTITUDE’S EFFECT ON TAKEOFF PERFORMANCE
Current Automatic Terminal Information Service (ATIS): Los Angeles Int’l Airport (LAX)
Temperature Dew Point Winds Altimeter Setting Field Elevation Departing
59°F / 15°C 36°F / 2°C Calm 29.92 in / 1030 mb. 128 ft.ft.
5,434 / 39 m. m.
/ 1,656 Runway 25R
QFA11 LAX-JFK QFA18 LAX-SYD
6,790
Density Altitude = 251 ft.ft. / 2,069
/ 77 m. m. 6,790
Density Altitude = 251 ft.ft. / 2,069
/ 77 m. m.
Takeoff Weight = 568,968 lb. / 258,079 kg. Takeoff Weight = 870,518 lb. / 394,860 kg.
Flap Setting: 20° Flap Setting: 20°
Power Setting: 1.76
1.79 EPR (0% Derate) Power Setting: 1.76
1.79 EPR (0% Derate)
Takeoff Runway = 25R (12,091 ft. / 3,685 m. available) Takeoff Runway = 25R (12,091 ft. / 3,685 m. available)
Takeoff Distance = 6,050 ft. / 1,844 m. Takeoff Distance = 10,323
15,701 ft. / 3,146
4,786 m.
V1-128 kts. VR-126
Takeoff Speeds = V1-126 VR-128 kts. V2-146 kts. Takeoff Speeds = V1-153
V1-156 kts. VR-168
VR-170 kts. V2-180 kts.
Takeoff Length Difference = 0 ft. / 0 m. Takeoff Length Difference = 05,378
ft. / 0ft.m.
/ 1,639 m.WEIGHT RESTRICTION DUE TO RUNWAY LENGTH
AVAILABLE RUNWAY LENGTH’S EFFECT ON AIRCRAFT WEIGHT

                 Current Automatic Terminal Information Service (ATIS): Los Angeles Int’l Airport (LAX)
          Temperature                Dew Point               Winds   Altimeter Setting             Field Elevation                  Departing
          59°F / 15°C                36°F / 2°C              Calm    29.92 in / 1030 mb.           128 ft. / 39 m.                  Runway 25R
                                                                                                                                           24L
QFA11 LAX-JFK                                                                      QFA18 LAX-SYD
Density Altitude = 251 ft. / 77 m.                                                 Density Altitude = 251 ft. / 77 m.
Takeoff Weight = 568,968 lb. / 258,079 kg.                                         Takeoff Weight = 870,518
                                                                                                    823,200 lb. / 394,860
                                                                                                                  373,397 kg. (0 Bags/Cargo and -74 Passengers)
Flap Setting: 20°                                                                  Flap Setting: 20°
Power Setting: 1.76 EPR (0% Derate)                                                Power Setting: 1.76 EPR (0% Derate)
Takeoff Runway = 25R (12,091ft.ft./ 3,028
                 24L (9,935         / 3,685m.m.available)
                                                available)                         Takeoff Runway = 25R (12,091ft.ft./ 3,028
                                                                                                    24L (9,935         / 3,685m.m.available)
                                                                                                                                   available)
Takeoff Distance = 6,050 ft. / 1,844 m.                                            Takeoff Distance = 10,323
                                                                                                      9,165 ft.ft./ /2,793
                                                                                                                      3,146m.
                                                                                                                            m.
Takeoff Speeds = V1-126 kts. VR-126 kts. V2-146 kts.                               Takeoff Speeds = V1-153
                                                                                                    V1-148 kts. VR-168
                                                                                                                VR-163 kts. V2-180
                                                                                                                            V2-177 kts.
Takeoff Weight Difference = 0 lb. / 0 kg.                                          Takeoff Weight Difference = 0-47,318
                                                                                                                  lb. / 0 kg.
                                                                                                                          lb. / -21,463 kg.
QFA11 LOS ANGELES INT’L (LAX) LOOP.8 DEPARTURE SID
To
DAG
COOPP
KEGGS
SMO
LAX
PACIFIC OCEANQFA18 LOS ANGELES (LAX) PERCH.1 DEPARTURE SID
VTU
SMO
LAX
PERCH
PACIFIC OCEANAVERAGE DEPARTURE TRACK PROFILE COMPARISON
Ft. QFA11 (LAX-JFK) 568,968 lb. / 258,079 kg. QFA18 (LAX-SYD) 870,518 lb. / 394,860 kg.
24,000
Climb Rate
22,000 2,500 ft./min
20,000
18,000 4,769 ft.
16,000
3,750 ft. Climb Rate
14,000
1,900 ft./min
12,000
3,048 ft.
10,000
8,000
2,115 ft.
6,000
4,000
2,000 0 ft.
0
0 41 82 129 179 234 280 332 373 417 472 Sec.PERFORMANCE BASED NAVIGATION
WHAT IS A METROPLEX?
             METROPLEX
Geographic area that includes several
commercial and general aviation airports in                 Seattle
close proximity serving large metropolitan
areas.                                                 Portland

The FAA has identified 21 metroplex areas                                                       Minneapolis                                     Boston
where airspace congestion and other                                                                           Detroit
                                                                                                                          Cleveland
                                                                                                                                            New York/Newark
limiting factors such as environmental                                                             Chicago
                                                                                                                                         Philadelphia
                                                                                                                Pittsburgh
constraints combine to create bottlenecks         San Francisco
                                                                                 Denver
                                                                                                                                       Baltimore
that effect system efficiency nation wide.                                                                         Cincinnati         Washington D.C.
                                                                                                       St. Louis
                                                                  Las Vegas
                                                        Los Angeles                                                           Charlotte
                                                                                                        Memphis
                                                San Diego              Phoenix                                          Atlanta
                                                                                          Dallas/Fort Worth

                                                                                             Houston                              Orlando
                                                                                                                    Tampa
                                                                                                                                      Fort Lauderdale
                                                     FAA Metroplex                                                                    Miami
WHAT IS OAPM? Optimization of Airspace & Procedures in the Metroplex Optimization of the airspace and procedures encompassing multiple airports in a metroplex region provides for the most efficient traffic management solutions on both a regional and national basis. By examining airspace problems on a regional scale the FAA can customize the solutions to ensure they maximize throughput of airplanes through the entire airspace in the safest and most efficient manner possible while at the same time customizing procedures to meet the unique requirements of individual airports.
WHAT IS PBN?
 Performance Based Navigation
A transformational change from
conventional ground-based navigation aids
and procedures to satellite-based navigation
aids and area navigation procedures, which
are more accurate and allow for shorter,
more direct routes between two given
points as well as more efficient takeoffs and
landings.

PBN enables aircraft to fly on any desired
flight path within the coverage of ground or
satellite based navigation aids using the
aircraft’s capability to navigate by means of
performance standards utilizing either Area
Navigation (RNAV) or Required Navigation
Performance (RNP).

                                                  Ground Based Navigational Aid   Satellite Based Navigational Aid
WAYPOINT TYPES
Fly-By Waypoint Fly-Over Waypoint
Much greater predictability Much less flight path
in the flight path flown and a predictability caused by
narrower track dispersion. overflying the waypoint
and having to turn back to
The aircraft navigation recapture the track to the
system will anticipate the next waypoint.
turn and calculate the radius
of the turn to intercept the Differences in airspeed and
next waypoint. aircraft mass result in a
wide track dispersion
during the turn.WHAT IS RNAV?
Area Navigation
Developed in the 1960s, with the first routes
being published and flown in the 1970s.
This method of instrument flight rules (IFR) RNAV 1
navigation allows an aircraft to choose any Within 1 nm 95% of flight time
course within a network of navigation
beacons, rather than navigate directly to
and from the beacons.
Track Centerline
RNAV requires an aircraft to be equipped
with a GPS navigation system like a Flight
Management System (FMS) which uses the
GPS to triangulate the aircraft’s position to
within a circle with a defined radius. Within 1 nm 95% of flight time
RNAV is primarily used for departure
procedures and/or arrival procedures that
RNAV 1 – implies you have a 95% probability of keeping within 1 nm of your track course
do not require the narrow tolerances
defined by RNP procedures.FLYING AN RNAV DEPARTURE
WHAT IS RNP?
Required Navigation Performance
                                                                                               RNP 0.1
Developed in the early 1990s, with the first
route being published and flown in 1996 by
                                                                                                  Alert
Alaska Airlines at Juneau, Alaska.
                                                     Within 0.2 nm 99.999% of flight time
This method of instrument flight rules (IFR)
navigation is fundamentally similar to RNAV          Within 0.1 nm 95% of flight time
with the difference being that RNP
incorporates onboard performance                     Track Centerline
monitoring and alerting.

The Flight Management System (FMS) uses              Within 0.1 nm 95% of flight time
position data from two independent GPS
receivers as well as inertial navigation data        Within 0.2 nm 99.999% of flight time
to crosscheck and monitor the position of
the aircraft. The system reports to the                                                           Alert
pilots if the position accuracy falls outside
the tolerances for the given procedure.              RNP 0.1 – implies you have a 95% probability of keeping within 0.1 nm of your track course
                                                     RNP 0.2 – implies you have a 95% probability of keeping within 0.2 nm of your track course
RNP is primarily used for approaches into            RNP 0.3 – implies you have a 95% probability of keeping within 0.3 nm of your track course
airports surrounded by mountainous terrain
and/or other obstacles.                         RNP 0.1 - Alert if the probability of keeping within 0.2 nm of the course centerline is less than 99.999%
FLYING AN RNP APPROACH
WHAT IS A SID?
Standard Instrument Departure
An IFR air traffic control departure
procedure that utilizes a series of specific
waypoints, headings and altitudes to
organize traffic departing the airport and
place aircraft on a fixed route with defined
transition points exiting the airspace.

SIDs are optimized for air traffic control
routing efficiency while striking a balance
between terrain and obstacle avoidance,
noise abatement and airspace management.

A specific SID is assigned to an IFR flight by
ATC based on a combination of the aircraft’s
destination, the first waypoint in the flight
plan and the takeoff runway assigned.

Phoenix Sky Harbor Int’l
KPHX - YOTES.3 SID Illustrated
PHOENIX SKY HARBOR INT’L (PHX) YOTES.3 DEP. RNAV SID
            GCN

                                                JARPA
                                        YOOPR

                                YOTES

                               MRBIL

               ZILUB     POCCK
           OXYGN       GOALY

           TWSND       SPRKY
WHAT IS A STAR? Standard Terminal Arrival Route An IFR air traffic control arrival procedure that utilizes a series of specific waypoints, headings and altitudes to organize traffic arriving to the airport by placing airplanes on fixed routes with defined transition points entering the airspace. STARs cover the portion of the flight between the top of descent and the initial approach fix to the runway. The STAR simplifies ATC clearance procedures and allows for a smooth transition of aircraft between en-route and approach controllers. Assignment of STARs by ATC is dictated by many factors including the weather conditions, runway/approach in use as well as airport congestion. San Francisco Int’l KSFO - WWAVS.1 STAR Illustrated
SAN FRANCISCO INT’L (SFO) WWAVS.1 ARR. RNAV STAR

MVRKK
WESLA
 THEEZ

 WPOUT

         WWAVS

             NRRLI

                     SERFR

                             STOKD
WHAT’S THE DIFFERENCE BETWEEN AN ARRIVAL AND AN APPROACH?
Arrival Approach
An arrival procedure An approach procedure
covers the portion of the cover the portion of the
flight from the top of flight from the initial
descent point in cruise approach fix down to the
flight down to a position runway.
just short of the initial fix
on a specific approach. ATC sequences airplanes
onto an approach to a
Arrivals don’t end at a specific runway at set
runway end, but rather intervals. The approach
usually terminate near procedure guides the
the initial fix for a specific aircraft down to the
approach. runway.REAL WORLD EXAMPLE AAL530 (SEA-PHL)
AAL530 FLIGHT DETAILS
                             AIRBUS A321-231T (Transcon)
                                  Aircraft: N102NN
                                     Filed: FL330
                                  ETE: 4 hr 42 min

Route: KSEA SUMMA8 SUMMA J54 BKE KU87Q RAP HAYNS GIJ J146 WOOST J34 DJB EWC JST BOJID1 KPHL
SEATTLE-TACOMA (SEA) SUMMA.8 DEP. SID
NEVJO
OLM
SUMMA
BKE
LKVAAL530 ENROUTE FLIGHTPATH
SUMMA
BKE
KU87Q
HAYNS
RAP
WOOST DJB EWC
JST
GIJ
Route: KSEA SUMMA8 SUMMA J54 BKE KU87Q RAP HAYNS GIJ J146 WOOST J34 DJB EWC JST BOJID1 KPHL
Origin SID Waypt. Trans. VOR Airway Trans. STAR Dest.PHILADELPHIA INT’L (PHL) BOJID.1 RNAV ARR. STAR
PSB
JST MIROY COFAX LOMON HAR
BOUHN
LRP
BUNTS SCOOL BOJID
FERUS
EYRIE
TRAGG
KYILL HIFAL
EXPRS
WHEYYFLIGHT PROCEDURE DESIGN
PRIMARY DESIGN CONSIDERATIONS

           SAFETY OF FLIGHT                    AIRSPACE EFFICIENCY
•   Terrain Clearance                  •   Increase System Throughput

•   Obstacle Clearance                 •   Increase Predictability of Operations

•   Aircraft Performance Limitations   •   Reduce Required Aircraft Spacing

•   Traffic Separation                 •   Reduce Track Miles Flown

•   Traffic Deconfliction              •   Reduce Radio Communications
TERRAIN AND OBSTACLE CLEARANCE
Maintain Separation
• Minimum Climb Gradient
• Maximum Descent Gradient
• Altitude Crossing Limits
• Minimum Turn Radius
• Airspeed Restrictions
• Navigation Error Tolerance
• Aircraft RestrictionsAIRCRAFT PERFORMANCE LIMITATIONS
Vertical Profile – Climb Gradient
Minimum climb gradients are predicated on the worst case scenario:
Losing an engine on takeoff with the aircraft at maximum takeoff weight on a very hot day.
The vertical profile must allow all aircraft to clear all obstacles safely with one engine inoperative.
500 ft.
1 nm = 6,076 ft.AIRCRAFT PERFORMANCE LIMITATIONS
Lateral Profile – Turn Radius
Max Takeoff Weight = 987,000 lb. / 447,696 kg.
Max Takeoff Weight = 502,500 lb. / 227,930 kg.
Airspeed, Wing Loading
and Mass determine the
turn radius of a particular
aircraft.
Max Takeoff Weight = 181,200 lb. / 82,191 kg.
Aircraft with a smaller
mass flying at a lower
airspeed can turn within a
tighter radius.
Max Takeoff Weight = 64,500 lb. / 29,257 kg.TRAFFIC SEPARATION / DECONFLICTION
Boeing 747-8I
Cruise Speed = 570 mph
Approach Speed = 172 mph
Max Takeoff Weight = 987,000 lb.
Boeing 787-8
Cruise Speed = 560 mph
Approach Speed = 161 mph Semi-Truck
Max Takeoff Weight = 502,500 lb.
Cruise Speed = 70 mph
Max Weight = 80,000 lb.
Boeing 737-8 Max
Cruise Speed = 522 mph Bicycle
Approach Speed = 163 mph Cruise Speed = 15 mph
Max Takeoff Weight = 181,200 lb. Avg. Weight = 200 lb.
Bombardier Q400
Cruise Speed = 414 mph
Approach Speed = 145 mph
Max Takeoff Weight = 64,500 lb.
Cessna 172
Cruise Speed = 140 mph
Approach Speed = 75 mph
Max Takeoff Weight = 2,550 lb.TRAFFIC SEPARATION / DECONFLICTION
PHL
EWR
JFK
LGA
BWI
DCA
IADTRAFFIC SEPARATION / DECONFLICTION
FJC
RBV
PTW
PNE
HOLEY
STEFE
DAVYS
MXE
RUUTH
STOEN CYN
DITCH
DQO
OOD
PHL
VCN EWR
LGAINCREASE THROUGHPUT / PREDICTABILITY
REDUCE REQUIRED AIRCRAFT SPACING
                                                                    E145
A319                       E175
                                                                                                         A306
                                                           MD90

        DH8A               B762

                                                             E190                                   A343
        A310
                                     B752
                                                                                  B712
       B733                                                                                                     B738
                                   A333
                                                                                    MD11
              B772
                                                      CRJ2                                                         DH8C

                                                                                           A320
  B739                                      DC10

                                                                                              B744
         CRJ7                     B763
                                                                           B737
                 A346
                                                                                                           MD83
                                                    A321

          A332                               B788                                                 A359
REDUCE TRACK MILES FLOWN
GCN
GOALY
JARPA
YOOPR
OXYGN
YOTES
TWSND
MRBIL
ZILUB POCCK
OXYGN GOALY
SPRKY
TWSND SPRKYACKNOWLEDGEMENTS
A special thank you to Dan Yeung and Kathryn Pantoja of LAWA’s Environmental Department for
providing the LAX flight track data used as the basis for the comparative analysis of Qantas flights.
The following programs and sources were used to create this presentation.
Casper Noise
Adobe Photoshop CC 2016
AirNav.com (airnav.com)
Boeing 747-400 Airplane Characteristics for Airport Planning (boeing.com/commercial/airports/plan_manuals.page)
Esri ArcGIS ArcMap v10.3.1
Federal Aviation Administration (faa.gov)
International Civil Aviation Organization (icao.int)
Lockheed Martin Prepar3D v4.2 (prepar3d.com)
Microsoft Excel 2016
Microsoft PowerPoint 2016
Navigraph FMS Data AIRAC Cycle 1802 (navigraph.com)
Plane Simple Truth – Clearing the Air on Aviation’s Environmental Impact (2008)
Precision Manuals Development Group Boeing 747-400 Simulation (precisionmanuals.com)
Professional Flight Planner X (flightsimsoft.com/pfpx)
Take-Off and Landing Performance Calculation Tool (flightsimsoft.com/topcat)QUESTIONS?
You can also read