Operations and Financial Update Third Quarter 2018 - International Petroleum Corp.
←
→
Page content transcription
If your browser does not render page correctly, please read the page content below
International Petroleum Corp.

                     Operations and Financial Update
                                  Third Quarter 2018
                                           Mike Nicholson, CEO
                                  Christophe Nerguararian, CFO
                                              November 6, 2018

NCF00101
           Q3 2018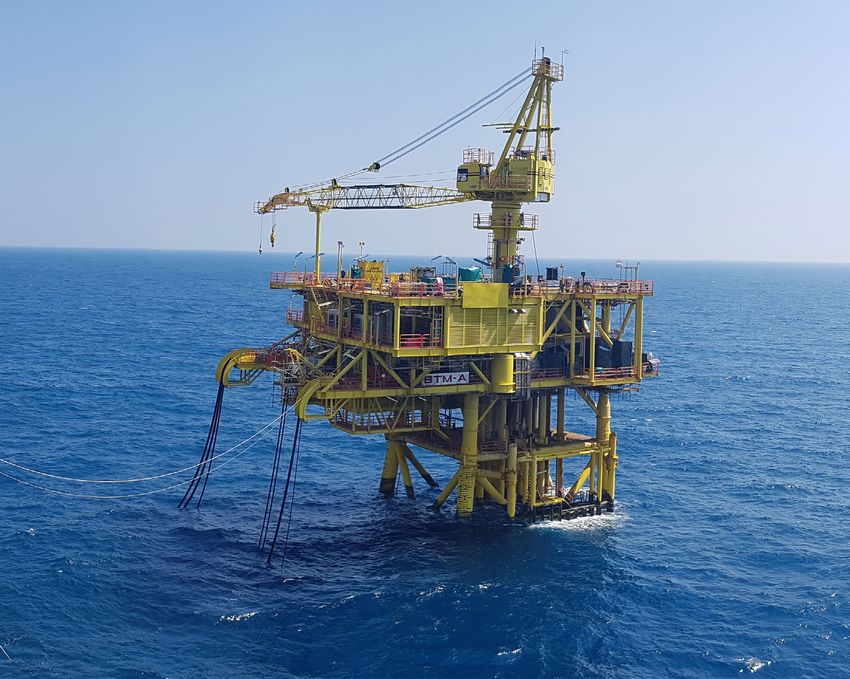
International Petroleum Corp.
                     Corporate Strategy

                       Deliver operational excellence

                       Maintain financial resilience

                       Maximize the value of our resource base

                       Grow through M&A
NCF00101 p01 10.18

                                                                 2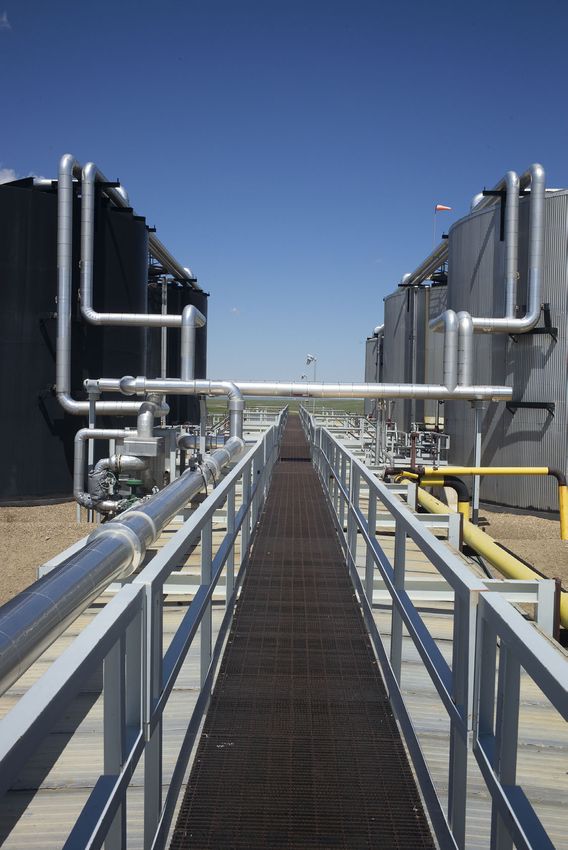
International Petroleum Corp.
                     Q3 2018 Highlights

                                                           Q3 average production at 35,200 boepd, high end of Q3 guidance
                           Production Guidance
                                                           Full year average production expected at or above 34,000 boepd

                                                           Q3 operating cost of 12.0 USD/boe, year to date 12.1 USD/boe
                           Operating Costs (1)
                                                           Full year guidance retained at 12.6 USD/boe

                                                           Capital expenditure guidance maintained at 44 MUSD
                           Organic Growth
                                                           Maturing organic growth opportunities for 2019 execution in all countries
                                                           Full year OCF guidance of 161 to 233 MUSD (Brent 50 to 70 USD/bbl)
                                                           Q3 OCF of 68 MUSD
                           Operating Cash Flow (OCF) (1)
                                                           First nine months OCF of 221 MUSD; 95% of full year guidance at 70 USD/bbl
                                                           Net debt (1) down from 355 to 213 MUSD since Suffield acquisition (5 Jan 2018)

                           M&A                             Announced proposed acquisition of BlackPearl Resources – highly value accretive

                           HSE                             No material incidents
NCF00101 p02 10.18

                     1)
                          Non-IFRS measure, see MD&A
                                                                                                                                             3
International Petroleum Corp.
                     Production Growth
                               Record production level in Q3
                               Full year forecast expected at or above top end of guidance range (32,500 – 34,000 boepd)
                             40,000
                                                                          Original CMD guidance                     Q4 to date (1)
                                                                                                  34,900 35,200
                                                                                         32,900
                                                                                                                          Latest guidance
                             30,000

                                                                      >3x
                     boepd

                             20,000
                                                 10,300 boepd

                             10,000

                                      Q1        Q2              Q3   Q4
NCF00101 p06 10.18

                                 0
                                                     2017                                Actual   Actual   Actual    Q4
                                                                                          Q1       Q2       Q3
                                                                                                       2018
                                                                                                                                            1)
                                                                                                                                                 As at end October 2018
                                                                                                                                                                          4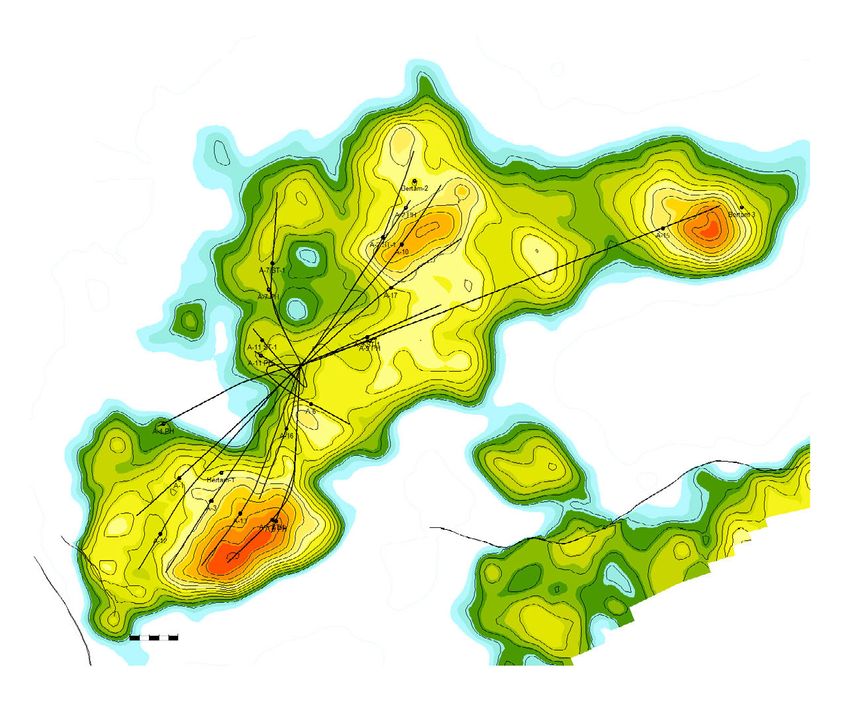
International Petroleum Corp.
                     Low Operating Costs (1)

                        CMD guidance of USD 12.6 (2) per boe retained

                                                     20

                                                                             16.1

                                                     15                                     -22%
                                           USD/boe

                                                                                                           12.6 (2)
                                                                                                                      YTD 12.1
                                                                                                                      Q3 12.0

                                                     10

                                                      0
NCF00101 p08 10.18

                                                                         2017 Actual               2018 Guidance
                                                          1)
                                                               Non-IFRS measure, see MD&A           2)
                                                                                                         Full year guidance
                                                                                                                                 5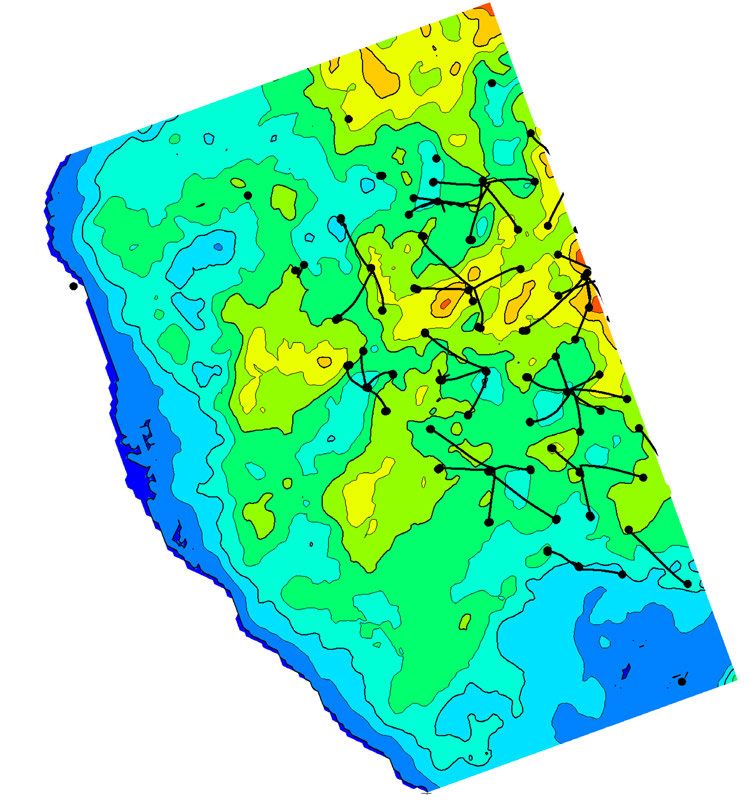
International Petroleum Corp.
                     Operating Cash Flow (1)
                      First nine months operating cash flow => 95% of full year guidance (2)
                      Net Debt (1) reduced by 38% to 213 MUSD since Suffield acquisition completion
                                                                                                                                              Significantly exceeding
                                                  250                                                                                         CMD OCF Forecast
                                                        233                       70 USD/bbl (4)                   221
                                                                                                              @ 72.1 USD/bbl
                                                  200   201                       60 USD/bbl (4)               Brent price

                                                        161                       50 USD/bbl (4)
                                                  150
                                    Million USD

                                                  100

                                                   50
NCF00101 p12 10.18

                                                   0
                                                                2018 Guidance (3)                                 9M 2018
                                                        1)
                                                             Non-IFRS measure, see MD&A      2)
                                                                                                  at 70 USD/bbl    3)
                                                                                                                        Based upon original 2018 mid-point production guidance   4)
                                                                                                                                                                                      Brent oil price assumptions
                                                                                                                                                                                                                    6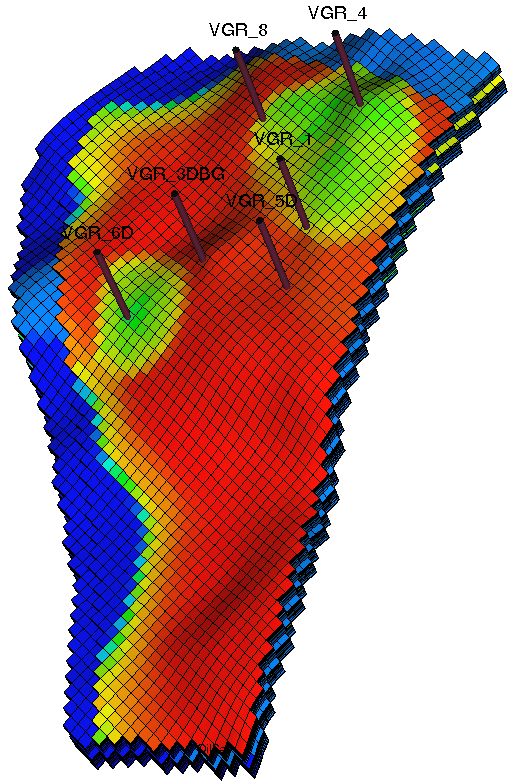
International Petroleum Corp.
                         Capital Expenditure (net)

                            2018 Capital Expenditure maintained at 44.0 MUSD

                            Additional capital approved in Q2 mainly for gas optimisation in Canada

                            Keruing-1 exploration well in Malaysia
                                 Exploring opportunities to integrate with 2019 infill campaign (A14 pilot)

                Canada – 14.6 MUSD                                                              Netherlands – 1.4 MUSD
                                                                    France – 6.6 MUSD
                     - Oil drilling and preparation                                             - Development Well (E17)
                                                                    - Paris Basin
                     - Maintenance capital                                                      - Maintenance capital
                                                                       - Vert-La-Gravelle
                     - Gas optimisation                                - Well reactivations
                                                                       - Maintenance capital
                                                                                                                  Malaysia – 21.4 MUSD
                                                                                                                   - Infill wells (carryover from 2017)
                                                                                                                   - Keruing-1 well
NCF00101 p26 10.18

                          CMD guidance
                          Additional activity

                                                                                                                                                          7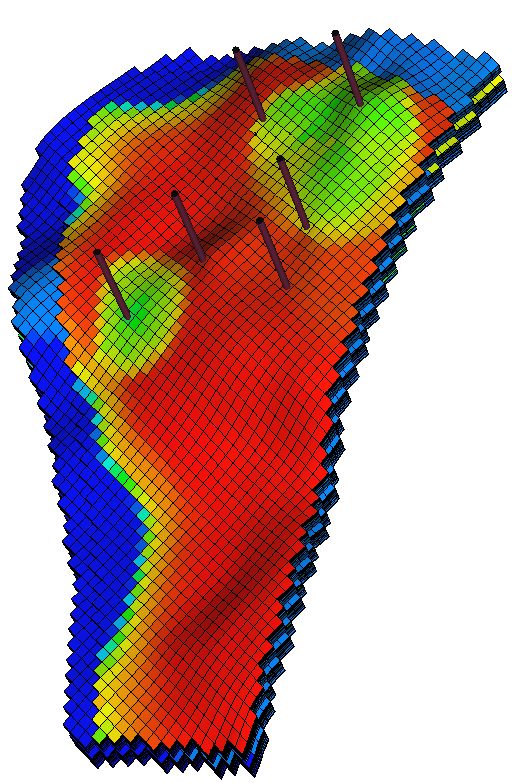
International Petroleum Corp. N 2016 Infill A15
Future Growth in Malaysia
2017 Infill Campaign
Infill A16 Infill A17
Production
Operational performance remains strong – >99% facility uptime Future infills
Infill wells continue to perform ahead of expectations
Bertam A14
Growth Optimise for
2019 execution
Maturing 2019 infill campaign – 3 locations identified
0 500m Keruing (I-35)
Evaluating additional locations
Opportunity to align appraisal and Keruing campaigns
Bertam A-15 -Water Cut Performance
80
to minimise cost and reduce development risk for A14
Year end 2016
60
2P prediction
Water Cut (%)
40
CMD
20
Actual
-
NCF00101 p14 10.18
Nov
Dec
Nov
Dec
Nov
Dec
Feb
Sep
Feb
Sep
Feb
Sep
Jun
Jun
Jun
Jul
Oct
Jul
Oct
May
Jul
Oct
May
Jan
Mar
May
Jan
Mar
Jan
Mar
Apr
Aug
Apr
Aug
Apr
Aug
2016 2017 2018
8International Petroleum Corp.
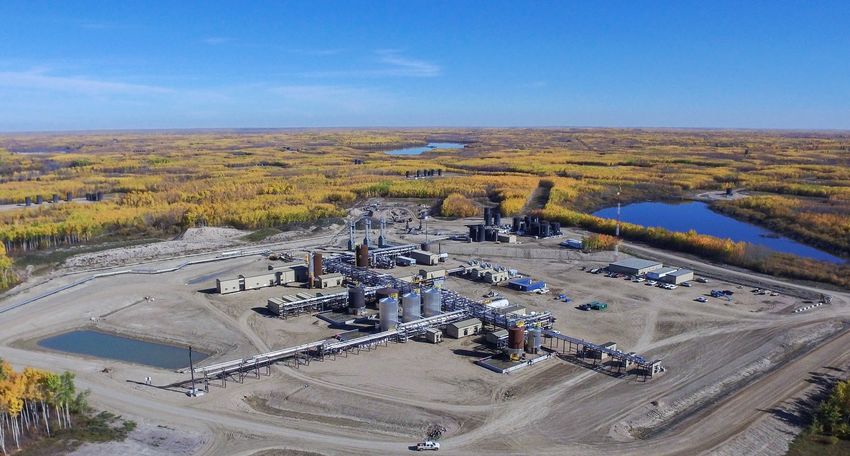
Strong Delivery from Canadian Gas
Canada Gas Annual Historical Decline Rates (1)
4%
2%
2%
Gas performance continues to exceed expectation
Average Annual Decline Rate (%)
0%
Q3 production ahead of 2017 average -2% 3%
Annual declines of 9% arrested -4%
-6%
More opportunities for gas optimisation activities 9% 9% 8% 8%
in late 2018 and 2019 -8%
10%
-10% 11%
-12%
Recompletion / Stimulation program commenced in October -14%
2012 2013 2014 2015 2016 2017 2018 Q3 vs 2017
Production on line late Q4 Year to date
Average annual decline 9%
Canada Gas Production Production
130,000
optimisation
Winter
120,000 freeze-offs
Gross Production (MMscf/d)
110,000
100,000
Original guidance
90,000
9% decline
80,000
70,000
60,000
Sep-16
Sep-17
Sep-18
Jan-16
Apr-16
Jan-17
Apr-17
Jan-18
Apr-18
May-16
May-17
May-18
Mar-16
Nov-16
Dec-16
Mar-17
Nov-17
Dec-17
Mar-18
Aug-16
Nov-18
Dec-18
Aug-17
Aug-18
Oct-16
Jun-16
Oct-17
Jun-17
Oct-18
Jun-18
Jul-16
Jul-17
Jul-18
Feb-16
Feb-17
Feb-18
NCF00101 p25 10.18
2016 (1) 2017 (1) 2018 (2)
(1)
IHS Accumap (2)
IHS Accumap supplemented with IPC data
9Vert-La-Gravelle Hydrocarbon Saturation
International Petroleum Corp. Development target
Organic Growth in France
Vert-La-Gravelle Development target
Horizontal wells and engineering unlocks significant Water
injector
potential
Vert-La-Gravelle
Engineering and planning matured for 1H 2019 execution producing well
Robust economics at low oil prices, upside leverage
to Brent pricing
Villeperdue Reservoir Thickness
Villeperdue
ge
Seismic interpretation shows multiple targets
ra
c Cove
2C contingent resources 4 MMboe (YE17) (1)
i
eism
3D S
Robust economics at low oil prices
Potential
development
targets
NCF00101 p24 10.18
Villeperdue
producing well
1)
As at December 31, 2017, see Reader Advisory extent
10International Petroleum Corp.
Net Asset Value Per Share vs Share Price(1)
USD per share
11 11
NAV per share IPCO USD share price
10 10
01/01/18
USD 9.1
USD per share
9 9
Additional gas
optimisation in
8 Canada approved 8
9 %
+8
7 ~51%7
discount
Infill drilling to NAV
6 Canada acquisition starts in Malaysia 6
01/01/17 Malaysia infill and announced
5
USD 4.8 France 3D seismic 5
announced
~26%
discount 4 4
to NAV BlackPearl
acquisition
3 Canada acquisition Infill wells Keruing-1 announcement 3
Listing completed online exploration well
17.5 MMboe CR approved (Malaysia)
2 France 3D seismic 2
announced
25.5 M shares purchased completed
1 and cancelled at 1
3.53 USD/share
0 0
Apr May Jun Jul Aug Sep Oct Nov Dec Jan Feb Mar Apr May Jun Jul Aug Sep Oct Nov Dec
NCF00101 p05 10.18
2017 2018
1)
See MD&A, AIF and Press Release of February 26, 2018
11BlackPearl Proposed Acquisition
Highlights
Adds forecast 16,000 boepd production
in 2019 (1)
~50% increase
>2x 2P reserves to 292 MMboe (2) for the
combined company
+7 years on reserve life (3)
+789 MMboe contingent resources (2)
Addition of high calibre team with long
track record of value creation
Expected completion in December 2018,
subject to regulatory and shareholder
approvals
NCF00101 p21 06.18
1)
Based on BlackPearl’s estimates, see Reader Advisory
2)
As at December 31, 2017, see Reader Advisory
3)
See Reader Advisory
12International Petroleum Corp.
Canadian Macro Supply and Pipeline Egress
Estimated US Midwest refining outages (2018) Western Canada oil supply
vs. WCS differential vs. pipeline egress
7.5
W. CAN current rail loading capacity (1,044)
1,400 60 7.0 Keystone XL (789)
WCS diff.
Actual outages 6.5 TMX (590)
Remaining outages ENB Southern Lights reversal (143)
Estimated US Midwest refining outages
1,200 6.0
789) ENB Line 4 capacity restoration (25)
50 ne XL (
5.5 Keysto ENB system station upgrades (95)
TMX (590) ENB Bakken Express pipeline idle (100)
1,000 5.0
ENB system DRA optimisation (75)
WCS differential
4.5
(thousand bbl/d)
million bbl/d
ENB Line 3 replacement (352) ENB Line 3 replacement (352)
(USD/bbl)
40
800 4.0 Rangeland/Milk River (107)
Spectra express (224)
TransMountain current* (264) Spectra express (224)
3.5 TransMountain current* (264)
Keystone current (561)
600 3.0 Keystone current (561)
30
ENB mainlines current*^ (2,313)
2.5
AB & SK refineries & industry demand (683)
400 2.0 W. CAN total oil supply to market
ENB mainlines current*^ (2,313)
W. CAN blended heavy oil supply to market
20 1.5
W. CAN light/med oil supply to market
200 1.0 * net of NGLs/refined products
^ net of Bakken Express volumes (125)
0.5
AB & SK refineries industry demand (683) (2023e mb/d thruput in brackets)
0 10 0.0
Jan Feb Mar Apr May Jun Jul Aug Sep Oct Nov Dec Jan 2016 2017 2018 2019 2020 2021 2022 2023
06.18
p22 10.18
Source: GMP FirstEnergy, Bloomberg Source: GMP FirstEnergy, CAPP, Alberta Energy Regulator, Company disclosure
NCF00101 p18
NCF00092
13IPC and BlackPearl
2P Net Asset Value (NAV) – Transaction Highly Value Accretive
3,000
2,850 2,850 69
PXX
355 IPCO
2,500 2,426
2,000
1,699 71% discount to
combined core NAV
MUSD
1,500
1,000
702
PXX 308
500 1,151
IPCO 394
0
IPCO PXX IPCO/PXX IPCO/PXX IPCO/PXX IPCO+PXX
2P Asset Value 2P Asset Value 2P Asset Value Net Debt(2) Core 2P NAV(1) Market Cap(3)
NCF00101 p18 10.18
NPV8(1) NPV8(1) NPV8
1) As at December 31, 2017, see Reader Advisory 2) Non-IFRS measure, see Reader Advisory. As at January 1, 2018 3) Based on the closing price as at November 2, 2018, converted to USD
14Third Quarter 2018
Financial Highlights
15First Nine Months 2018
Financial Highlights
Third Quarter First Nine Months
2018 2018
Production (boepd) 35,200 34,400
Average Dated Brent Oil Price (USD/boe) 75.2 72.1
Operating costs (USD/boe) (1) 12.0 12.1
Operating cash flow (MUSD) (1) 67.9 220.7
EBITDA (MUSD) (1) 66.2 206.0
Net result (MUSD) 26.5 74.3
(¹)
Non-IFRS Measure, see MD&A
16International Petroleum Corp.
Realised Prices
Brent, WTI, WCS and realised oil prices AECO, Empress and realised gas prices
Bertam Realised oil price Brent Spot
Realised price year to date in line with Realised Price CAD/Mcf
France Realised oil price WTI Spot with CMD guidance of 2.40 CAD/Mcf Empress / AECO diff
Suffield Realised oil price WCS Spot AECO Day Ahead Index
Brent, WTI & WCS Spot Price (USD/bbl)
90 9
78.32 78.21 77.58 8
80
Brent
Bertam, 70.55 7
76.20
70
WTI 6
60
5
CAD/Mcf
USD/bbl
France, 66.08 50.30
48.68
4
2.35 (average realized price for 9 months)
50
Suffield, 40.13
3
40
2
30
1
WCS
NCF00101 p16 10.18
20 0
Jan Feb Mar Apr May Jun Jul Aug Sep Oct Jan Feb Mar Apr May Jun Jul Aug Sep Oct
2018 2018
Source: Bloomberg
17First Nine Months 2018
Financial Results – Operating Cash Flow (1)
250 250
220.7
200 200
150 150
Million USD
Million USD
100 100
101.2
67.9
50 50
28.9
0 0
First 9 Months First 9 Months Q3 Q3
2018 2017 2018 2017
(1)
Non-IFRS Measure, see MD&A
18First Nine Months 2018
Financial Results – EBITDA (1)
250 250
200 200
206.0
150 150
Million USD
Million USD
100 100
95.9
66.2
50 50
26.4
0 0
First 9 Months First 9 Months Q3 Q3
2018 2017 2018 2017
(1)
Non-IFRS Measure, see MD&A
19First Nine Months 2018
Operating Costs (1)
USD/boe USD/boe
operating costs
20 20
Increased activity
16 16
Guidance
12 12 12.6 USD/boe
(unchanged from CMD)
8 8
4 4
0 0
Q1 2018 Q2 2018 Q3 2018 Q4 2018
Actual Actual Actual Forecast
(1)
Non-IFRS Measure, see MD&A
20First Nine Months 2018
Netback (1) (USD/boe)
Third Quarter First Nine Months
2018 2018
Average Dated Brent oil price (75.2 USD/bbl) (72.1 USD/bbl)
Revenue 33.0 36.5
Cost of operations -10.2 -10.1
Tariff and transportation -1.1 -1.3
Production taxes -0.7 -0.7
Operating costs (2) -12.0 -12.1
Cost of blending -1.8 -2.1
Inventory movements 2.1 0.7
Revenue – production costs 21.3 23.0
Cash taxes -0.3 0.5
Operating cash flow (2) 21.0 23.5
General and administration costs (3) -0.8 -1.0
EBITDA (2) 20.5 22.0
(1)
Based on production volumes (2)
Non-IFRS Measure, see MD&A (3)
Adjusted for depreciation
21First Nine Months 2018
Net Debt (1)
Exploration & evaluation
MUSD -2.2 Financial
200 MUSD -18.1 200
180 180
160 160
140 Development 140
120 MUSD -20.4 G&A 120
MUSD -9.5
100 100
80 80
60 Suffield acquisition 60
40 MUSD -341.1 40
20 20
0 0
-20 -20
Opening Cash
1 Jan 2018 -40 -40
MUSD -26.3 -60 Operating Cash Flow (1) -60
-80 MUSD 220.7 -80
-100 -100
-120 -120
-140 Working capital -140
-160 MUSD -16.3 -160
-180 -180
-200 -200
-220 -220
Closing Net Debt
30 Sep 2018
-240 -240
MUSD -213.2
-260 -260
-280 -280
-300 -300
(1)
Non-IFRS Measure, see MD&A
22First Nine Months 2018
G&A / Financial Items
Third Quarter First Nine Months
MUSD 2018 2018
G&A 2.7 9.5
G&A – Depreciation 0.1 0.4
G&A Expense 2.8 9.9
Third Quarter First Nine Months
2018 2018
Interest expense 3.4 11.8
Amortisation of loan fees 0.8 2.5
Loan facility commitment fees 0.2 0.6
Unwinding of asset retirement obligation 2.3 7.0
Foreign exchange loss (gain), net (1) -3.4 6.2
Other – -0.6
Net Finance Costs 3.3 27.5
(1)
Mainly non-cash, driven by the revaluation of external and intra-group loans
23First Nine Months 2018
Financial Results
Revenue
MUSD 342.5
34,400 boepd
350 350
Production costs
MUSD 127.0
300 Operating costs (1) 12.1 USD/boe 300
250 Depletion 250
MUSD 94.5
Cash Margin
MUSD 215.5 200 200
Million USD
Million USD
150 G&A 150
MUSD 9.9
Gross profit
Tax
MUSD 8.9 MUSD 120.6
100 Exploration and business development costs 100
MUSD 0.4
Financial Items
50 MUSD 27.5 Net result 50
MUSD 74.3
0 0
(1)
Non-IFRS Measure, see MD&A
24First Nine Months 2018
Balance Sheet
MUSD 30 Sep 2018 31 Dec 2017
Assets
Oil and gas properties 699.9 319.8
Other non-current assets 101.8 135.4
Current assets 117.4 134.5
919.1 589.7
Liabilities
Financial liabilities 216.9 59.3
Provisions 174.5 105.9
Other non-current liabilities 58.8 53.9
Current liabilities 92.5 63.7
Equity 376.4 306.9
919.1 589.7
25International Petroleum Corp.
Q3 2018 Highlights
Q3 average production at 35,200 boepd, high end of Q3 guidance
Production Guidance
Full year average production expected at or above 34,000 boepd
Q3 operating cost of 12.0 USD/boe, year to date 12.1 USD/boe
Operating Costs (1)
Full year guidance retained at 12.6 USD/boe
Capital expenditure guidance maintained at 44 MUSD
Organic Growth
Maturing organic growth opportunities for 2019 execution in all countries
Full year OCF guidance of 161 to 233 MUSD (Brent 50 to 70 USD/bbl)
Q3 OCF of 68 MUSD
Operating Cash Flow (OCF) (1)
First nine months OCF of 221 MUSD; 95% of full year guidance at 70 USD/bbl
Net debt (1) down from 355 to 213 MUSD since Suffield acquisition (5 Jan 2018)
M&A Announced proposed acquisition of BlackPearl Resources – highly value accretive
NCF00101 p17 10.18
1)
Non-IFRS measure, see MD&A
26Reader Advisory
Forward Looking Statements
This presentation contains statements and information which constitute “forward-looking statements” or “forward-looking information” (within the meaning of applicable securities legislation). Such statements and information (together, “forward-looking statements”) relate to future
events, including the Corporation’s future performance, business prospects or opportunities. Actual results may differ materially from those expressed or implied by forward-looking statements. The forward-looking statements contained in this presentation are expressly qualified by this
cautionary statement. Forward-looking statements speak only as of the date of this presentation, unless otherwise indicated. IPC does not intend, and does not assume any obligation, to update these forward-looking statements, except as required by applicable laws.
All statements other than statements of historical fact may be forward-looking statements. Any statements that express or involve discussions with respect to predictions, expectations, beliefs, plans, projections, forecasts, guidance, budgets, objectives, assumptions or future events or
performance (often, but not always, using words or phrases such as “seek”, “anticipate”, “plan”, “continue”, “estimate”, “expect”, “may”, “will”, “project”, “forecast”, “predict”, “potential”, “targeting”, “intend”, “could”, “might”, “should”, “believe”, “budget” and similar expressions)
are not statements of historical fact and may be “forward-looking statements”. Forward-looking statements include, but are not limited to, statements with respect to: our intention to continue to implement our strategies to build long-term shareholder value; our belief that our resource
base will provide feedstock to add to reserves in the future; the ability of our high quality portfolio of assets to provide a solid foundation for organic and inorganic growth; organic growth opportunities in France, including the Villeperdue and the Vert La Gravelle projects and potential
deeper prospectivity with the new 3D area acquired in 2017; results of previous infill drilling and the potential for future infill drilling in Malaysia; the drilling of the Keruing exploration prospect in Malaysia and the development options if drilling is successful; future development potential
of the Suffield operations, including oil drilling and gas optimization; timing and certainty regarding completion of the BlackPearl transaction, including fulfilling the conditions precedent to such completion; the ability of IPC to maintain stable long-term production and take advantage of
growth and development upside opportunities post-completion of the BlackPearl transaction; the ability of IPC to integrate the assets and personnel of BlackPearl; any combined market capitalization, production, financial and net asset values figures in respect of IPC post-completion of
the BlackPearl transaction, including reserves and resources; the process for completing the BlackPearl transaction; the ability IPC and BlackPearl to obtain necessary approvals and otherwise satisfy the conditions to closing the BlackPearl transaction; the absence of material events
which may interfere with the BlackPearl transaction being completed; estimates of reserves; estimates of contingent resources; estimates of prospective resources; the ability to generate free cash flows and use that cash to repay debt and to continue to deleverage; and future drilling
and other exploration and development activities. Statements relating to “reserves”; “contingent resources” and “prospective resources” are also deemed to be forward-looking statements, as they involve the implied assessment, based on certain estimates and assumptions, that the
reserves and resources described exist in the quantities predicted or estimated and that the reserves and resources can be profitably produced in the future. Ultimate recovery of reserves or resources is based on forecasts of future results, estimates of amounts not yet determinable and
assumptions of management.
The forward-looking statements are based on certain key expectations and assumptions made by IPC, including expectations and assumptions concerning: prevailing commodity prices and currency exchange rates; applicable royalty rates and tax laws; interest rates; future well
production rates and reserve and contingent resource volumes; operating costs; the timing of receipt of regulatory approvals; the performance of existing wells; the success obtained in drilling new wells; anticipated timing and results of capital expenditures; the sufficiency of budgeted
capital expenditures in carrying out planned activities; the timing, location and extent of future drilling operations; the successful completion of acquisitions and dispositions; the benefits of acquisitions; the state of the economy and the exploration and production business in the
jurisdictions in which IPC operates and globally; the availability and cost of financing, labour and services; and the ability to market crude oil, natural gas and natural gas liquids successfully.
Although IPC believes that the expectations and assumptions on which such forward-looking statements are based are reasonable, undue reliance should not be placed on the forward-looking statements because IPC can give no assurances that they will prove to be correct. Since
forward-looking statements address future events and conditions, by their very nature they involve inherent risks and uncertainties. Actual results could differ materially from those currently anticipated due to a number of factors and risks. These include, but are not limited to: the risks
associated with the oil and gas industry in general such as operational risks in development, exploration and production; delays or changes in plans with respect to exploration or development projects or capital expenditures; the uncertainty of estimates and projections relating to
reserves, resources, production, revenues, costs and expenses; health, safety and environmental risks; commodity price and exchange rate fluctuations; interest rate fluctuations; marketing and transportation; loss of markets; environmental risks; competition; incorrect assessment of
the value of acquisitions; failure to complete or realize the anticipated benefits of acquisitions or dispositions; the ability to access sufficient capital from internal and external sources; failure to obtain required regulatory and other approvals; and changes in legislation, including but not
limited to tax laws, royalties and environmental regulations. Readers are cautioned that the foregoing list of factors is not exhaustive.
Additional information on these and other factors that could affect IPC, or its operations or financial results, are included in the Corporation’s Annual Information Form (AIF) for the year ended December 31, 2017 (See “Cautionary Statement Regarding Forward-Looking Information”,
“Reserves and Resources Advisory” and “Risk Factors”) and other reports on file with applicable securities regulatory authorities, including previous financial reports, management’s discussion and analysis and material change reports, which may be accessed through the SEDAR
website (www.sedar.com) or IPC’s website (www.international-petroleum.com).
Additional information on these and other factors that could affect BlackPearl, or its operations or financial results, are included in BlackPearl’s Annual Information Form for the year ended December 31, 2017 (See “Cautionary Statement Regarding Forward-Looking Information”,
“Reserves and Resources Advisory” and “Risk Factors”) and other reports on file with applicable securities regulatory authorities, including previous financial reports, management’s discussion and analysis and material change reports, which may be accessed through the SEDAR
website (www.sedar.com) or BlackPearl’s website (www.blackpearlresources.ca).
Non-IFRS Measures
References are made in this presentation to “operating cash flow” (OCF), “Earnings Before Interest, Tax, Depreciation and Amortization” (EBITDA), “operating costs” and “net debt”/”net cash”, which are not generally accepted accounting measures under International Financial
Reporting Standards (IFRS) and do not have any standardized meaning prescribed by IFRS and, therefore, may not be comparable with definitions of OCF, EBITDA, operating costs and net debt/net cash that may be used by other public companies. Non-IFRS measures should not be
considered in isolation or as a substitute for measures prepared in accordance with IFRS.
Management believes that OCF, EBITDA, operating costs and net debt/net cash are useful supplemental measures that may assist shareholders and investors in assessing the cash generated by and the financial performance and position of the Corporation. Management also uses
non-IFRS measures internally in order to facilitate operating performance comparisons from period to period, prepare annual operating budgets and assess the Corporation’s ability to meet its future capital expenditure and working capital requirements. Management believes these
non-IFRS measures are important supplemental measures of operating performance because they highlight trends in the core business that may not otherwise be apparent when relying solely on IFRS financial measures. Management believes such measures allow for assessment of the
Corporation’s operating performance and financial condition on a basis that is more consistent and comparable between reporting periods. The Corporation also believes that securities analysts, investors and other interested parties frequently use non-IFRS measures in the evaluation of
issuers.
The definition and reconciliation of each non-IFRS measure is presented in IPC’s MD&A (See “Non-IFRS Measures” therein).
Disclosure of Oil and Gas Information
This presentation contains references to estimates of 2P reserves and resources attributed to the Corporation’s oil and gas assets. Gross reserves / resources are the total working interest (operating or non-operating) share reserves before the deduction of any royalties and without
including any royalty interests receivable.
Reserve estimates, contingent resource estimates, prospective resource estimates and estimates of future net revenue in respect of IPC’s oil and gas assets in France, Malaysia and the Netherlands are effective as of December 31, 2017 and were prepared by IPC and audited by ERC
Equipoise Ltd. (ERCE), an independent qualified reserves auditor, in accordance with National Instrument 51-101 – Standards of Disclosure for Oil and Gas Activities (NI 51-101) and the Canadian Oil and Gas Evaluation Handbook (the COGE Handbook), and using McDaniel’s January 1, 2018
price forecasts as referred to below.
27Reader Advisory
Reserves estimates, contingent resource estimates and estimates of future net revenue in respect of IPC’s oil and gas assets in Canada are effective as of January 5, 2018, being the completion date for the acquisition of these assets by IPC, and were evaluated by McDaniel & Associates
Consultants Ltd. (McDaniel), an independent qualified reserves evaluator, in accordance with NI 51-101 and the COGE Handbook, and using McDaniel’s January 1, 2018 price forecasts. The volumes are reported and aggregated by IPC in this presentation as being as at December 31, 2017.
The price forecasts used in the reserve audit / evaluation are available on the website of McDaniel (www.mcdan.com), and are contained in the AIF.
Reserves estimates, contingent resource estimates and estimates of future net revenue in respect of BlackPearl’s oil and gas assets were evaluated by Sproule Associates Limited (Sproule) in a report prepared by Sproule dated January 18, 2018 evaluating the oil and gas reserves
attributable to BlackPearl’s properties as at December 31, 2017 and the contingent resource reports prepared by Sproule dated January 17, 2018 for the Blackrod, Onion Lake and Mooney properties as at December 31, 2017.
Reserves life index is based on the 2P Reserves as at December 31, 2017 and estimated average combined production for 2018 based on the mid-point guidance of IPC and BlackPearl, being 45,250 boepd.
“2P reserves” means IPC’s gross proved plus probable reserves. “Proved reserves” are those reserves that can be estimated with a high degree of certainty to be recoverable. It is likely that the actual remaining quantities recovered will exceed the estimated proved reserves. “Probable
reserves” are those additional reserves that are less certain to be recovered than proved reserves. It is equally likely that the actual remaining quantities recovered will be greater or less than the sum of the estimated proved plus probable reserves.
Contingent resources are those quantities of petroleum estimated, as of a given date, to be potentially recoverable from known accumulations using established technology or technology under development, but which are not currently considered to be commercially recoverable due
to one or more contingencies. Contingencies are conditions that must be satisfied for a portion of contingent resources to be classified as reserves that are: (a) specific to the project being evaluated; and (b) expected to be resolved within a reasonable timeframe. Contingencies may
include factors such as economic, legal, environmental, political, and regulatory matters, or a lack of markets. It is also appropriate to classify as contingent resources the estimated discovered recoverable quantities associated with a project in the early evaluation stage. Contingent
resources are further classified in accordance with the level of certainty associated with the estimates and may be sub-classified based on a project maturity and/or characterized by their economic status.
There are three classifications of contingent resources: low estimate, best estimate and high estimate. Best estimate is a classification of estimated resources described in the COGE Handbook as being considered to be the best estimate of the quantity that will be actually recovered. It is
equally likely that the actual remaining quantities recovered will be greater or less than the best estimate. If probabilistic methods are used, there should be at least a 50% probability that the quantities actually recovered will equal or exceed the best estimate.
Contingent resources are further classified based on project maturity. The project maturity subclasses include development pending, development on hold, development unclarified and development not viable. All of the Corporation’s contingent resources are classified as development
unclarified. Development unclarified is defined as a contingent resource that requires further appraisal to clarify the potential for development and has been assigned a lower chance of development until contingencies can be clearly defined. Chance of development is the probability of a
project being commercially viable. Of the Corporation’s 63.4 MMboe best estimate contingent resources (unrisked), 17.4 MMboe are light and medium crude oil, 7.4 MMboe are heavy crude oil and 38.6 MMboe are conventional natural gas.
References to “unrisked” contingent resources volumes means that the reported volumes of contingent resources have not been risked (or adjusted) based on the chance of commerciality of such resources. In accordance with the COGE Handbook for contingent resources, the chance
of commerciality is solely based on the chance of development based on all contingencies required for the re-classification of the contingent resources as reserves being resolved. Therefore unrisked reported volumes of contingent resources do not reflect the risking (or adjustment) of
such volumes based on the chance of development of such resources.
The contingent resources reported in this presentation are estimates only. The estimates are based upon a number of factors and assumptions each of which contains estimation error which could result in future revisions of the estimates as more technical and commercial information
becomes available. The estimation factors include, but are not limited to, the mapped extent of the oil and gas accumulations, geologic characteristics of the reservoirs, and dynamic reservoir performance. There are numerous risks and uncertainties associated with recovery of such
resources, including many factors beyond the Corporation’s control. There is uncertainty that it will be commercially viable to produce any portion of the contingent resources referred to in this presentation.
2P reserves and contingent resources audited by ERCE and evaluated by McDaniel have been aggregated in this presentation by IPC. Estimates of reserves, resources and future net revenue for individual properties may not reflect the same level of confidence as estimates of reserves,
resources and future net revenue for all properties, due to aggregation. This presentation contains estimates of the net present value of the future net revenue from IPC’s reserves. The estimated values of future net revenue disclosed in this presentation do not represent fair market value.
There is no assurance that the forecast prices and cost assumptions used in the reserve evaluations will be attained and variances could be material.
References to “contingent resources” do not constitute, and should be distinguished from, references to “reserves”. References to “prospective resources” do not constitute, and should be distinguished from, references to “contingent resources” and “reserves”.
This presentation includes oil and gas metrics including “cash margin netback”, “operating cash flow netback”, “cash taxes”, “EBITDA netback” and “profit netback”. Such metrics do not have a standardized meaning under IFRS or otherwise, and as such may not be reliable. This
information should not be used to make comparisons.
“Cash margin netback” is calculated on a per boe basis as oil and gas sales, less operating, tariff/transportation and production tax expenses. Netback is a common metric used in the oil and gas industry and is used by management to measure operating results on a per boe basis to
better analyze performance against prior periods on a comparable basis.
“Operating cash flow netback” is calculated as cash margin netback less cash taxes. Operating cash flow netback is used to measure operating results on a per boe basis of cash flow.
“Cash taxes” is calculated as taxes payable in cash, and not only for accounting purposes. Cash taxes is used to measure cash flow.
“EBITDA netback” is calculated as cash margin netback less general and administration expenses. EBITDA netback is used by management to measure operating results on a per boe basis.
“Profit netback” is calculated as cash margin netback less depletion/depreciation, general and administration expenses and financial items. Profit netback is used by management to measure operating results on a per boe basis.
BOEs may be misleading, particularly if used in isolation. A BOE conversion ratio of 6 thousand cubic feet (Mcf) per 1 barrel (bbl) is based on an energy equivalency conversion method primarily applicable at the burner tip and does not represent a value equivalency at the wellhead. As
the value ratio between natural gas and crude oil based on the current prices of natural gas and crude oil is significantly different from the energy equivalency of 6:1, utilizing a 6:1 conversion basis may be misleading as an indication of value.
Currency
All dollar amounts in this presentation are expressed in United States dollars, except where otherwise noted. References herein to USD mean United States dollars. References herein to CAD mean Canadian dollars.
2829
You can also read