Q12019 Operations and Financial Update First Quarter 2019 - Mike Nicholson, CEO Christophe Nerguararian, CFO May 8, 2019
←
→
Page content transcription
If your browser does not render page correctly, please read the page content below

Operations and Financial Update
                                                      Q1
                                                       2019

                    First Quarter 2019
                    Mike Nicholson, CEO
                    Christophe Nerguararian, CFO
                    May 8, 2019
NC00133 p01 04.19
International Petroleum Corp.
                    Corporate Strategy

                      Deliver operational excellence

                      Maintain financial resilience

                      Maximize the value of our resource base

                      Grow through M&A
NC00133 p09 04.19

                                                                2
International Petroleum Corp.
                    Q1 2019 Highlights
                                                              Q1 production at 44,400 boepd
                      Production Guidance                     2019 guidance: 46,000 to 50,000 boepd retained
                                                              2019 forecast exit rate >50,000 boepd
                                                              Production growth targeted in all countries

                      Operating Costs(1)                      Operating costs of 13.2 USD/boe; in line with guidance

                                                              Capital expenditure increase from 166 to 188 MUSD
                      Organic Growth                          Suffield N2N EOR project execution
                                                              Additional conventional drilling in Canada – Five wells on acquired BlackPearl properties
                                                              Strong cash flow generation
                      Operating Cash Flow(1)                  Full year 2019 OCF forecast of 163 to 330 MUSD
                                                              Q1 OCF of 83 MUSD, 25% of high end guidance at 70 USD/bbl Brent (Brent avg 63 USD/bbl)

                      Liquidity                               Increased capital programme fully funded from cash flow

                      Resource Base(2)                        >2x increase to 288 MMboe; >1.1 billion boe 2P+2C; 16 yr RLI

                      Shareholder Value(2)                    37 % increase in NAV per share to 12.40 USD, IPC trading at 58% discount

                                                              Acquisition of 243 MMboe of additional contingent resource at Blackrod(2) at very low cost
                      Business Development
                                                              Opportunistic approach to further acquisitions

                      HSE                                     No material incidents
NC00133 p02 04.19

                            1)
                                 Non-IFRS measure, see MD&A      2)
                                                                      As at December 31, 2018, see Reader Advisory and MD&A

                                                                                                                                                           3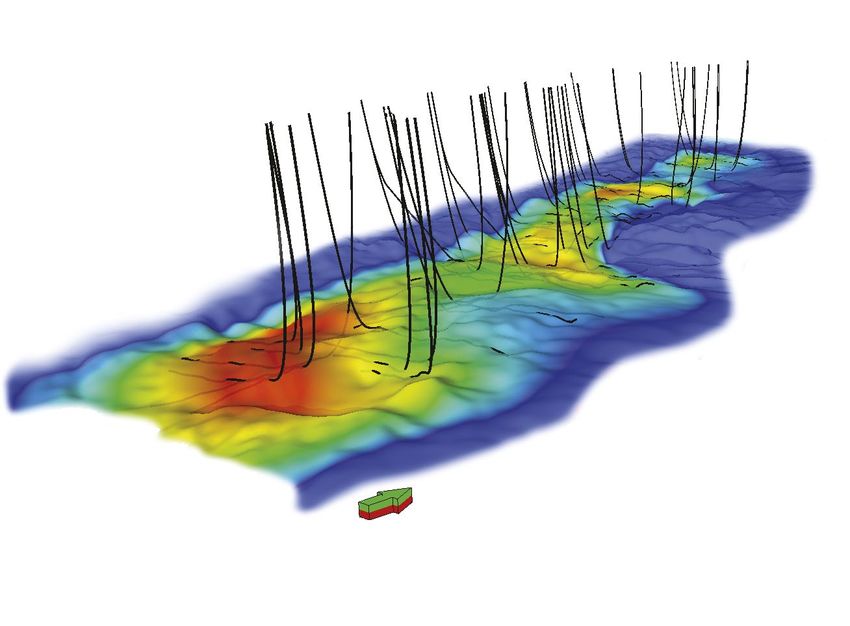
International Petroleum Corp. Canada Gas Production
CMD High
2019 Production – Q1 Performance
Average temperature Suffield gas CMD Low
20,000 10
18,000 5
16,000 0
14,000 -5
12,000 -10
boepd
Temperature
10,000 -15
Q1 production ~1,000 boepd (2%) below 8,000 -20
mid point guidance 6,000 -25
4,000 -30
Gas production impacted by freeze offs caused 2,000 -35
by abnormally low temperatures (-9%) 0 -40
January February March April
2019
Achieved price in Q1 offsets production loss (+31%)
Realised Price CAD/Mcf
Actual –> 3.86 CAD/Mcf Suffield Gas Pricing Empress / AECO differential
AECO Day Ahead Index
CMD –> 2.96 CAD/Mcf 9
8
7
6
Q1 achieved price
5 3.86 (Suffield)
CAD/Mcf
4
3
2
NC00133 p03 04.19
1
0
January February March
2019
4International Petroleum Corp. 2019 Production
2019 Production Guidance International, 19%
France
sia
Canada Gas, 38%
y
ala
Production guidance for 2019 retained: 46,000 to 50,000 boepd net
M
Suffield
a
Gas Canad r
Othe
Production growth targeted in all countries
Suffield gas optimisation and oil drilling
Onion Lake
Onion Lake ramp up Thermal
Malaysia infill wells Suffield
Oil
France Vert-La-Gravelle project Canada Oil, 43%
2019 forecast exit
rate > 50,000 boepd
Production (boepd) 46-50,000
50,000
44,400
40,000
34,400
30,000
20,000
>3x ~5x
10,300
10,000
Gas
NC00133 p04 04.19
Oil WCS
Oil Brent 0
Q1 Q2 Q3 Q4
2017 2018 2019
2019 Forecast
5International Petroleum Corp.
2019 Revised Capital Budget
Capital programme increased from high end guidance of 166 MUSD to 188 MUSD
Fully funded from 2019 cash flow
Canada – Suffield Malaysia
Approved Oil drilling and gas optimisation Approved 3 infill wells
- On track/ahead of expectation Keruing exploration and infill pilot wells
Added N2N EOR project sanction - On track for Q2 spud
Canada – Onion Lake / Other France
Approved Onion Lake production optimisation Approved Execution of Vert-La-Gravelle Phase 1
- On track, slightly slower ramp up due to cold weather - On track for Q2 spud
Blackrod pilot (1 well pair)
- On track for May spud
Added Play openers: Acquired BlackPearl conventional land
- 5 wells; opens up to 130 drilling locations
NC00133 p05 04.19
Blackrod land acquisition
- 243 MMboe CR
6Athabasca
IPC – Canada Peace River
Blackrod
Cold Lake
Suffield N2N EOR Project
Mooney
Edmonton Onion Lake
N2N Facilities Calg
ary Calgary Canada Suffield
Canada
Regina
Medecine Hat
N2N enhanced oil recovery project sanctioned
High value project given 22 MCAD Cenovus pre funding
Facility CAPEX and 9 wells already completed (Cenovus)
Additional 8 wells, 3 conversions and facility commissioning required
Expected peak production adds of 1,250 bopd in 2-3 years
(18% increase on current Suffield oil production)
Strong economic returns, even at low prices N2N 3D view
Breakeven
WCS @ ~26 USD/bbl
NC00133 p06 04.19
7Blackrod
Athabasca
IPC – Canada Peace River
Cold Lake
Blackrod Project - Acquired Strategic Lands
Mooney
Edmonton Onion Lake
Calg
ary Calgary Canada Regina
Medecine Hat
Suffield
Blackrod Project
Acquired 243 MMboe resource at very low cost T78
Among the best quality reservoir + thickest pay in Blackrod
River
Athabasc a Acquired lands
Project economics improve with well pair 3 success Phase 2&3 development
Longer wells with smart completion can reduce pre-production capex T77
Produced water recycle skid further reduces cost base (Onion Lake) B
Low cost opportunity to lock in further upside X-Section
Acquired lands Phase 1 development
X-Section
A B T76
Blackrod
A IPC Lands
NC00133 p07 04.19
T75
R19 R18 R17W4
8International Petroleum Corp.
Operating Cash Flow (MUSD)(1)
Low Case High Case
WTI-WCS WTI-WCS
differential differential
-20 -15
332
70 USD/bbl
306
70 USD/bbl
279(2)
265 258
60 USD/bbl
232
60 USD/bbl
189
50 USD/bbl
163
50 USD/bbl
138
36% 25% Q1
83 MUSD
NC00133 p08 04.19
2017 2018 2019 Guidance(3)
Actual Actual
1)
Non-IFRS measure, See MD&A 2)
Including OCF related to Netherlands assets disposed in December 2018 3)
At mid-point of 2019 production guidance
9International Petroleum Corp.
Net Asset Value (MUSD)(1)
2,314 With YE 2017 Pricing
111 PXX
166 IPCO 2,037
1,274 BlackPearl ~58% discount to NAV
847
526 Suffield
1,151
543 514 International
2017 2018 2019 Net Debt (2) NAV (1) IPCO
Market Cap (3)
NC00115 p09 01.19
1) As at December 31, 2018, see Reader Advisory and MD&A
2) Non-IFRS measure, see MD&A 3) Based on the price of IPC shares as at April 26 th, 2019, converted to USD (SEK 49.10 ; SEK/USD 9.49)
10International Petroleum Corp.
Net Asset Value Per Share(1)
14 14
NAV per share IPCO USD share price
01/01/19
13 13
USD per share
USD 12.4
12 12
11
+37% 11
10 01/01/18 10
USD per share
USD 9.1
9 Additional gas 9 ~58%
optimisation in Commenced discount
Suffield
+89%
8 Canada approved 8 to NAV
oil drilling
7 BlackPearl 7
acquisition
6 Infill drilling completed 6
Suffield acquisition
Malaysia infills and starts in Malaysia
01/01/17 announced
France 3D seismic
5 USD 4.8 5
~26% announced
discount 4 4
to NAV BlackPearl
3 acquisition 3
Listing Suffield acquisition Malaysian
17.5 MMboe CR announcement
completed Infill wells
2 announced online Production 2
France 3D seismic curtailment
1 25.5 M shares purchased completed 1
announced
and cancelled at
3.53 USD/share
0 0
NC00115 p10 04.19
Apr May Jun Jul Aug Sep Oct Nov Dec Jan Feb Mar Apr May Jun Jul Aug Sep Oct Nov Dec Jan Feb Mar Apr May
2017 2018 2019
1)
As at December 31, 2018, see Reader Advisory and MD&A
11First Quarter 2019
Financial Highlights
12First Quarter 2019
Financial Highlights
First Quarter
2019
Production (boepd) 44,400
Average Dated Brent Oil Price (USD/boe) 63.1
Operating costs (USD/boe) (1) 13.2
Operating cash flow (MUSD) (1) 83.1
EBITDA (MUSD) (1) 81.7
Net result (MUSD) 33.1
(¹)
Non-IFRS Measure, see MD&A
13First Quarter 2019
Realised Oil Prices
100
90
78.32 78.21 77.58
73.10
80 70.55
66.29
70 Malaysia, 67.72
76.20 France, 64.50
60 50.30
48.68
USD/bbl
66.08
50
40.13
Suffield, 45.85
40
Onion Lake, 37.20
30 21.30
20
10
0
Jan Feb Mar Apr May Jun Jul Aug Sep Oct Nov Dec Jan Feb Mar Apr
2018 2019
NC00131 p04 04.19
Brent WTI WTI - 10 days differential (month -1)
14First Quarter 2019
Realised Gas Prices
Realised Price CAD/Mcf
Empress / AECO differential
AECO Day Ahead Index
9
8
7
6 3.07
5
CAD/Mcf
3.86
4
2.29
2.70 2.11
3
2
1
0
NC00131 p05 04.19
Jan Feb Mar Apr May Jun Jul Aug Sep Oct Nov Dec Jan Feb Mar Apr
2018 2019
15First Quarter 2019
Financial Results – Operating Cash Flow (1)
Operating Cash Flow (1) EBITDA(1)
100 100
80 83.1 80
81.7
76.1
65.3
60 60
Million USD
Million USD
40 40
20 20
0 0
Q1 Q1 Q1 Q1
NC00131 p13 04.19
2019 2018 2019 2018
(1)
Non-IFRS Measure, see MD&A
16First Quarter 2019
Operating Costs (1)
USD/boe USD/boe
operating costs
20 20
16 16
2019 Operating Costs:
12.9 USD/boe guidance unchanged
12 12
8 8
4 4
0 0
Q1 2019 Q2 2019 Q3 2019 Q4 2019
Actual Forecast Forecast Forecast
NC00131 p17 04.19
(1)
Non-IFRS Measure, see MD&A
17First Quarter 2019
Netback (1) (USD/boe)
First Quarter
2019
Average Dated Brent oil price (63.1 USD/bbl)
Revenue 36.9
Cost of operations -11.3
Tariff and transportation -1.5
Production taxes -0.4
Operating costs (2) -13.2
Cost of blending -1.4
Inventory movements -1.1
Revenue – production costs 21.2
Cash taxes -0.4
Operating cash flow (2) 20.8
General and administration costs (3) -0.7
EBITDA (2) 20.5
(1)
Based on production volumes (2)
Non-IFRS Measure, see MD&A (3)
Adjusted for depreciation
18First Quarter 2019
Cash Flows and Closing Net Debt(1) (MUSD)
-180 -180
Exploration & evaluation
-200 MUSD -2.6 Financial -200
MUSD -4.7
-220 -220
Development
Million USD
MUSD -19.3 G&A
-240
MUSD -3.0 -240
-260 -260
Closing Net Debt
Opening Net Working capital & other 31 Mar 2019
Debt MUSD -33.7 MUSD -257.0
1 Jan 2019 -280 -280
MUSD -276.8
Operating Cash Flow
MUSD 83.1
-300 -300
-320 -320
NC00130 AC p01 04.19
(1)
Non-IFRS Measure, see MD&A
19First Quarter 2019
G&A / Financial Items
MUSD First Quarter 2019
G&A 3.0
G&A – Depreciation 0.3
G&A Expense 3.3
First Quarter 2019
Interest expense 4.3
Loan facility commitment fees 0.3
Amortisation of loan fees 0.6
Foreign exchange loss (gain), net (1) -3.9
Unwinding of asset retirement obligation 2.7
Other 0.1
Net Finance Costs 4.1
(1)
Mainly non-cash, driven by the revaluation of external and intra-group loans
20First Quarter 2019
Financial Results
Revenue
MUSD 147.4
44,400 boepd
150 150
135 135
Production costs
MUSD 62.8
Operating costs (1) 13.2 USD/boe
120 120
105 105
Depletion
90 MUSD 37.6 90
Cash Margin
Million USD
MUSD 84.6
Million USD
75 75
60 G&A 60
MUSD 3.3
Tax
MUSD 6.4
45 45 Gross profit
Exploration and business development costs MUSD 46.9
MUSD 0.1
30 Financial items 30
MUSD 4.1
Net result
MUSD 33.1
15 15
NC00131 p15 04.19
0 0
(1)
Non-IFRS Measure, see MD&A
21First Quarter 2019
Balance Sheet
MUSD 31 Mar 2019 31 Dec 2018
Assets
Oil and gas properties 1,034.2 1,014.8
Other non-current assets 160.3 169.4
Current assets 110.4 98.9
1,304.9 1,283.1
Liabilities
Financial liabilities 262.8 283.7
Provisions 156.5 151.5
Other non-current liabilities 57.8 55.8
Current liabilities 97.3 96.3
Equities 730.5 695.8
1,304.9 1,283.1
22First Quarter 2019
Liquidity and Hedging
Credit Facilities
One International (200 MUSD) and two Canadian (200 and 120 MCAD) revolving credit facilities
IPC intends to amalgamate the two Canadian credit facilities into a single one for greater flexibility in Q2
Second lien notes (75 MCAD)
In excess of 150 MUSD availability under revolving credit lines
Hedging
20 to 50% of former BlackPearl production volumes
Maturity up to end June 2020
Mostly using collars
NC00131 p18 04.19
23International Petroleum Corp.
Q1 2019 Highlights
Q1 production at 44,400 boepd
Production Guidance 2019 guidance: 46,000 to 50,000 boepd retained
2019 forecast exit rate >50,000 boepd
Production growth targeted in all countries
Operating Costs(1) Operating costs of 13.2 USD/boe; in line with guidance
Capital expenditure increase from 166 to 188 MUSD
Organic Growth Suffield N2N EOR project execution
Additional conventional drilling in Canada – Five wells on acquired BlackPearl properties
Strong cash flow generation
Operating Cash Flow(1) Full year 2019 OCF forecast of 163 to 330 MUSD
Q1 OCF of 83 MUSD, 25% of high end guidance at 70 USD/bbl Brent (Brent avg 63 USD/bbl)
Liquidity Increased capital programme fully funded from cash flow
Resource Base(2) >2x increase to 288 MMboe; >1.1 billion boe 2P+2C; 16 yr RLI
Shareholder Value(2) 37 % increase in NAV per share to 12.40 USD, IPC trading at 58% discount
Acquisition of 243 MMboe of additional contingent resource at Blackrod(2) at very low cost
Business Development
Opportunistic approach to further acquisitions
HSE No material incidents
NC00133 p02 04.19
1)
Non-IFRS measure, see MD&A 2)
As at December 31, 2018, see Reader Advisory and MD&A
24Reader Advisory
Forward Looking Statements
This presentation contains statements and information which constitute “forward-looking statements” or “forward-looking information” (within the meaning of applicable securities legislation). Such statements and information (together, “forward-looking statements”) relate to future
events, including the Corporation’s future performance, business prospects or opportunities. Actual results may differ materially from those expressed or implied by forward-looking statements. The forward-looking statements contained in this presentation are expressly qualified by this
cautionary statement. Forward-looking statements speak only as of the date of this presentation, unless otherwise indicated. IPC does not intend, and does not assume any obligation, to update these forward-looking statements, except as required by applicable laws.
All statements other than statements of historical fact may be forward-looking statements. Any statements that express or involve discussions with respect to predictions, expectations, beliefs, plans, projections, forecasts, guidance, budgets, objectives, assumptions or future events or
performance (often, but not always, using words or phrases such as “seek”, “anticipate”, “plan”, “continue”, “estimate”, “expect”, “may”, “will”, “project”, “forecast”, “predict”, “potential”, “targeting”, “intend”, “could”, “might”, “should”, “believe”, “budget” and similar expressions)
are not statements of historical fact and may be “forward-looking statements”. Forward-looking statements include, but are not limited to, statements with respect to: : IPC’s intention and ability to continue to implement strategies to build long-term shareholder value; IPC’s intention
to review future potential growth opportunities; the ability of IPC’s portfolio of assets to provide a solid foundation for organic and inorganic growth; the continued facility uptime and reservoir performance in IPC’s areas of operation; the proposed Vert La Gravelle development project,
including drilling, and other organic growth opportunities in France, including the Villeperdue West project; the status of the suspension of operations at the Grandpuits refinery, and the related effects on production and sales, in France; the proposed third phase of infill drilling in Malaysia
and the ability to mature additional locations, and the production uplift from such drilling; the drilling of the Keruing prospect in Malaysia and the development options if drilling is successful; future development potential of the Suffield area operations, including continued and future oil
drilling and gas optimization programs and the N2N EOR development project; the proposed further conventional oil drilling in Canada, including the ability of such drilling to identify further drilling or development opportunities; future development of the Blackrod project, including the land
position acquired in May 2019, in Canada; the results of the facility optimization program and the work to debottleneck the facilities and injection capability, as well as water intake issues, at Onion Lake Thermal; the ability to integrate the assets and operations acquired in the BlackPearl
acquisition, including the ability to accelerate value creation and extend IPC’s reserves life following such acquisition; 2019 production range, exit rate, operating costs and capital expenditure estimates; potential further acquisition opportunities; estimates of reserves; estimates of
contingent resources; estimates of prospective resources; the ability to generate free cash flows and use that cash to repay debt and to continue to deleverage; and future drilling and other exploration and development activities.
Statements relating to “reserves”; “contingent resources” and “prospective resources” are also deemed to be forward-looking statements, as they involve the implied assessment, based on certain estimates and assumptions, that the reserves and resources described exist in the
quantities predicted or estimated and that the reserves and resources can be profitably produced in the future. Ultimate recovery of reserves or resources is based on forecasts of future results, estimates of amounts not yet determinable and assumptions of management.
The forward-looking statements are based on certain key expectations and assumptions made by IPC, including expectations and assumptions concerning: prevailing commodity prices and currency exchange rates; applicable royalty rates and tax laws; interest rates; future well
production rates and reserve and contingent resource volumes; operating costs; the timing of receipt of regulatory approvals; the performance of existing wells; the success obtained in drilling new wells; anticipated timing and results of capital expenditures; the sufficiency of budgeted
capital expenditures in carrying out planned activities; the timing, location and extent of future drilling operations; the successful completion of acquisitions and dispositions; the benefits of acquisitions; the state of the economy and the exploration and production business in the
jurisdictions in which IPC operates and globally; the availability and cost of financing, labour and services; and the ability to market crude oil, natural gas and natural gas liquids successfully.
Although IPC believes that the expectations and assumptions on which such forward-looking statements are based are reasonable, undue reliance should not be placed on the forward-looking statements because IPC can give no assurances that they will prove to be correct. Since
forward-looking statements address future events and conditions, by their very nature they involve inherent risks and uncertainties. Actual results could differ materially from those currently anticipated due to a number of factors and risks. These include, but are not limited to: the risks
associated with the oil and gas industry in general such as operational risks in development, exploration and production; delays or changes in plans with respect to exploration or development projects or capital expenditures; the uncertainty of estimates and projections relating to
reserves, resources, production, revenues, costs and expenses; health, safety and environmental risks; commodity price and exchange rate fluctuations; interest rate fluctuations; marketing and transportation; loss of markets; environmental risks; competition; incorrect assessment of
the value of acquisitions; failure to complete or realize the anticipated benefits of acquisitions or dispositions; the ability to access sufficient capital from internal and external sources; failure to obtain required regulatory and other approvals; and changes in legislation, including but not
limited to tax laws, royalties and environmental regulations. Readers are cautioned that the foregoing list of factors is not exhaustive.
Additional information on these and other factors that could affect IPC, or its operations or financial results, are included in the management discussion and analysis for the three months ended March 31, 2019 (MD&A) (See “Cautionary Statement Regarding Forward-Looking Information”
therein), the Corporation’s Annual Information Form (AIF) for the year ended December 31, 2018 (See “Cautionary Statement Regarding Forward-Looking Information”, “Reserves and Resources Advisory” and “ Risk Factors” therein) and other reports on file with applicable securities
regulatory authorities, which may be accessed through the SEDAR website (www.sedar.com) or IPC’s website (www.international-petroleum.com).
Non-IFRS Measures
References are made in this press release to “operating cash flow” (OCF), “Earnings Before Interest, Tax, Depreciation and Amortization” (EBITDA), “operating costs” and “net debt”/”net cash”, which are not generally accepted accounting measures under International Financial
Reporting Standards (IFRS) and do not have any standardized meaning prescribed by IFRS and, therefore, may not be comparable with definitions of OCF, EBITDA, operating costs and net debt/net cash that may be used by other public companies. Non-IFRS measures should not be
considered in isolation or as a substitute for measures prepared in accordance with IFRS.
Management believes that OCF, EBITDA, operating costs and net debt/net cash are useful supplemental measures that may assist shareholders and investors in assessing the cash generated by and the financial performance and position of the Corporation. Management also uses
non-IFRS measures internally in order to facilitate operating performance comparisons from period to period, prepare annual operating budgets and assess the Corporation’s ability to meet its future capital expenditure and working capital requirements. Management believes these
non-IFRS measures are important supplemental measures of operating performance because they highlight trends in the core business that may not otherwise be apparent when relying solely on IFRS financial measures. Management believes such measures allow for assessment of the
Corporation’s operating performance and financial condition on a basis that is more consistent and comparable between reporting periods. The Corporation also believes that securities analysts, investors and other interested parties frequently use non-IFRS measures in the evaluation of
issuers.
The definition and reconciliation of each non-IFRS measure is presented in IPC’s MD&A (See “Non-IFRS Measures” therein).
Disclosure of Oil and Gas Information
This presentation contains references to estimates of 2P reserves and resources attributed to the Corporation’s oil and gas assets. Gross reserves / resources are the total working interest (operating or non-operating) share reserves before the deduction of any royalties and without
including any royalty interests receivable.
Reserves estimates, contingent resource estimates and estimates of future net revenue in respect of IPC’s oil and gas assets in the Suffield area of Canada are effective as of December 31, 2018, and are included in the report prepared by McDaniel & Associates Consultants Ltd.
(McDaniel), an independent qualified reserves evaluator, in accordance with National Instrument 51-101 – Standards of Disclosure for Oil and Gas Activities (NI 51-101) and the Canadian Oil and Gas Evaluation Handbook (the COGE Handbook), and using McDaniel’s January 1, 2019 price
forecasts.
Reserves estimates, contingent resource estimates and estimates of future net revenue in respect of IPC’s oil and gas assets in the Onion Lake, Blackrod and Mooney areas of Canada are effective as of December 31, 2018, and are included in the report prepared by Sproule Associates
Limited (Sproule), an independent qualified reserves evaluator, in accordance with NI 51-101 and the COGE Handbook, and using McDaniel’s January 1, 2019 price forecasts.
Reserve estimates, contingent resource estimates, prospective resource estimates and estimates of future net revenue in respect of IPC’s oil and gas assets in France and Malaysia are effective as of December 31, 2018, and are included in the report prepared by ERC Equipoise Ltd.
(ERCE), an independent qualified reserves auditor, in accordance with NI 51-101 and the COGE Handbook, and using McDaniel’s January 1, 2019 price forecasts.
25Reader Advisory
The contingent resource estimates in respect of the oil and gas assets acquired in May 2019 in the Blackrod area of Canada are effective as of December 31, 2018, and have been evaluated by Sproule, in accordance with NI 51-101 and the COGE Handbook. The lands acquired will be part
of the planned SAGD development at Blackrod and have the same classification (Development on Hold) as the other Blackrod lands. The same chance of development risk (77%) has been applied to the acquired lands as was used for Phase 2 and Phase 3 of the Blackrod project. These
lands will be incorporated into the Phase 2 and Phase 3 development plan going forward. Additional details regarding the planned development at Blackrod, including an assessment of the contingencies, timing and economics for the proposed development, are available in the AIF.
The price forecasts used in the reserve reports are available on the website of McDaniel (www.mcdan.com), and are contained in the MCR.
The reserves life index (RLI) is calculated by dividing the 2P reserves of 288 MMboe as at December 31, 2018, by the mid-point of the initial 2019 production guidance of 46,000 to 50,000 boepd. The reserves replacement ratio is based on 2P reserves of 129.1 MMboe as at December 31,
2017 (including the 2P reserves attributable to the acquisition of the Suffield area assets which completed on January 5, 2018), production during 2018 of 12.4 MMboe, additions to 2P reserves during 2018 of 12.7 MMboe, disposals of 2P reserves related to the disposal of the Netherlands
assets of 1.6 MMboe and 2P reserves of 128.0 MMboe as at December 31, 2018 (excluding the 2P reserves attributable to the acquisition of BlackPearl which completed on December 14, 2018).
“2P reserves” means IPC’s gross proved plus probable reserves. “Proved reserves” are those reserves that can be estimated with a high degree of certainty to be recoverable. It is likely that the actual remaining quantities recovered will exceed the estimated proved reserves. “Probable
reserves” are those additional reserves that are less certain to be recovered than proved reserves. It is equally likely that the actual remaining quantities recovered will be greater or less than the sum of the estimated proved plus probable reserves.
Contingent resources are those quantities of petroleum estimated, as of a given date, to be potentially recoverable from known accumulations using established technology or technology under development, but which are not currently considered to be commercially recoverable due
to one or more contingencies. Contingencies are conditions that must be satisfied for a portion of contingent resources to be classified as reserves that are: (a) specific to the project being evaluated; and (b) expected to be resolved within a reasonable timeframe. Contingencies may
include factors such as economic, legal, environmental, political, and regulatory matters, or a lack of markets. It is also appropriate to classify as contingent resources the estimated discovered recoverable quantities associated with a project in the early evaluation stage. Contingent
resources are further classified in accordance with the level of certainty associated with the estimates and may be sub-classified based on a project maturity and/or characterized by their economic status.
There are three classifications of contingent resources: low estimate, best estimate and high estimate. Best estimate is a classification of estimated resources described in the COGE Handbook as being considered to be the best estimate of the quantity that will be actually recovered. It is
equally likely that the actual remaining quantities recovered will be greater or less than the best estimate. If probabilistic methods are used, there should be at least a 50% probability that the quantities actually recovered will equal or exceed the best estimate.
Contingent resources are further classified based on project maturity. The project maturity subclasses include development pending, development on hold, development unclarified and development not viable. All of the Corporation’s contingent resources are classified as either
development on hold or development unclarified. Development on hold is defined as a contingent resource where there is a reasonable chance of development, but there are major non-technical contingencies to be resolved that are usually beyond the control of the operator.
Development unclarified is defined as a contingent resource that requires further appraisal to clarify the potential for development and has been assigned a lower chance of development until contingencies can be clearly defined. Chance of development is the probability of a project
being commercially viable.
References to “unrisked” contingent resources volumes means that the reported volumes of contingent resources have not been risked (or adjusted) based on the chance of commerciality of such resources. In accordance with the COGE Handbook for contingent resources, the chance
of commerciality is solely based on the chance of development based on all contingencies required for the re-classification of the contingent resources as reserves being resolved. Therefore unrisked reported volumes of contingent resources do not reflect the risking (or adjustment) of
such volumes based on the chance of development of such resources.
The contingent resources reported in this presentation are estimates only. The estimates are based upon a number of factors and assumptions each of which contains estimation error which could result in future revisions of the estimates as more technical and commercial information
becomes available. The estimation factors include, but are not limited to, the mapped extent of the oil and gas accumulations, geologic characteristics of the reservoirs, and dynamic reservoir performance. There are numerous risks and uncertainties associated with recovery of such
resources, including many factors beyond the Corporation’s control. There is uncertainty that it will be commercially viable to produce any portion of the contingent resources referred to in this presentation.
2P reserves and contingent resources included in the reports of McDaniel, Sproule and ERCE have been aggregated in this presentation by IPC. Estimates of reserves, resources and future net revenue for individual properties may not reflect the same level of confidence as estimates of
reserves, resources and future net revenue for all properties, due to aggregation. This presentation contains estimates of the net present value of the future net revenue from IPC’s reserves. The estimated values of future net revenue disclosed in this presentation do not represent fair
market value. There is no assurance that the forecast prices and cost assumptions used in the reserve evaluations will be attained and variances could be material.
References to “contingent resources” do not constitute, and should be distinguished from, references to “reserves”. References to “prospective resources” do not constitute, and should be distinguished from, references to “contingent resources” and “reserves”.
This presentation includes oil and gas metrics including “cash margin netback”, “taxation netback”, “operating cash flow netback”, “cash taxes”, “EBITDA netback” and “profit netback”. Such metrics do not have a standardized meaning under IFRS or otherwise, and as such may not be
reliable. This information should not be used to make comparisons.
“Cash margin netback” is calculated on a per boe basis as oil and gas sales, less operating, tariff/transportation and production tax expenses. Netback is a common metric used in the oil and gas industry and is used by management to measure operating results on a per boe basis to
better analyze performance against prior periods on a comparable basis.
“Taxation netback” is calculated on a per boe basis as current tax charge/credit less deferred tax charge/credit. Taxation netback is used to measure taxation on a per boe basis.
“Operating cash flow netback” is calculated as cash margin netback less cash taxes. Operating cash flow netback is used to measure operating results on a per boe basis of cash flow.
“Cash taxes” is calculated as taxes payable in cash, and not only for accounting purposes. Cash taxes is used to measure cash flow.
“EBITDA netback” is calculated as cash margin netback less general and administration expenses. EBITDA netback is used by management to measure operating results on a per boe basis.
“Profit netback” is calculated as cash margin netback less depletion/depreciation, general and administration expenses and financial items. Profit netback is used by management to measure operating results on a per boe basis.
BOEs may be misleading, particularly if used in isolation. A BOE conversion ratio of 6 thousand cubic feet (Mcf) per 1 barrel (bbl) is based on an energy equivalency conversion method primarily applicable at the burner tip and does not represent a value equivalency at the wellhead. As
the value ratio between natural gas and crude oil based on the current prices of natural gas and crude oil is significantly different from the energy equivalency of 6:1, utilizing a 6:1 conversion basis may be misleading as an indication of value.
Currency
All dollar amounts in this presentation are expressed in United States dollars, except where otherwise noted. References herein to USD mean United States dollars. References herein to CAD mean Canadian dollars.
2627
You can also read