Investor Presentation May 2018 - Finance Flanders
←
→
Page content transcription
If your browser does not render page correctly, please read the page content below
Investor Presentation
May 2018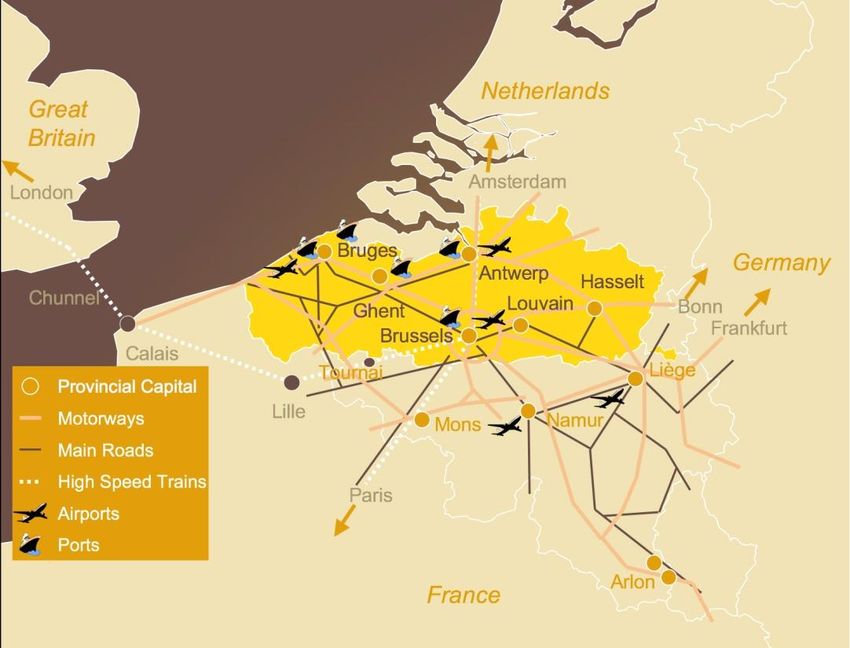
2

I.    Main Facts & Figures

II.   Key Strengths

III. Public Finances

IV. Consolidated Debt

V.    Flanders in a nutshell
3

Main Facts & Figures
                                                    Key Data

            Capital                      Brussels
            Language                     Dutch
            Surface                      13 684 km²
            Population                   6 509 894 (1/1/2017)
            Density                      485 hab./km² (2016)
            Currency                     Euro
            N° of Companies              509,660 (subject to VAT)
            Nominal GDP (PPS)            EUR 228 bn (2016)
            GDP/Capita (PPS)             EUR 35 100 (2016)
            Real GDP growth rate 1.4% (2016)
            Unemployment rate            4.4%   (2017)

            PPS = purchasing power standards
4

                             Main Facts & Figures
                                                    High GDP per Capita (2016)
40.000

35.000

30.000

25.000

20.000

15.000

10.000

 5.000

    0
          Flanders   EU-28      Belgium   Germany     France   Netherlands   United Kingdom

 Source: Eurostat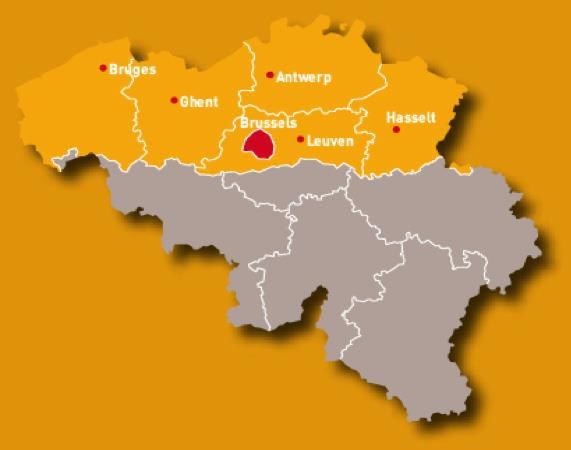
5

                                     Main Facts & Figures
                                                            Strong Economic Fundamentals

Flanders benefits from very strong economic fundamentals.

                                        Flanders        France         Germany        Netherlands   EU - 28

Unemployment Rate (2017)                  4.4%          9.4%           3.8%           4.9%          7.6%

Real GDP Growth Rate (average
2011 – 2016)
                                          1.3%          1.0%           1.6%           1.0%          1.2%

      •    In 2016 the real GDP growth rate was 1.4% in Flanders which was much higher compared to
           the other regions (Walloon Region 1.1% and Brussels Region 0.8%)

Source: Eurostat - Labour Force Survey, Study Office of the Governement of Flanders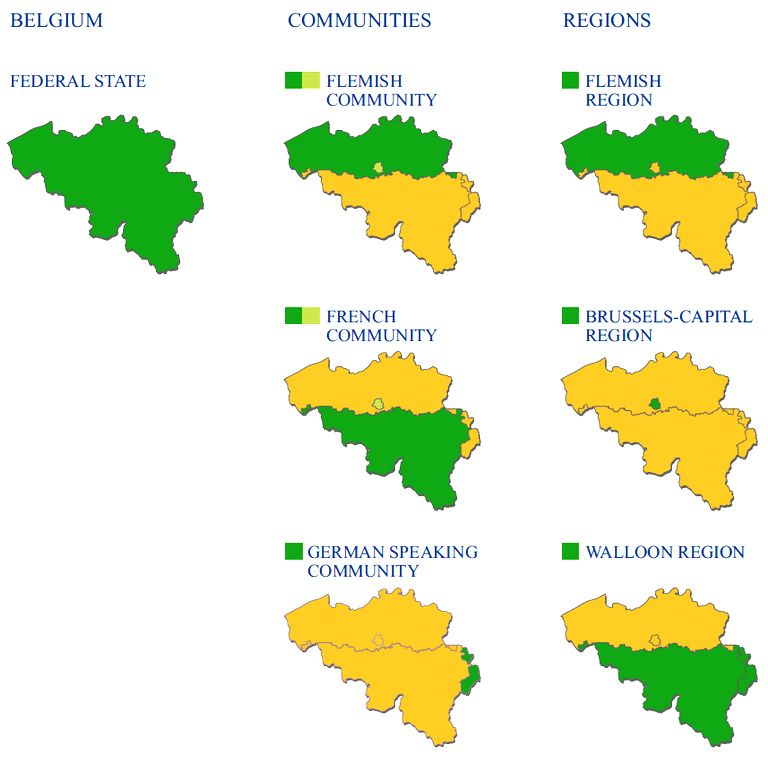
6

I.    Main Facts & Figures

II.   Key Strengths

III. Public Finances

IV. Consolidated Debt

V.    Flanders in a nutshell
7
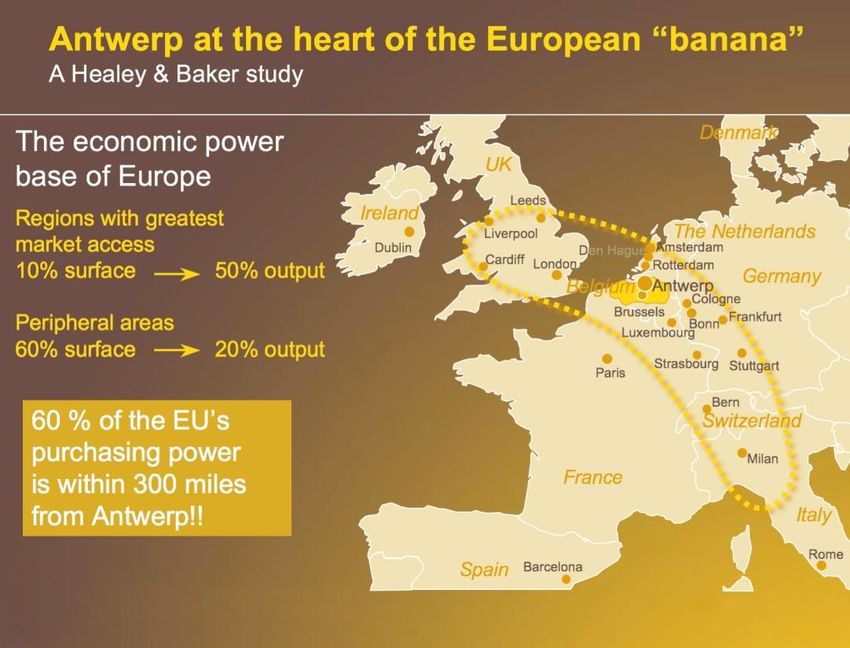
Key Strengths
Located in the Heart of Europe
Flanders lies at the center of the EU’s
wealthiest and most populated area;
Highly developed transport and
communications systems so that
companies can take full advantage of this
fact;
Strong stimulus for companies to locate
in Flanders – central location;
Source: Healey & Baker study8
Key Strengths
A Unique European Hub
Flanders offers companies rapid and efficient supply
and distribution links with other major European
centers and beyond.
Leading ports Antwerp, Ghent, Ostend,
Zeebrugge
Airport freight & logistic Brussels, Ostend
hubs
Extensive inland Linking into the European
waterway system system
High density of freeways Connecting directly to
other European countries
High density rail network Dedicated freight lines to
other parts of Europe
Source: Healey & Baker study9
Key Strengths
An Economy based on Trade and Services (2016)
Flemish GDP-Sector contribution
primary sector; Construction 6.1%
0,9% Chemicals 3.2%
Iron, Metal & Steel 2.1%
Food & Tobacco 2.7%
secondary sector; Other 11.6%
25,8%
tertiary sector;
73,3%
Real Estate and Business Services 23.8%
Wholesale and Retail 13.6%
Transport 6.4%
Health Services 4.6%
Other 24.9%
Source: Institute of National Accounts10
Key Strengths
Strong Export-Driven Economy
Regional Distribution of Belgian exports (%) Flemish Exports
(2017) (EUR billion)
2,6% 350
14,2%
300
250
Brussels 200
Flanders 150
Wallonie
100
50
0
83,2% 2008 2009 2010 2011 2012 2013 2014 2015 2016 2017
The Flemish economy is strongly export oriented: Flanders’ exports represent 83.2% of Belgium’s
total export in volume;
Flemish exports grow steadily over time (+4.99% in 2017);
The region’s most successful export products are chemicals, transport equipment, machines and
equipments, pharmaceuticals and minerals.
Source: Institute for the National Accounts11
Key Strengths
Diversified Base of Trading Partners
Top 10 of Flemish Export Markets in 2017 (as % of total)
18,00%
16,00%
14,00%
12,00%
10,00%
8,00%
6,00%
4,00%
2,00%
0,00%
Germany France Netherlands UK Italy USA Spain India China Poland
The EU28 is the most important Flemish export market and the 3 neighbouring countries (Germany, France
and the Netherlands) are Flanders main trading partners. Also emerging economies like India and China are
steadily becoming more important for Flemish exports.
Source: Institute of National Accounts12
Key Strengths
Foreign Direct Investment Figures & Trade Partnerships
Flanders has a proven track record of welcoming foreign Type of Investments (2017)
businesses to its region.
Mergers&Ac
quisitions:
25,58%
Top 10 biggest investors in 2017 Greenfield:
40,93%
1 USA 21,4%
2 Netherlands 11,6%
3 Germany 10,7% Expansions:
33,49%
4 France 8,4%
Type of Activities (2017)
5 China 6,5%
Sales &
6 Japan 6,1% Marketing:
16,28%
7 Sweden 4,7% Manufaturin
HQ: 1,40%
g: 33,20%
8 United Kingdom 4,2%
R&D: 20,00%
9 Switzerland 3,7%
10 Italy 1,9%
Logistics:
24,65%
Source: Flanders Investment and Trade Office13
Key Strengths
Low Unemployment Rate
25
20
14,9
15 13,5
(%)
12,2
9,7
10 10,8
10,7
8,2
5 4,4
4,4 4,0 3,9
0
Flemish Region Walloon Region Brussels Capitol Region EU 15 countries
Source: Statistics Belgium EAK, Eurostat, Labour Force Survey
Website Steunpunt Werk: http://www.steunpuntwerk.be/
Other graphs on labour market see appendix14
Key Strengths
R&D budget evolution (in million euro)
2500
2000
1500
1000
500
0
Research and Development (R&D) Education and Training (E&T) Scientific and Technological Services (STS)
Source: Department of Economy, Science and Innovation15 I. Main Facts & Figures II. Key Strengths III. Public Finances IV. Consolidated Debt V. Flanders in a nutshell
16

                               Public Finances
                                                        Return to a balanced budget

•   Several budgettary challenges in last years
      • Financial-economical crisis: Deficit in 2009 and 2010, but within 2 years return to
         balanced budget
      • Stricter European budgetary surveillance: considerable negative impact on budget from
         2013, but gradually integrated in budget (completed in 2016)
      • Sixth state reform:
            • Financial autonomy raised to 34% (levy surtax on Personal income tax)
            • more competences and increase in financial means (approx. 9,7 bn EUR for 2015)
            • Recurrent contribution of 1,55 bn EUR to consolidation of public finances of
               federal government and social security
      • Enhancement of federal tax shift (> 300 mln EUR)

•   Budget 2016 : deficit of 468 mln EUR, in realisation deficit reduced to 127 mln EUR
•   Budget 2017: surplus of 2 mln EUR, in realisation surplus of 470 mln EUR

•   Budget 2018: Balanced budget
17
Public Finances
Revenues by Segment
45.000.000
40.000.000
35.000.000
In keuro
30.000.000
25.000.000
20.000.000
15.000.000
10.000.000
5.000.000
0
2014 ACT 2015 ACT 2016 ACT 2017 ACT AB 2018
Institutions within scope of consolidation Lottery funds Own non-tax non-allocated income
Own non-tax allocated income Regional taxes Specific allocations SFA
Regional and Community resources SFA Gross additional personal income tax charge
2014 - the 6th State Reform
• Large increase in revenues
• Major transfer of powers and resources
Comparison budget 2016 / 2017: Increase of 2.7 bn €
reasons?
1. Increase of the regional taxes and grants from the federal level
2. Expansion of the consolidation perimeter
Budget 2018: Revenues at the same level as in the budget 201718
Public Finances
Revenues by Segment
Key revenues 2018:
56% Regional and Community resources from Federal level
33,2% own fiscal instruments:
• 15,4% regional taxes
• 17,8% additional personal income tax charge ( = surcharges)19
Public Finances
Regional Taxes
4%
6% Regional taxes AB 2018
- Registration tax
37%
- Tax on real estate
23% - Road tax (cars)
- Registration tax 2.432.946
- Tax on real estate 156.461
- Tax on first use of car
- Road tax (cars) 1.097.369
- Heavy goods vehicles charge - Tax on first use of car 247.848
- Inheritance tax - Heavy goods vehicles charge 444.267
- Donation tax - Inheritance tax 1.507.653
7% - Donation tax 388.699
2% - Other taxes
- Other taxes 281.327
4%
17% 6.556.570
In keuro
Key regional taxes of Flanders:
Registration tax
Inheritance tax
Road tax for cars20
Public Finances
Breakdown of Public Spending
Education and Training
Welfare, Public Health and Family
Work, professional training and social economy
Chancellory and general government
Mobility and Public Works
Finance and Budget
Other
Economic development, science and innovation
Culture, sport, youth, media
0 4.000.000 8.000.000 12.000.000 16.000.000
2018 AB 2014 ACT
Also in the expenditures we see a large increase, as a result of the Sixth State Reform, in the
adjusted budget 2018 (2018 AB) compared to the realizations 2014 (ACT).
The largest increases are situated in Welfare, Public Health and Family and in Employment and
Social Economy.21
Public Finances
Breakdown of Public Spending
Breakdown of the expenditures 2018 AB Education and training
5% 3% 1%
3% Welfare, public health and family
6% 30%
Chancellory and general government
8%
Mobility and public works
Work, professional training and social economy
8% Finance and budget
Economic development, science and innovation
9%
Environment
27%
Culture, sport, youth, media
other
Key competences in the Flemish budget:
Education
welfare, public health, family22
Public Finances
Realisations
Budgetary targets and results (in mio euro)
1.000
500
0
budget
realisation
-500
-1.000
-1.500
2009 2010 2011 2012 2013 2014 2015 2016 2017 2018
Despite budgetary difficulties in 2009-2010 (financial and economic crisis) and 2013-2014 (stricter
European surveillance) the Flemish Community has taken immediately the necessary measures to
set the budget back on track.
Budget surplus in 2017: 470 million euro23 I. Main Facts & Figures II. Key Strengths III. Public Finances IV. Consolidated Debt V. Flanders in a nutshell
24

                                 Consolidated Debt
                                                                        Overview of the Strategy
•   Diversified financing strategy: Combination of banking and non-banking financing tools;

•   Large and diversified access to short term liquidity: Belgian Commercial Paper programme combined
    with a short term credit line of EUR 3.25bn;

•   Conservative Risk management:
      • Conservative interest rate risk management : indexation linked to fixed rates or simple floating
         rates in the Euro zone (Euribor…); distribution fixed rate / floating rate adjusted depending on
         the long term economic trends; 95% of the outstanding debt at fixed rate as of 31/12/2017
      • Complete hedging of currency risk: no currency risk incurred by the Flemish Community;
      • Systematic hedging at the issuance via swaps in EUR;
      • Conservative approach on derivatives: No structured products;

•   Issuance of bonds as main medium and long term financing tool: Flanders is a recognized issuer in the
    capital markets. Purpose is to build a reference benchmark curve;

•   Diversification of the investor base;
25
Consolidated Debt
Consolidated Debt position
in mio EUR 2015 2016 2017
Direct and indirect debt 4.126,00 4.642,12 5.313,89
VMSW (social housing) 6.313,15 6.282,50 6.112,95
VWF (social housing) 3.005,41 2.842,66 2.705,57
EKM's (social housing) 596,9 590,59 595,41
VIPA (including debt infrastructure
hospitals and rest homes) 1.846,55 1.760,22 1.670,24
DBFM "Schools of Tomorrow" 369,7 393,88 181,96
PPP debt 782,84 779,06 756,93
Hospital infrastructure 0 4.963,21 4.726,93
Rest 1.909,36 1.554,19 1.321,86
TOTAL 18.949,91 23.808,43 23.385,74
In 2016 there was an increase of 4,86 billion EUR. This is mainly due to the take over of the imputed
loans from the federal level (Hospital infrastructure). Without this take over the consolidated debt
would have slightly decreased.
In 2017 the consolidated debt decreased with 420 million euro while an increase of 920 million euro
was expected in the budget 2017.26
Consolidated Debt
Direct Debt position
31/12/2015 31/12/2016 31/12/2017
EMTN 3.201,50 3.516,50 4.836,50
Direct debt instruments 2017
Schuldschein 37,5 37,5
2% 0% 5%
Bank loans 150,44 97,8 95,16 1% 1%
BCP 755 250 0 EMTN
Current account 17,27 738,73 262,27 Schuldschein
Bank loans
FRGE 5,88
BCP
Amoras 50,42
Current account
Ground lease 26,16 91% Rest
TOTAL 4.124,21 4.640,53 5.313,89
95% Fixed Average duration (end 2017):
5% Floating 12 years and 10 months
By the end of 2017 92% of direct debt was financed with the EMTN programme
(EMTN + Schuldschein).
Further increase of duration: from 3 years and 10 months at the end of 2015,
over 10 years and 4 months at the end of 2016 to 12 years and 10 months at
the end of 2017.27
Consolidated Debt
Debt Redemption Schedule
Maturities LT direct debt till 2048
1 200 000 000,00 €
1 000 000 000,00 €
800 000 000,00 €
Bank loans
Schuldschein
600 000 000,00 €
EMTN
400 000 000,00 €
200 000 000,00 €
0,00 €
2018
2019
2020
2021
2022
2023
2024
2025
2026
2027
2028
2029
2030
2031
2032
2033
2034
2035
2036
2037
2038
2039
2040
2041
2042
2043
2044
2045
2046
2047
204828
Consolidated Debt
Bond Financings 2017
MATURITY
EMTN/SCHULDSCHEIN ISSUE DATE MATURITY AMOUNT (in EUR) COUPON (%) YIELD (%)
DATE
EMTN – BE0001764183
1 (tap) 2/06/2017 13/10/2026 10 250,000,000 0.375 0.795
2 EMTN – BE0002284538 2/06/2017 2/06/2042 25 1,000,000,000 1.875
3 EMTN – BE0001773275 23/02/2017 23/02/2038 21 20,000,000 1.656
4 EMTN – BE6295854697 14/06/2017 14/06/2019 2 50,000,000 0.000 -0.440
In 2017 the Flemish Community succesfully launched a benchmark of 1.00 billion euro
with a maturity of 25 years and a 0.25 billion euro tap on the 2026 BM
Private placements on EMTN-program: 70 million euro29
Consolidated Debt
Distribution Stats Benchmark 2017
Tap Oct 2026 Bonds 2042 Bonds
Split by Geography Split by Geography
Other
Other 6% France
Scandinavia 4% 8%
6%
Germany & Austria
Germany &
France
Austria UK Benelux
33% 22%
Germany & Austria
Benelux
Benelux
Scandinavia Germany & Other
Benelux UK Austria
51% Other 64%
6%
Split by Investor Type Split by Investor Type
Others
7% Banks/Treasury Other
10% 1%
CB/Agency Insurance &
11%
Fund Managers Pension Funds
Fund
31% Insurance Companies Fund Managers
Banks/Treasury
Insurance &
Fund Managers Banks/Treasury
Banks/Treasury CB/Agency Pension Funds
38% 51%
45%
Others
Other
Insurance
Companies
6% 2930
Consolidated Debt
Bond Financings 2018
MATURITY AMOUNT (in Spread vs
EMTN/SCHULDSCHEIN ISSUE DATE MATURITY COUPON (%) YIELD (%)
DATE EUR) OLO
1 EMTN – BE6301937411 1/02/2018 1/02/2020 2 125,000,000 0 -0.318 15
2 EMTN – BE0001780346 28/02/2018 28/02/2048 30 60,000,000 1.863 9
3 EMTN – BE0001781351 28/02/2018 1/03/2038 20 30,000,000 1.603 8
4 EMTN – BE6303737959 28/03/2018 28/03/2058 40 80,000,000 1.874 9
In the first months of 2018 the Flemish Community already did several private
placements on the EMTN-program for a total amount of 295 million euro.Consolidated Debt
Financing needs 2018 - 2020
in Mio EUR 2018 2019 2020
VMSW 1,000.00 1,225.41 1,135.09
VWF 350.00 323.23 311.49
School Invest 88.53 35.53 49.88
BAM 87.50 262.50 275.1
TOTAL New funding 1,526.03 1,846.67 1,771.57
Loan redemptions 758.71 58.41 322.67
TOTAL 2,284.74 1,905.08 2,094.24
Financing 2018 (in million euro)
2018
EIB 0
BM issue 1,500.00
BCP 150.00
Private placements 400.00
Balance 234.74
3132
Consolidated Debt
Financial instruments
EMTN (updated 5th September 2016)
Flanders has a EUR10 bn EMTN programme, with public issues and/or a series of private
placements
Currently only fixed interest issues
Programme allows flexibility on rates, currencies, redemptions, etc…
Currently outstanding: EUR 4,381.5 mln EMTN and 37.5 mln Schuldschein
Arranger: ING
Dealers: ING, BNP Paribas Fortis, KBC, Belfius, HSBC, Société Générale, LBBW
ECB-eligible
PSPP eligible
Commercial Paper
Flanders has a EUR 1.5 bn BCP-programme
Arranger: KBC
Dealers: KBC, Belfius
Currently outstanding: EUR 0 mln
STEP-compliant
Cashier : ING creditline of EUR 3.25 bn33 I. Main Facts & Figures II. Key Strengths III. Public Finances IV. Consolidated Debt V. Flanders in a nutshell
34

                              Flanders in a nutshell
                                                                             Credit rating

   Long term credit rating
   • Moody’s: Aa2 stable (Belgium:
   Aa3 stable)

   Short term credit rating
   • Moody’s: P-1

           ISSUER                MOODY'S        FITCH     STANDARD & POORS

FLEMISH COMMUNITY               Aa2 Stable
BELGIUM FEDERAL STATE           Aa3 Stable   AA- Stable     AA Stable
FRENCH COMMUNITY OF BELGIUM     Aa3 Stable
WALLOON REGION                  A2 Stable
BRUSSELS CAPITAL REGION                                     AA Stable
35
Flanders in a nutshell
Key Points and Major Strengths
A wealthy, diversified and strong economy, with one of the highest
European GDP per capita combined with a low and stable
unemployment rate. Flanders is considered as Belgian economic
engine;
Strong track record of Budgetary discipline and continued commitment
to fiscal consolidation;
Modest debt burden and ample access to liquidity;
Strong credit rating of Aa2 Stable by Moody’s; above the rating of the
Belgian federal state.36
Questions ?
Questions by email are also possible
For more information please also consult:
http://www.financeflanders.be
3637
Contacts
Koen Algoed
Secretary – general
Flemish Community, Department of Finance and Budget
+32 493 31 63 02
koen.algoed@fb.vlaanderen.be
Hugues Mommens
Senior advisor, head of financial operations
Flemish Community, Department of Finance and Budget
+32 493 51 22 94
hugues.mommens@fb.vlaanderen.be
Luc Keereman
Senior advisor
Flemish Community, Department of Finance and Budget
+32 493 31 63 07
luc.keereman@fb.vlaanderen.be38
Contacts (2)
Kristien Hantson
Advisor
Flemish Community, Department of Finance and Budget
+32 493 31 63 08
kristien.hantson@fb.vlaanderen.be
Heidi Debedts
Assistant to the director
Flemish Community, Department of Finance and Budget
+32 492 15 38 48
Heidi.debedts@fb.vlaanderen.be
For more information please also consult:
http://www.financeflanders.be39 Disclaimer This presentation has been prepared by Flanders for informational purposes only. Although the information in this presentation has been obtained from sources which Flanders believes to be reliable, we do not represent or warrant its accuracy, and such information may be incomplete or condensed. This presentation report is not intended to provide the sole basis for any evaluation of the transactions discussed herein. All estimates and opinions included in this presentation constitute our judgment as of the date of the presentation and may be subject to change without notice. Changes to assumptions may have a material impact on any recommendations made herein. Flanders will not accept any liability whatsoever for any loss howsoever arising, directly or indirectly, from the use of this presentation or the information provided for in this presentation or otherwise arising in connection with this presentation. This presentation is confidential and is provided to you for information purposes only and does not constitute a public offering or an investment service in Belgium. This presentation is being submitted to selected recipients only and neither this presentation nor any other offering materials may be distributed, published or made available to the public in Belgium. This presentation may not be reproduced or passed on (in whole or in part) to any other person than the selected recipients. Neither this presentation nor any offering materials may be used in relation to any investment service in Belgium unless all conditions of directive 2004/39/EC, as implemented in Belgium, are satisfied. Neither this document nor any offering materials can be used to publicly solicit, provide advice or information to, or otherwise provoke requests from, the public in Belgium in relation to the offering. Any offering in Belgium is made exclusively on a private basis in accordance with article 3 of the Belgian law of 16 June 2006 on the public offering of investment instruments and the admission of investment instruments to the trading on a regulated market. © May 2018 Flanders. All rights reserved.
40

APPENDIX
41
Flanders in a Nutshell
Key Investment Highlights
One of the strongest Flanders has a wealthy, diversified and strong economy with one of Europe’s highest
regions in Europe GDP per capita; unemployment rate close to Germany and solid economic growth
Flanders is collecting a greater part of its revenues via own fiscal instruments; which is
Solid Financial
positive in the context of economic growth and increasing GDP per capita levels
Situation
Fiscal flexibility: Flanders can levy more taxes rapidly if needed
Through the 6th state reform, Flanders has received a greater range of competences
Fiscal Autonomy
and benefits from an increased tax autonomy (own fiscal instruments)
Positive track record Over recent years, Flanders has demonstrated its ability to reduce deficits while
of Budgetary discipline maintaining economic growth and social welfare.
Moderate direct debt Despite ESA 2010 rules, moderate levels of debt combined with a sound financial
levels management strategy (no debt wall)42
Flanders Part of the Federal State Belgium
Belgium Federal Structure
Since the 2nd State Reform
3 Regions: 3 Communities:
in 1980, the Flemish
Flanders Flemish
Federal State
Wallonia French Community and the
Brussels German
Flemish Region
10 Provinces immediately decided to
merge their competences.
589 Towns and Cities
As a result, Flanders has
one Flemish Parliament,
one Flemish Government
and one public
administration, responsible
for community and
regional matters.43
Flanders Part of the Federal State Belgium
Competence Distribution
Federal State Flemish Community Flemish Region
“powers related to public interest” “powers related to language “powers related to territory
and culture” and economy”
Economic development & co-
Public Finances Education
Defense Culture operation
Security Public health (prevention) Public infrastructure
Justice Welfare Town & country planning
Social Security Language issues Environment
Public Health Child protection Energy
Domestic & International Family Affairs Employment
politics Agriculture
Transport & Communication Foreign Trade
Regional transport
Control & organization of
local governments44
Contribution to the consolidated debt
(Maastricht in million euro)
Consolidated debt of Belgium
2013 2014 2015 2016 2017
Federal Gov and Soc Security 345.167,00 354.636,00 361.995,00 366.083,00 371.154,57
Communities and Regions 45.756,00 48.705,00 48.939,00 57.214,00 57.284,23
Local entities 22.803,00 24.163,00 23.964,00 23.915,00 23.915,00
Total 413.727,00 427.503,00 434.898,00 447.212,00 452.353,80
2013 2014 2015 2016 2017
Walloon Region 18.284,80 19.435,50 20.360,30 21.271,00 21.339,23
Brussels Region 4.278,20 4.219,10 3.893,50 3.799,00 4.146,06
Flemish Community 16.710,80 18.285,20 17.341,10 18.187,10 18.157,27
French speaking Community 5.916,50 5.958,10 6.408,10 7.075,20 7.105,50
Interregional 366,70 460,80 476,00 6.428,90 6.056,65
Rest 198,90 346,00 459,80 452,50 479,52
Total 45.755,90 48.704,70 48.938,80 57.213,70 57.284,2345
Contribution to the consolidated debt
Regional & Local debt
Regional & Local debt (% GDP - 2015)
35,0
Regional Government
30,0
Local Government
25,0
20,0
15,0
10,0
5,0
0,0
Austria Belgium Germany Spain SwitzerlandYou can also read