INDEPENDENCE GROUP NL - PETER BRADFORD, MANAGING DIRECTOR AND CEO 13th China Nickel Conference May 2016
←
→
Page content transcription
If your browser does not render page correctly, please read the page content below
INDEPENDENCE GROUP NL
PETER BRADFORD, MANAGING DIRECTOR AND CEO
13th China Nickel Conference
May 2016
Cautionary statements & disclaimer
•   This presentation has been prepared by Independence Group NL (“IGO”) (ABN 46 092 786 304). It should not be considered as an offer or invitation to subscribe for
    or purchase any securities in IGO or as an inducement to make an offer or invitation with respect to those securities in any jurisdiction.
•   This presentation contains general summary information about IGO. The information, opinions or conclusions expressed in the course of this presentation should be
    read in conjunction with IGO’s other periodic and continuous disclosure announcements lodged with the ASX, which are available on the IGO website. No
    representation or warranty, express or implied, is made in relation to the fairness, accuracy or completeness of the information, opinions and conclusions expressed
    in this presentation.
•   This presentation includes forward looking information regarding future events, conditions, circumstances and the future financial performance of IGO. Often, but not
    always, forward looking statements can be identified by the use of forward looking words such as "may", "will", "expect", "intend", "plan", "estimate", "anticipate",
    "continue" and "guidance", or other similar words and may include statements regarding plans, strategies and objectives of management, anticipated production or
    construction commencement dates and expected costs or production outputs. Such forecasts, projections and information are not a guarantee of future performance
    and involve unknown risks and uncertainties, many of which are beyond IGO’s control, which may cause actual results and developments to differ materially from
    those expressed or implied. Further details of these risks are set out below. All references to future production and production guidance made in relation to IGO are
    subject to the completion of all necessary feasibility studies, permit applications and approvals, construction, financing arrangements and access to the necessary
    infrastructure. Where such a reference is made, it should be read subject to this paragraph and in conjunction with further information about the Mineral Resources
    and Ore Reserves, as well as any Competent Persons' Statements included in periodic and continuous disclosure announcements lodged with the ASX. Forward
    looking statements in this presentation only apply at the date of issue. Subject to any continuing obligations under applicable law or any relevant stock exchange
    listing rules, in providing this information IGO does not undertake any obligation to publically update or revise any of the forward looking statements or to advise of
    any change in events, conditions or circumstances on which any such statement is based.
•   There are a number of risks specific to IGO and of a general nature which may affect the future operating and financial performance of IGO and the value of an
    investment in IGO including and not limited to economic conditions, stock market fluctuations, commodity demand and price movements, access to infrastructure,
    timing of environmental approvals, regulatory risks, operational risks, reliance on key personnel, reserve and resource estimations, native title and title risks, foreign
    currency fluctuations and mining development, construction and commissioning risk. The production guidance in this presentation is subject to risks specific to IGO
    and of a general nature which may affect the future operating and financial performance of IGO.
•   Any references to IGO Mineral Resource and Ore Reserve estimates, except the Nova Ore Reserve should be read in conjunction with IGO’s 2015 Mineral Resource
    and Ore Reserve announcement dated 28 October 2015 and lodged with the ASX, which are available on the IGO website. The Nova Ore Reserve was updated
    during the optimisation study dated 14 December 2015 and lodged with the ASX, which is available in the IGO website.
•   All currency amounts in Australian Dollars unless otherwise noted.
•   Cash Costs are reported inclusive of Royalties and after by-product credits on per unit of payable metal basis, unless otherwise stated
•   IGO reports All-in Sustaining Costs (AISC) per ounce of gold for its 30% interest in the Tropicana Gold Mine using the World Gold Council guidelines for AISC. The
    World Gold Council guidelines publication was released via press release on 27th June 2013 and is available from the World Gold Council’s website.
•   Underlying EBITDA is a non-IFRS measure and comprises net profit or loss after tax, adjusted to exclude tax expense, finance costs, interest income, asset
    impairments, depreciation and amortisation, and once-off transaction costs.

                                                                                                                                                                                 2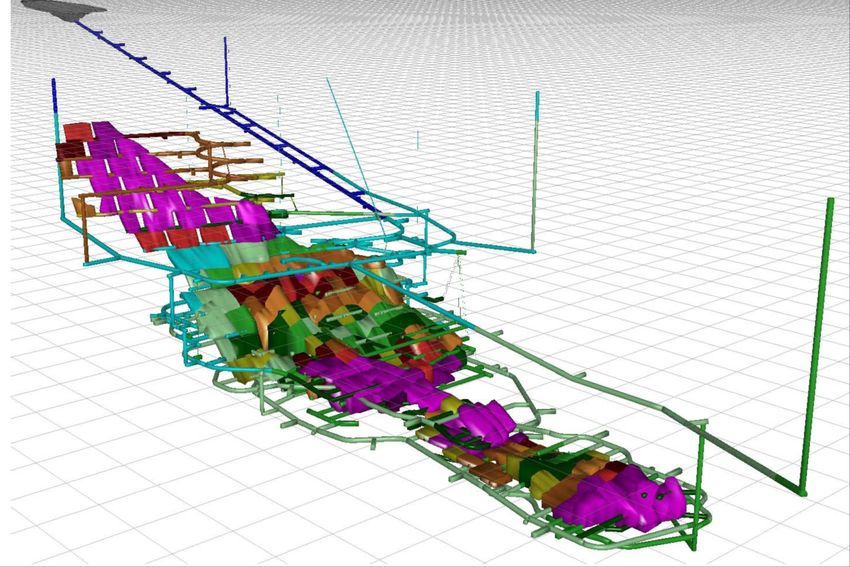
IGO overview
Leading Australian diversified mining company

ASX listed (IGO)
•   Based in Perth, Western Australia
Diversified portfolio of high margin
assets
•   3 operating mines and 1 under construction
•   All located in Western Australia
•   Gold, Nickel, Zinc, Copper, Cobalt, Silver
Strong track record of delivery
•   Strong cash flow
•   Strong balance sheet
•   Strong management
Fully financed growth
•   Tropicana mill expansion and resource
    extension
•   Nova Nickel/Copper Project construction
•   Belt scale exploration targets in Australia

                                                  3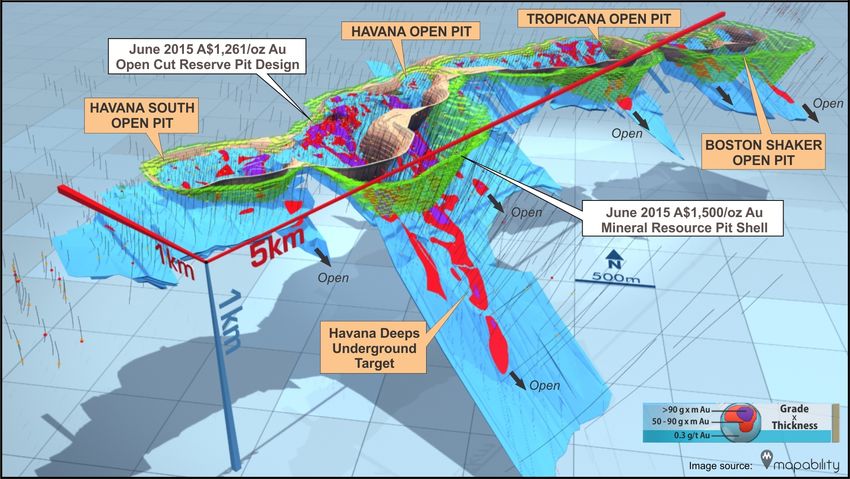
Market profile & share ownership
Strong domestic institutional and retail support
Market profile Share ownership
• $1.5 billion (US$ 1.1 billion(1)) market • Substantial holders(3)
capitalisation at $2.97/share(2) Mark Creasy 18.88%
• Share price 52 Week Range FIL Limited 9.92%
Low $1.98 20 January 2016 Van Eck 6.15%
High $6.21 5 May 2015 Australian Super 6.04%
Price ($) Volume (M)
• Institutional ownership(2)
7.00 14 Australia 72%
6.00 12
USA & Canada 19%
UK & Europe 6%
5.00 10
Rest 3%
4.00 8
3.00 6
2.00 4
30% 28%
1.00 2
- - 70% 72%
18-May-15
18-Dec-15
18-May-16
18-Apr-16
18-Jun-15
18-Aug-15
18-Mar-16
18-Oct-15
18-Jan-16
18-Nov-15
18-Jul-15
18-Sep-15
18-Feb-16
1) Conversion of A$ to US$ using 0.72 exchange rate Instos Retail & Other Domestic Instos International Instos
4
2) As at market close 18 May 2016
3) As at 13 May 2016
IGO asset portfolio
Company in transition
Macquarie Research: IGO Macquarie Research: IGO
EBITDA - FY15 EBITDA - FY18e
Long Jaguar Tropicana Long Jaguar Tropicana Nova
600 Macquarie Research EBITDA Profile 600
Unlocking Value 500 500
• Development of world class Nova project 400 400
• Tropicana growth 300 300
Process plant throughput rate +21%
Long Island Study 200 200
• Exploring belt scale opportunities for tier 1
100 100
assets
0 0
1) Source Data: Macquarie Research
Long ($M) Jaguar ($M) Tropicana ($M) Nova ($M) 5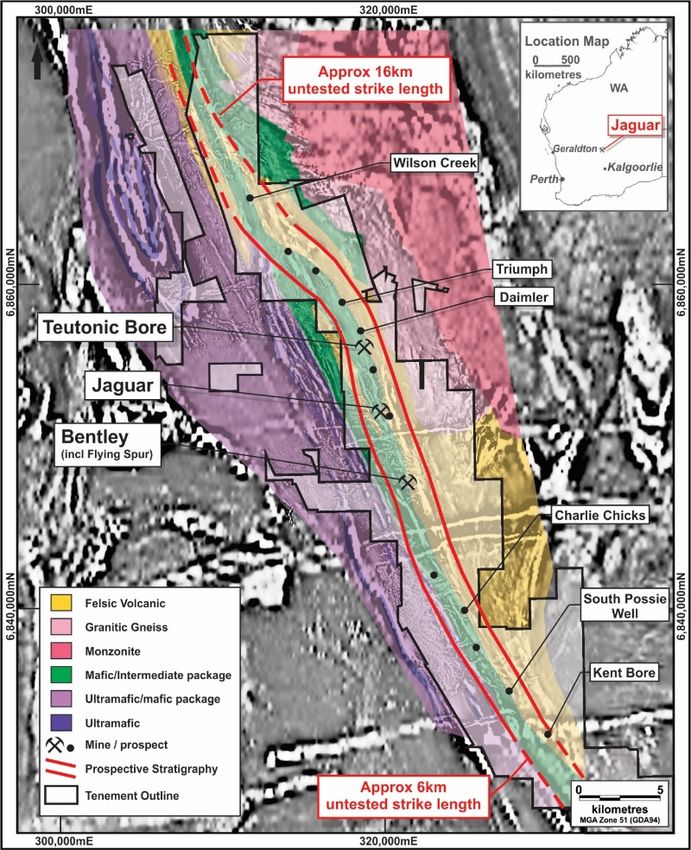
IGO asset portfolio
     Portfolio of gold and base metals assets
                                            Mining                                                         Construction                         Permitting                        Exploration

         Au                                  Ni                          Zn/Cu                              Ni/Cu Cu/Zn
     TROPICANA                              LONG                             JAGUAR                               NOVA                        STOCKMAN                              VARIOUS
     30% JV Interest                     100% owned                          100% owned                        100% owned                        100% owned                           70-100%

     West Australia                     West Australia                      West Australia                    West Australia                     Vic, Australia                        Australia

      135,000oz(1)                        8,750t Ni(1)                       39,000t Zn +                      26,000t Ni +                      15,000t Cu +                      Au, Ni, Cu, Zn
                                                                             6,750t Cu(1)                      11,500t Cu(3)                     26,000t Zn(5)
      $715/oz(1)(2)                    $3.75/lb Ni(1)(2)                  $0.65/lb Zn(1)(2)                   $1.21/lb Ni(4)                  $1.30/lb Cu(2)(5)
     (US$515/oz)(7)                   (US$2.70/lb Ni)(7)                 (US$0.47/lb Zn)(7)                 (US$0.87/lb Ni)(7)               (US$0.94/lb Cu)(7)
                                                                                                             $200M capex(6)                    $202M capex(5)

1)    FY16 guidance range mid-point
2)    Cash costs are inclusive of royalties and net of by-product credits per unit of payable metal
3)    Nova production average LOM production from Definitive Feasibility Study (refer to Sirius ASX release dated 14 July 2014)
4)    Nova cash costs are average LOM production and cash costs from Optimisation Study (refer to ASX release dated 14 December 2015) and cash costs are shown net of by-product credits and
      per unit of metal in concentrate
5)    Stockman production and cash costs are average LOM production and cash costs from Optimisation Study (refer to IGO ASX release dated 28 November 2014)
6)    Nova total CAPEX $443M with $200M remaining as at 31 March 2016 (refer to ASX release dated 28 April 2016)
7)    Conversion of A$ to US$ using 0.72 exchange rate
                                                                                                                                                                                                    6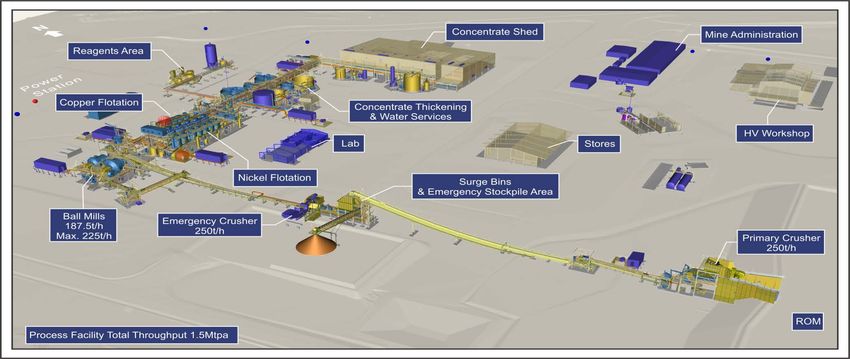
Balance sheet and funding
Existing operations continue to deliver robust free cash flow

                        $200M remaining construction capex at Nova(1)

                           Free cash flow from operating activities

                                  $41M cash and bullion(1)

                          $310M of $550M debt facilities undrawn(1)

1)   At 31 March 2016
                                                                        7
Tropicana overview
     Transition to higher process rates

     30% IGO and 70% AngloGold Ashanti
     •     Located 370km East NE of Kalgoorlie
     Low cost and long mine life
     •     3 Moz Ore Reserves(1) contained within 7 Moz Resources(1)
     •     Open Pit mining with remaining LOM strip ratio of 5.7(1)
     Scale
     •     5.8 Mtpa nameplate processing plant
     •     Potential to debottleneck to +7.0 Mtpa
     •     400,000 oz/yr sustainable production rate(2)
     FY16 guidance
     •     135,000oz(3) (IGO share)
     •     Cash cost of $715/oz(3) (US$515/oz(4))
     •     AISC of $925/oz(3) or US$666/oz(4)

1)    As at 30 June 2015, refer to ASX release 28 October 2015 Mineral Resource and Ore Reserve Update
2)    Based on ~7.0 Mtpa throughput, 2 g/t average reserve grade and 90% average recovery
3)    Mid-point of guidance range, refer ASX release 28 April 2016 titled March 2016 quarterly report
4)    Conversion of A$ to US$ using 0.72 exchange rate                                                   8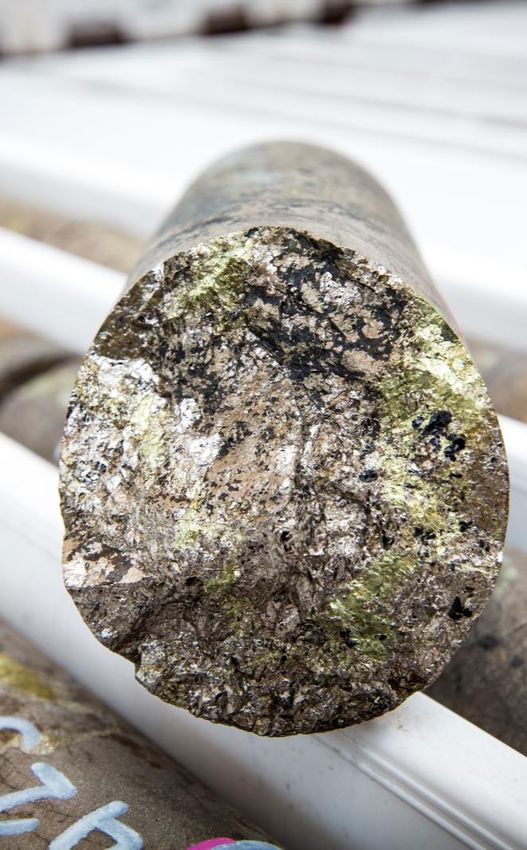
Tropicana upside
Significant potential to extend mine life beyond initial 10 years
Gas project well progressed
• 292km pipeline completed ahead of plan
• Powerhouse conversion underway 10 of 17 gas fired engines commissioned
Process plant debottlenecking ongoing
• Increase throughput from 5.8Mtpa to +7.0Mtpa
Resource extension drilling underway
• Targets generated by 3D seismic survey
• Encouraging results(1) indicating potential to extend mineralisation
HSD016: 19m @ 3.76g/t Au
SWD005A: 17m @ 4.29g/t Au
TPD456: 35m @ 2.41g/t Au
Studies underway to incorporate ~3 Moz of existing resource
outside current reserves into mine plan
• Aim to maintain current operating margin and extend mine life
1) For Tropicana exploration results refer ASX release dated 29 February 2016 titled Tropicana Gold Mine Exploration Updated
9
Tropicana pits
Four contiguous pits extending over a five kilometre strike

                                                              10
Long overview
History of consistent low cost production and exploration success
High grade underground nickel
• Located in Kambalda, 60km south of Kalgoorlie
35 year operating history
• Acquired by IGO in 2002
• Average grade project to date of 3.8% Ni
• Owner operated underground mining
• Consistent low cost producer with history of exploration
success
FY16 guidance(1)
• 8,750t nickel at $3.75/lb(2) or US$2.70/lb(3)
• Positive reserve call factor
BHP Nickel West relationship
• Toll processing of ore
• Concentrate offtake agreement
1) FY16 guidance range mid-point, refer ASX release 28 April 2016 titled March 2016 quarterly report
2) Cash costs are inclusive of royalties and net of by-product credits per unit of payable metal
3) Conversion of A$ to US$ using 0.72 exchange rate 11Jaguar overview
High grade Zn-Cu VMS camp
High grade underground Zn-Cu-Ag-Au VMS deposit
• Located 300km north of Kalgoorlie via sealed road, fly in – fly out from Perth
Significant improvement in operation over last 1-2 years
• Acquired by IGO in 2011
• Owner operated underground mining
• 450 to 500ktpa processing plant producing zinc and copper concentrates
FY16 guidance(1)
• 39kt zinc & 6,750t copper at $0.65/lb Zn(2) or US$0.47/lb Zn(3)
• Known VMS camp with significant exploration upside
• In-mine resource extension potential with recently completed drilling of Flying
Spur lens and Bentley Deeps
• Near-mine potential with Triumph discovery
• Regional exploration potential with over 50km of known strike along
prospective corridor
1) FY16 guidance range mid-point, refer ASX release 28 April 2016 titled March 2016 quarterly report
2) Cash costs are inclusive of royalties and net of by-product credits per unit of payable metal
3) Conversion of A$ to US$ using 0.72 exchange rate 12Jaguar in-mine resource extension
Drilling recently completed at Flying Spur
13Nova overview
World class, low cost magmatic nickel-copper project
Fully funded underground Ni-Cu-Co project in construction
• Located in highly prospective Fraser Range, Western Australia
• 350km SE of Kalgoorlie and 350km from port of Esperance
• Acquired by IGO in 2015(1)
Project timeline is a testament to project quality
• Discovered in July 2012
• Feasibility study completed in July 2014
• Construction commenced in January 2015 and now 85% complete(2)
• Project remains on schedule for production of first concentrate in December
2016
World class project
• High margin (low cost and high payability)
• Scale (average 26ktpa nickel and 11.5ktpa copper)
• Long mine life (initial 10 years)
• Significant exploration upside in emerging province
1) Transaction completion 22 September 2015
2) As at 30 April 2016
14Nova on schedule and on budget
Overall project now 85% complete
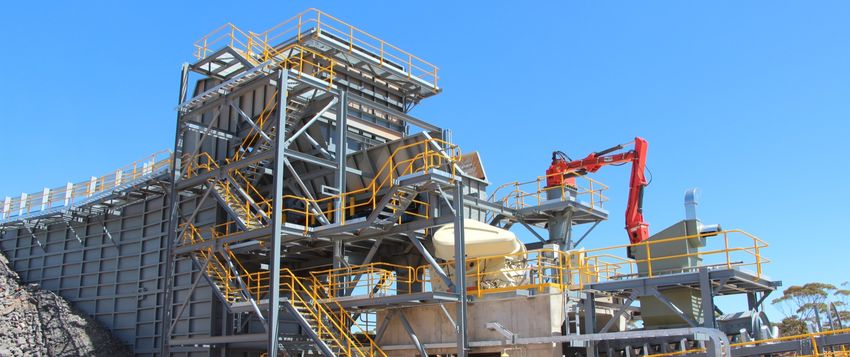
15Nova progress
All major long lead items now on site
Underground Face Mapping Underground Equipment Workshop Crushing Circuit
Grinding Circuit Flotation Circuit Concentrate Filtration Circuit
16Nova mine layout
Designed for flexibility and productivity
Portal
• Mine development ahead of schedule
• 4.3km of development completed to 30 April 2016
• Ground conditions are very good
• First development in ore expected in June quarter
2016
Upper
Nova
Lower
Nova
* Calendar years
Feeder
Zone
Bollinger
1) Refer to ASX release dated 14 December 2015 Nova Optimisation Study Presentation 171.5Mtpa Nova processing plant
Conventional design with best in class components
• Construction based on lump sum turnkey contract with GRES
• Process plant and associated infrastructure is ahead of schedule and 66%
complete
• GRES will complete dry and wet commissioning and assist IGO with ore
18
commissioningImproved mine schedule adds value
Updated mining sequence improved project NPV by 26%(1)
Production Schedule(2) Updated production
2.00 2.50% delivers:
Head grade (%)
Ore Mined (Mt)
1.75 Accelerated ramp-up to 1.5Mtpa in
FY17 & FY18
2.00%
1.50
Consistent 1.5Mtpa production
1.25 profile
1.50%
1.00
High NSR ore brought forward
early in the LOM
1.00%
0.75
0.50
0.50%
0.25
Results in improved early cash
- - flow and additional project value
2015 2016 2017 2018 2019 2020 2021 2022 2023 2024 2025 2026 2027 2028
OS: Ore OS: Ni OS: Cu
1) Refer to ASX release dated 14 December 2015 Nova Optimisation Study Presentation
2) Financial years
19Nova concentrates
Highly marketable concentrates
Nickel concentrates
• Nickel concentrate grading 13.5% Ni
• No Arsenic
• High Fe to MgO ratio preferred by smelters
Nickel offtake agreements
• Three year contract
• 50% contracted with BHPB Nickel West, delivered via road to
Kambalda
• 50% contracted with Glencore, exported via port of Esperance
Copper concentrates
• Copper concentrate grading 29%
• No deleterious elements
Copper offtake agreements
• Three year contract
• 100% contracted with Trafigura, exported via port of Esperance
20Capital costs reduced
Benefiting from downturn in construction industry
Optimisation % Variance to
Capital Cost Unit
Study DFS
Initial Capital(1) $M 443 6%
Sustaining Capital(2) $M 148 3%
Initial capital cost revised down to $443M
• Resulted from increased competitiveness in cost inputs
• Included $22M contingency
Additional capital costs through scope changes absorbed:
• Upgrade in size of the concentrate filter and concentrate handling area
• Continued acceleration of underground mining rates
• Additional hydrogeological drilling and dewatering
• Commencement of upgrade to the LOM ventilation capacity
1) The revised Initial Capital Cost was reported on the 27 January 2015.
2) Sustaining capital costs includes closure costs estimated at $25M 21Competitive operating costs(1)
Optimisation Study added 36% more value - reduced risk - future growth
Operating Costs Per Tonne Ore(2)
120
Operation Costs ($/t ore)
100 4.51
10.24
9.61
80
30.68
60
40
49.37
20
Nova – 2019E
0
OS
Mining Processing
G&A Haulage and handling
Optimisatio % Variance
Operating Cost Unit
n Study to DFS
C1 cash costs in
$/lb 1.21 27%
concentrate(3)
C1 cash costs payable(3) $/lb 1.65
AISC in concentrate(4) $/lb 1.83 21%
1) Refer to Nova Optimisation Study ASX release dated 14 December 2015
2) Shipping costs per tonne of ore assumes 50% of the nickel concentrate treated at BHPB (Nickel West), hence no shipping costs is allocated to this parcel of ore
3) C1 cash costs are Life of Mine average cash costs and include all operating costs (excluding royalties) and are presented after by product credits
4) AISC (All-in sustaining cash costs) are Life of Mine average costs and include C1 cash costs plus addition of royalties and sustaining capital costs 22Nova in mine exploration
Opportunities for additions to mining inventory prioritised
Current status
• Swick Mining Services awarded
underground drilling contract at Nova
• Two drill rigs on site
• Exploration drilling to be dovetailed
with stope definition drilling program
• Structural studies suggest preferred
remobilised sulphide orientations
• Utilisation of DHEM planned, forward
modelling completed
Next steps
• Extensions of selected holes as EM
platforms and testing of priority
targets
23Stockman Project
Feasibility completed and permitting well advanced
Cu-Zn underground VMS project
• Located 460km north-east of Melbourne
Positioned for development
• Feasibility studies completed
• Environmental Effects Statement and Federal
EPBC Act approval
Robust financial metrics
• Expected capital cost of $202M
• Average annual production of 15,000t Cu and
26,000t Zn
• Expected cash costs of $1.30/lb
Marketable concentrates
• 50% Zinc concentrate grade
• 21% Copper concentrate grade
1) For detailed project parameters see ASX release dated 28 November 2014 Independence Delivers Positive Optimisation Study for Stockman Copper-Zinc Project
2) For details of Mineral Resources and Ore Reserves see ASX release dated 28 October 2015 Mineral Resources and Ore Reserves Update
24Generative exploration
Long term commitment to delivering organic growth
• Diverse greenfields and brownfields exploration projects
• Targeting provinces that can deliver multiple gold and base metals
projects
• Portfolio includes belt scale projects with potential for Tier 1 assets:
Nova – Tropicana Belt
Lake Mackay JV
Bryah Basin JV
• Utilising science to drive area selection
• CY16 Exploration budgeted at $25M(1)
CY16 Exploration budget
4%
28% 20%
Long
Jaguar
Tropicana
Nova
12%
Greenfields
36%
1) Midpoint of CY16 guidance, 25Fraser Range – Tropicana exploration
Base metal exploration underway across province
Nova regional Salt Creek
26Lake Mackay exploration
Target defined at Bumblebee prospect
Target identified by regional sampling in
2015
• Bumblebee discovery announced in October 2015
• Moving loop electromagnetic survey identified a
conductive target below the Bumblebee prospect in
2016
• RC and diamond drilling in June quarter 2016
EM anomaly
1) For details on Bumblebee MLEM survey see ABM Resources ASX release Geophysical Survey Results Enhance Bumblebee Prospect dated 23 March 2016
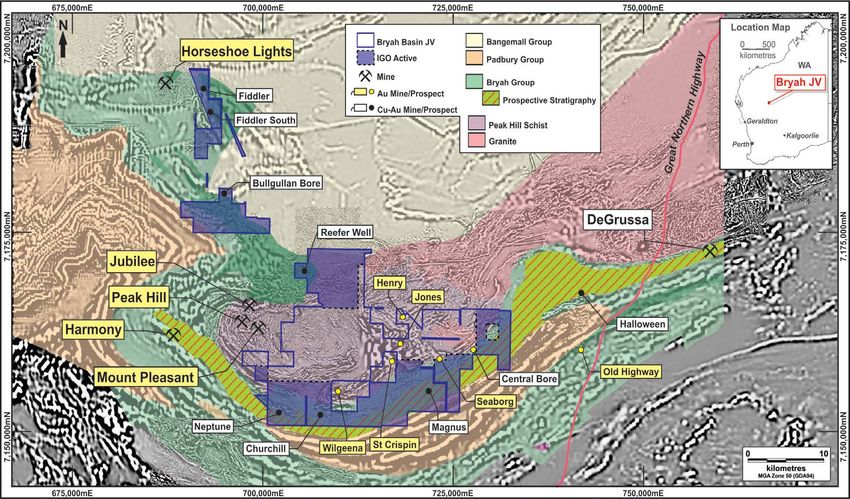
2) For details on Bumblebee drilling see ABM Resources ASX release Announcing the Bumblebee Gold-Copper-Silver-Lead-Zinc-Cobalt Discovery dated 6 October 2015 27Bryah Basin JV
Targeting De Grussa Style high grade Cu-Au deposits
28Sustainability
Continued strengthening and improvement across the business
29Concluding comments
Diversified mining company delivering cash flow and growth
Deliver Nova Project on time and on budget with first
production in December 2016
Maintain focus on cash management and operational
performance
Unlock scale and value at Tropicana throughout 2016
Unlock upside through investment in brownfields and
greenfields exploration
30You can also read


