Investor Presentation | March 2016 - Hannon Armstrong
←
→
Page content transcription
If your browser does not render page correctly, please read the page content below

Investor Presentation | March 2016

Forward Looking Statements

2
    Some of the information contained herein are forward-looking statements and within the meaning of Section 27A of the Securities
    Act of 1933, as amended, and Section 21E of the Securities Exchange Act of 1934, as amended. When used herein, words such as
    "believe," "expect," "anticipate," "estimate," "plan," "continue," "intend," "should," "may," "target," or similar expressions, are intended
    to identify such forward-looking statements. Forward-looking statements are subject to significant risks and uncertainties. Investors are
    cautioned against placing undue reliance on such statements. Actual results may differ materially from those set forth in the forward-
    looking statements. Factors that could cause actual results to differ materially from those described in the forward-looking statements
    include those discussed under the caption "Risk Factors" included in our Annual Report on Form 10-K for our fiscal year ended Dec.
    31, 2015, which was filed with the U.S. Securities and Exchange Commission (SEC), as well as in other reports that we file with the
    SEC.

    Forward-looking statements are based on beliefs, assumptions and expectations as of February 25, 2016. We project annualized
    Core Earnings growth in the range of 14% to 19% per diluted share for 2016 and continued double-digit Core Earnings growth for
    2017. This guidance reflects the Company's estimates of (i) yield on its existing Portfolio; (ii) yield on incremental Portfolio
    investments, inclusive of the Company's existing pipeline; (iii) amount, timing, and costs of debt and equity capital to fund new
    investments; and (iv) changes in costs and expenses reflective of the Company's forecasted operations. All guidance is based on
    current expectations of future economic conditions, the dynamics of the markets in which it operates and the judgment of the
    Company's management team. We disclaim any obligation to publicly release the results of any revisions to these forward-looking
    statements reflecting new estimates, events or circumstances after the date of this presentation.

                                                                                                                                                   2
Hannon Armstrong: Q4 & FY 2015 Highlights
     •   $0.25 Core EPS for Q4 2015
3
     •   12% annual Core EPS Growth to $1.04/share
     •   15% increase in dividend to $0.30/share in Q4, for yield of 6.9%1
     •   $340 million closed in Q4 and $935 million for FY 2015
     •   6.2% balance sheet yield as of 12/31/15, up from 6.0% at 9/30/15
     •   ~$400 million in capital raised with equity offering and new non-recourse debt in Q4 2015
     •   2.1:1 leverage, up from 1.9:1
     •   71% fixed rate debt target achieved                               Core Earnings Per Share
                                                   $1.40                                                     $1.18 to $1.24
               Target Asset Classes                $1.20
                                                                                                $1.04
                                                   $1.00                       $0.93
                                                                                                        14-19%
                      Efficiency                   $0.80                                                Growth
                                                                                                         Target
                                                   $0.60
                                                               $0.43
                        Wind                       $0.40

                                                   $0.20

                        Solar                        $-
                                                               2013A           2014A            2015A             2016E

                                               1   Source: Bloomberg – Based on HASI closing share price of $17.28 on 2/24/16   3
Market Update – Macro Conditions
           Headline Risk                                  Near Term Impact                                        2016-2017 Impact
4
                                              Re-priced several Q4 transactions, caused
    • Market volatility                                                                                Better economics, margins
                                              delays, impacting Q4 CE

    • Falling oil and natural gas             Oil, zero                                                Oil, zero. Natural gas affects merchant
      prices                                  Natural gas, limited                                     pricing; we protect with preferred flips
                                              Fixed out 71% of rates, increased Q4 interest
    • Rising interest rates                                                                            Stronger balance sheet
                                              expense

    • Falling interest rates                  Wider spreads for new business                           Forward yield up to 6.2%

    • Stress on banks                         Diversified bank partners in Q4                          Creates more lending opportunities

                                              Minimal, ~10% exposure; underwrite to
    • YieldCo sell-off                                                                                 Equity is no longer ‘cheaper’ than debt
                                              project not the YieldCo1
                                              October raise was timely; Increased leverage
    • Closed equity markets                                                                            2016 plan requires less equity than 2015
                                              to 2.1:1

    • SCOTUS stay of the CPP                  Minimal                                                  Minimal; our driver is economics not policy

    • Exposure to Nevada resi-solar           None                                                     Resi-solar is less of a focus
    • 2016 Elections                          None                                                     Minimal

            Headline Risks taken together cause us to widen range of 2016 guidance
                               1   Based on transactions held by a YieldCo or intended to be dropped down to a YieldCo; Excludes residential solar portfolio   4
Increased Market Volatility Reinforces our Investment Thesis…
  Distributed Solar                                                                 Efficiency

                       Residential           Commercial            Industrial

                                        Regulated Utility

 Utility Scale Solar                                                            Utility Scale Wind

                                       Power Purchase Agreement

                                     Regulated Utility Investors

…Best Risk-Adjusted Returns are in the Senior or Preferred Position.
                                                                                                     5
Our Strategy Stays The Same, While Our Client List Expands

                                                       Originate
                                                    Programmatic
                                                  Assets with Positive
                                                     GHG Profile

    Internally managed                                                                         • Sustainability Report
•
•   Average                    Experienced Team                          Competitive Cost of     Card
    management tenure                                                        Capital           • Sustainable Yield℠
    is 13 years                                                                                  Bonds with
                                                                                                 CarbonCount™
       •    Deep industry
            experience since
            late 1980s

              Core Purpose: Generate superior risk-adjusted returns using finance to enable
                             GHG reducing assets to be adopted at scale.
                                                                                                                         6
Clean Energy Financing Opportunity Continues to Grow
  Our Three Large Markets Are Getting Larger1                          Hannon’s Financing Complements
                                                     Transaction            Industry Incumbents
                                                        Size
      Utility Market            With PTC extension

                                                                       Commercial                         Life Insurance
                                                                         Banks                              Companies
     With ITC extension
                                 Wind

              Solar                                                                 Private
                                                                                    Equity
                          Hannon
          DG Solar

                                                                                       Hannon
                              Efficiency

      Retail Market

                                                                                                                      Tenor

                                                                   • Flexibility in deal size and tenor
Hannon Competitive Advantages:                                     • Low cost of capital
                                                                   • Clear-eyed view of risk and return
                                                                                              1
                                                                                                                               7
                                                                                                  Illustrative; not to scale
Pipeline is Strong, Giving Us More and Better Investment Choices
Pipeline on the Right Side of the Climate Change Line 1
12-Month Pipeline >$2.5 Billion…                                                                     Significant GHG Reductions in Q4….

                                                                                                                                                               Removing
                                                                                                                                 305,690
                  Solar                                                                                                         Metric Tons
                  14%
                                                                                                                                 of GHGs
                                                                                                                                 reduced
                                                                                                                                 annually
                                                                                                                               from Q4 ‘15                     148 thousand
                                                                                                                               investments
     Wind                                                                                                                                                       Metric Tons
                                                 Efficiency
     19%              >$2.5b                        67%
                                                                                                                                                                 of Coal

                                                                                              …and Meaningful Differences in Impact
                                                                                                    by Asset Class and Geography
                                                                                                                                     2

                                                                                                                 MT of GHG/$1,000
                                                                                                                   of Investment
                                                                                                                                    1.5

…and PTC/ITC extension should                                                                                                        1

increase Wind and Solar Pipeline.                                                                                                   0.5
                                                                                                                                     0
                                                                                                                                          Efficiency    Wind              Solar
            1Estimatedcarbon savings are calculated using the estimated kilowatt hours (“kWh”), gallons of fuel oil, million British thermal units (“MMBtus”) of natural gas and gallons of water
              saved as appropriate, for each project. The energy savings are converted into an estimate of metric tons of CO2 equivalent emissions based upon the project’s location and the
                        corresponding emissions factor data from the U.S. Government and International Energy Administration. Portfolios of projects are represented on an aggregate basis.         8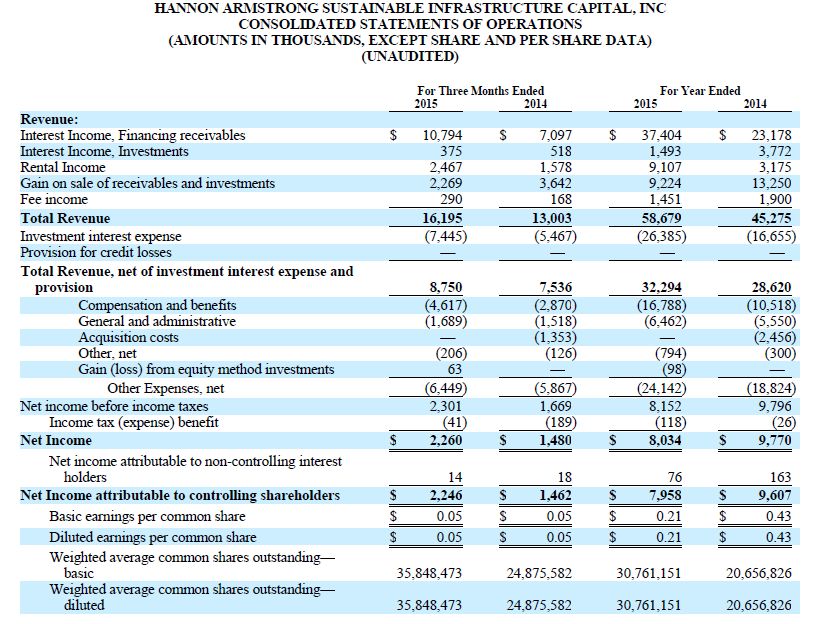
Summary Financial Data
                 Results, Unaudited                                  Q4                     Q4           FY                 FY
                    ($ in millions)
                                                                                                                                                            Notes
                                                                   2015                   2014         2015               2014
       Investment income, core                                    $ 17.9            $ 11.7           $ 62.5              $ 32.8 Grew YoY portfolio from $0.9b to $1.3b
       Other Investment Revenue                                      2.6                   3.8             10.7            15.2
       Core Total Revenue                                          20.5                   15.5             73.2            48.0          32% Increase Q4’14 to Q4’15
       Investment interest expense                                 (7.4)                  (5.5)       (26.4)             (16.7)                       71% Fixed-rate debt
       Core Total Revenue, net                                     13.1                   10.0             46.8            31.3
                                                                                                                                                 Higher SG&A due to growth in
       Other expenses, core                                        (3.6)                  (2.9)       (13.2)             (11.0)                          the business
       Core Earnings                                                 9.5                   7.1         33.51               20.3
       Core Earnings/Share                                        $0.25              $0.27            $1.04              $0.93             12% Core YoY EPS Growth
                                                                                                                                            1   After subtracting $0.1 million of cash taxes paid
                    Balance Sheet Portfolio2

                                                                                                            Quarterly Transaction Volume Fluctuates
                            Wind                  Efficiency ≈4.4%
                            37%                        31% Yield                                               Due to the Nature of the Assets
          ≈6.9%                       ≈6.2%                                                                                       ($ in millions)
           Yield
                                       Yield              Other
                                                           2%
                                                                                                              Q4 ’14         Q1 ’15         Q2 ‘15               Q3 ’15             Q4 ’15
                                                                   ≈8.5%
                                                                    Yield                         Volume          $375        $104              $350              $140               $340
                                         Solar
                                         30%
                                                                                                                                                                                                    9
2   Represents forward looking unlevered return on assets yield as of December 31, 2015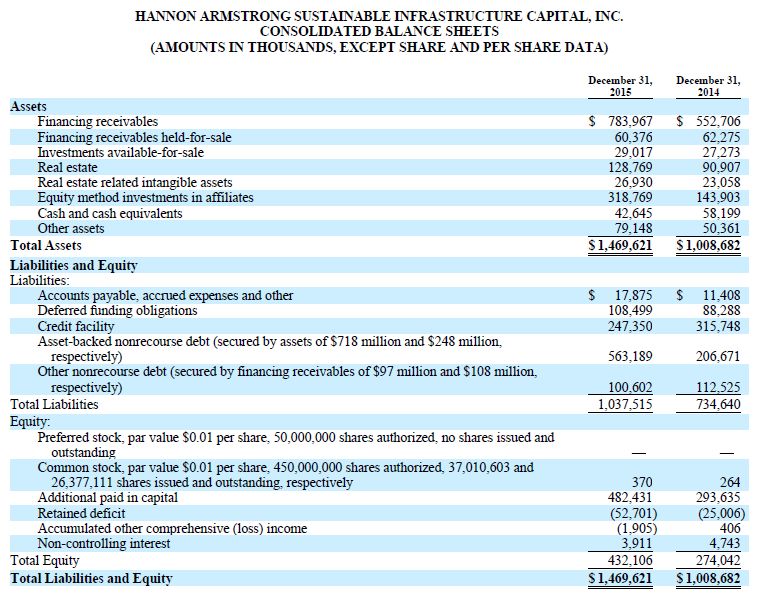
Portfolio / Credit Quality1
                                                                  Commercial
                                                     Commercial      Non-              Subtotal,
                                                     Investment   Investment        Debt and Real Equity Method
                                        Government     Grade        Grade              Estate      Investments                    Total
                                                                             ($ in millions)

Financing receivables                     $ 401         $ 383       $        —            $ 784              $      —           $ 784
Financing receivables held-for-sale            60            —               —                  60                  —                 60
Investments                                    —            16              13                 29                  —                  29
Real estate                                    —           156               —                156                  —                156
Equity method investments                      —            —                —                  —                319                319
Total                                     $ 461         $ 555        $       13        $ 1,029               $ 319           $ 1,348
% of Debt & Real Estate portfolio             45%         54%               1%             100%                  N/A                N/A
Average remaining balance/transaction     $    12         $ 9        $       13           $     10           $     27           $     12

                                                                     Diversified Portfolio,
              High Credit Quality
                                                                  With Over 105 Transactions

                                                                      1   See Supplemental Financial Information on Slide 14 for footnotes   10
Positioned for Higher Interest Rates
Assets ($ in millions)
Financing receivables & investments $ 873 • 59% of portfolio is fixed-rate debt
investments
Real estate 156 • Remaining 41% consists of floating rate
Strong debt, equity method investments and real
Equity method investments 319 Portfolio estate
• New assets originated at current rates
Cash 43 • Asset side of B/S similar to a bond ladder
Other 79
Total Assets $ 1,470
Liabilities and Equity
• 71% Fixed debt; target is 50 – 70%
Credit facility $ 247 • 2.1 to 1 Leverage; target is 2.5 to 1
Conservative • 25 bps increase in LIBOR would increase
Nonrecourse debt 563 Leverage quarterly interest expense by $0.2
million, or less than $0.01 per share
Other nonrecourse debt 101
Other 127
Total Liabilities 1,038
Total Equity 432 • Hannon Employees: ≈6%
High Quality • Institutional Ownership: >70%
Total Liabilities and Equity $ 1,470 Shareholders1 • Public Float: ≈94%
On average over the last three years, approximately 80% of dividends treated as return of capital
due to available tax attributes
1 Bloomberg data as of 2/25/16; Management calculations 11Capitalization Strategy
• Diversify lenders and expand both on balance sheet and off balance sheet financing
• Maintain fixed rate range of 50% to 70% and leverage target of 2.5 to 1
• Raise additional equity, when required, 20161
through ATM and follow-ons
20151
Fixed-Rate Debt
Fixed-Rate Debt
$650m Total
20141
BAML Facility
Fixed-Rate Debt $1.5b Capacity
BAML Facility
20131 $320m Total
$1.5b Capacity
Equity
Fixed-Rate Debt Potential 2016 issuance
$260m Total BAML Facility
$1.35b Capacity
BAML Facility
$700m Capacity
Equity Equity
$478m total $478m total
Equity
Equity $296m total
$167m Raised at IPO
1
12
Illustrative; not to scaleHannon Armstrong: Different by Design
• Long-term cash flows provide stable dividend
Yield • Preferred returns minimize commodity, resource variability
• Over 105 Investments
Portfolio • Multiple customer segments and technologies
Good • Industry leader in environmental disclosure
Governance • Internally managed, LTIP aligned with shareholders
13Supplemental Financial Data
EXPLANATORY NOTES
Non-GAAP Financial Measures
Core Earnings
Core Total Revenue, Core Total Investment Revenue, net of investment interest expense and provision, Core Other Expenses, net and Core Earnings ("Core Financial Metrics") are non-GAAP financial measures. Core Total Revenue reflects the wind equity investments
adjusted to an effective interest method and the-add back of non-cash real estate intangible amortization and the provision for credit losses, if any.
Our equity method investments in the wind projects are structured using typical wind partnership "flip" structures where we, along with other institutional investors, if any, receive a pre-negotiated preferred return consisting of priority distributions from the project cash
flows along with tax attributes. Once this preferred return is achieved, the partnership flips and the wind energy company, which operates the project, receives the majority of the cash flows through its equity interests with the institutional investors retaining an ongoing
residual interest. Given this structure, we negotiated our purchase price of our wind investments based on our assessment of the expected cash flows from each investment discounted back to net present value based on a discount rate that represented an expected yield
on the investment. This is similar to how we value the expected cash flows in financing receivables. Under U.S. GAAP, we are required to account for these investments utilizing the hypothetical liquidation at book value method ("HLBV"), in which we recognize income or
loss based on the change in the amount each partner would receive if the assets were liquidated at book value, in this case, at the end of the immediately preceding quarter after adjusting for any distributions or contributions made during such quarter. As HLBV
incorporates non-cash items, such as depreciation, and because we are entitled to receive a preferred return of cash flows on our investments independent of how profits and losses are allocated, the HLBV allocation does not, in our opinion, reflect the economics of our
investments. As a result, and in an attempt to treat these investments in a manner similar to our other investments and our initial valuation, in calculating our Core Total Revenue for the above periods, we adjusted the income we receive from these investments as if we
were recognizing income or loss based on an effective interest methodology. Generally, under this methodology income is recognized over the life of the asset using a constant effective yield. The initial constant effective yield we selected is equal to the discount rates
we used in making our investment decisions. On at least a quarterly basis, we will review and, if appropriate, adjust the discount rates and the income or loss we receive from these investments for purposes of calculating our Core Total Revenue in future periods, as
necessary, to reflect changes in both actual cash flows received and our estimates of the future cash flows from the projects. Our allocation of profits and losses is projected to change in 2019 in our transactions with JPMorgan Chase & Co. ("JPMorgan"), which is
expected to result in an increase of the amount of HLBV profits or losses allocated to us. In June 2015, JPMorgan and one of the project holding companies entered into an agreement regarding the treatment of certain tax matters that had the impact of reducing our
expected future cash flows from that holding company. As a result of this agreement, JPMorgan paid us approximately $3 million, which effectively reduced our investment in that entity. In accordance with the methodology described above, we have calculated a new
constant effective yield based upon the reduced investment amount and the reduction in expected future cash flows. We used this new effective yield, which is not materially different from our initial constant effective yield, beginning with the quarter ended September
30, 2015.
We have borrowed approximately $234 million on a nonrecourse basis using our equity method investments as collateral. Included in our U.S. GAAP investment interest expense for the year ended December 31, 2015, was approximately $7 million of interest
expense related to these nonrecourse loans. For the year ended December 31, 2015, we collected cash distributions from our wind investments of approximately $25 million (in addition to the $3 million payment), of which $13 million represents our Core Earnings
adjustment for these investments based upon the effective yield methodology discussed above.
Core Other Expenses, net reflects the add back of non-cash equity-based compensation, amortization of intangible assets, GAAP HLBV income or loss on our equity method investments, and business acquisition costs, if any. Core Earnings represent earnings utilizing the
adjustments for Core Total Revenue and Core Other Expenses, net and adjusting for any non-cash taxes and the minority interest. Our Core Financial Metrics are also adjusted to exclude one-time events pursuant to changes in GAAP and certain other non-cash charges,
if any, as approved by a majority of our independent directors.
We believe that the Core Financial Metrics provide additional measures of our core operating performance by eliminating the impact of certain non-cash income and expenses and facilitating a comparison of our financial results to those of other comparable REITs with
fewer or no non-cash charges and a comparison of our operating results from period to period. Our management uses Core Financial Metrics in this way. We believe that our investors also use our Core Financial Metrics or a comparable supplemental performance
measure to evaluate and compare our performance to our peers, and as such, we believe that the disclosure of our Core Financial Metrics is useful to our investors.
Core Earnings does not represent cash generated from operating activities in accordance with GAAP and should not be considered as an alternative to net income (determined in accordance with GAAP), or an indication of our cash flows from operating activities
(determined in accordance with GAAP), a measure of our liquidity or an indication of funds available to fund our cash needs, including our ability to make cash distributions. In addition, our methodology for calculating our Core Financial Metrics may differ from the
methodologies employed by other REITs to calculate the same or similar supplemental performance measures, and accordingly, our reported Core Earnings may not be comparable to the Core Earnings reported by other REITs.
Portfolio/Credit Quality Footnotes
• “Government” – Transactions where the ultimate obligor is the U.S. federal government or state or local governments where the obligors are rated investment grade (either by an independent rating agency or based upon our internal credit analysis). This amount
includes $297 million of U.S. federal government transactions and $164 million of transactions where the ultimate obligors are state or local governments. Transactions may have guaranties of energy savings from third party service providers, the majority of
which are entities rated investment grade by an independent rating agency.
• “Commercial Investment Grade” – Transactions where the projects or the ultimate obligors are commercial entities, including institutions such as hospitals or universities, that have been rated investment grade (either by an independent rating agency or based on
our internal credit analysis). Of this total, $12 million of the transactions have been rated investment grade by an independent rating agency. Commercial investment grade financing receivables include $175 million of internally rated residential solar loans
where the cash flows which support our financing receivables are subordinated to the tax equity investors (whose return is largely derived from the renewable energy tax incentives) and for which we rely on certain tax related indemnities of the publicly traded
residential solar provider.
• “Commercial Non-Investment Grade” – Transactions where the projects or the ultimate obligors are commercial entities, including institutions such as hospitals or universities, that have ratings below investment grade (either by an independent rating agency or using
our internal credit analysis).
• “Equity Method Investment” – Consists of minority ownership interest in operating wind projects in which we earn a preferred return.
• “Real Estate” - Includes the real estate and the lease intangible assets through which we receive scheduled lease payments, typically under long-term triple net lease agreements.
• “Average Remaining Balance” – Excludes 77 transactions each with outstanding balances that are less than $1 million and that in the aggregate total $26 million.
May 2013 14 14Core Earnings
We calculated our Core Earnings and provided a reconciliation of our net income to Core Earnings for the three months and yea
ended December 31, 2015 and 2014, respectively, in the table below:
15Core Adjustments
The table below provides a reconciliation of the GAAP Total Revenue, to Core Total Revenue:
The table below provides a reconciliation of the GAAP Other Expenses, net to Core Other Expenses, net:
16Income Statement
17Balance Sheet
18Energy Efficiency Project Examples
Federal Facilities in the Mid-West $16.7 8,978 Metric Tons
Million Annual Reduction in
14 different energy efficiency CO2 Emissions
improvements implemented in 44
buildings across two federal facilities in
the mid-western U.S.
Mid-Atlantic Public School System $25.0 7,410 Metric Tons
Million Annual Reduction in
17 energy efficiency improvements, CO2 Emissions
including lighting, energy management
systems and HVAC upgrades implemented
in 29 mid-atlantic public schools
V.A. Medical Center $7.7 1,500 Metric Tons
Million Annual Reduction in
6 energy efficiency improvements CO2 Emissions
including, chiller plant upgrades, lighting
upgrades, window film installation, and
steam distribution upgrades at a V.A.
Medical Center in California
19Renewable Energy Project Examples
Residential Solar Leases $86.5 19,459 Metric Tons
Million Annual Reduction in
Hannon Armstrong provided non-recourse CO2 Emissions
debt to SunPower to help finance its
residential solar lease program
Wind Equity Investment $144 87,831 Metric Tons
Million Annual Reduction in
Wind investment covers 10 projects, in CO2 Emissions
five states, representing over 1,200
megawatts (MW) of gross generating
capacity
Solar Land Investment $12.0 1,343 Metric Tons
Million Annual Reduction in
Hannon Armstrong acquires land under CO2 Emissions
60 megawatt solar farm owned by First
Solar in Fresno County, CA. Electrical
output to be sold to Pacific Gas & Electric
under a 20-year Power Purchase
Agreement
20For more information, please visit our website at
www.hannonarmstrong.com
Or contact Investor Relations directly at
410-571-6189
investors@hannonarmstrong.com
Securities are offered by Hannon Armstrong Securities, LLC, a registered broker dealer, member FINRA and SIPC and subsidiary of Hannon Armstrong Sustainable Infrastructure Capital, Inc. 21You can also read