Investor Presentation - September 2018 - Power Corporation du Canada
←
→
Page content transcription
If your browser does not render page correctly, please read the page content below

Investor
Presentation
September 2018

Forward looking statements
 In the course of today’s meeting, officers of the            By its nature, this information is subject to inherent         including management’s perceptions of historical
 Corporation may make, in their remarks or in response        risks and uncertainties that may be general or specific        trends, current conditions and expected future
 to questions, and the accompanying materials may             and which give rise to the possibility that expectations,      developments, as well as other considerations that are
 include, statements containing forward-looking               forecasts, predictions, projections or conclusions will        believed to be appropriate in the circumstances,
 information.                                                 not prove to be accurate, that assumptions may not be          including that the list of factors in the previous
 Certain statements, other than statements of historical      correct and that objectives, strategic goals and               paragraph, collectively, are not expected to have a
 fact, are forward-looking statements based on certain        priorities will not be achieved. A variety of factors,         material impact on the Corporation and its subsidiaries.
 assumptions and reflect the Corporation’s current            many of which are beyond the Corporation’s and its             While the Corporation considers these assumptions to
 expectations, or with respect to disclosure regarding        subsidiaries’ control, affect the operations,                  be reasonable based on information currently available
 the Corporation’s public subsidiaries, reflect such          performance and results of the Corporation and its             to management, they may prove to be incorrect.
 subsidiaries’ disclosed current expectations. Forward-       subsidiaries and their businesses, and could cause             Other than as specifically required by applicable
 looking statements are provided for the purposes of          actual results to differ materially from current               Canadian law, the Corporation undertakes no
 assisting the listener/reader in understanding the           expectations of estimated or anticipated events or             obligation to update any forward-looking statement to
 Corporation’s financial performance, financial position      results. These factors include, but are not limited to:        reflect events or circumstances after the date on which
 and cash flows as at and for the periods ended on            the impact or unanticipated impact of general                  such statement is made, or to reflect the occurrence of
 certain dates and to present information about               economic, political and market factors in North America        unanticipated events, whether as a result of new
 management’s current expectations and plans relating         and internationally, fluctuations in interest, inflation and   information, future events or results, or otherwise.
 to the future and the listener/reader is cautioned that      foreign exchange rates, monetary policies, business            Additional information about the risks and uncertainties
 such statements may not be appropriate for other             investment and the health of local and global equity           of the Corporation’s business and material factors or
 purposes. These statements may include, without              and capital markets, management of market liquidity            assumptions on which information contained in
 limitation, statements regarding the operations,             and funding risks, risks related to investments in             forward-looking statements is based is provided in its
 business, financial condition, expected financial            private companies and illiquid securities, risks               disclosure materials, including its most recent
 results, performance, prospects, opportunities,              associated with financial instruments, changes in              Management’s Discussion and Analysis and its most
 priorities, targets, goals, ongoing objectives, strategies   accounting policies and methods used to report                 recent Annual Information Form, filed with the
 and outlook of the Corporation and its subsidiaries, as      financial condition (including uncertainties associated        securities regulatory authorities in Canada and
 well as the outlook for North American and                   with significant judgments, estimates and                      available at www.sedar.com.
 international economies for the current fiscal year and      assumptions), the effect of applying future accounting         Certain financial terms which may be included in
 subsequent periods. Forward-looking statements               changes, business competition, operational and                 statements today or in the accompanying materials,
 include statements that are predictive in nature,            reputational risks, technological changes, cybersecurity       such as adjusted net earnings, are non-IFRS financial
 depend upon or refer to future events or conditions, or      risks, changes in government regulation and                    measures that do not have a standard meaning and
 include words such as “expects”, “anticipates”, “plans”,     legislation, changes in tax laws, unexpected judicial or       may not be comparable to similar measures used by
 “believes”, “estimates”, “seeks”, “intends”, “targets”,      regulatory proceedings, catastrophic events, the               other entities. Please refer to the Corporation’s annual
 “projects”, “forecasts” or negative versions thereof and     Corporation’s and its subsidiaries’ ability to complete        and most recent interim Management’s Discussion and
 other similar expressions, or future or conditional verbs    strategic transactions, integrate acquisitions and             Analysis for more information, including how such
 such as “may”, “will”, “should”, “would” and “could”.        implement other growth strategies, and the                     measures are defined, an explanation of their purpose
                                                              Corporation’s and its subsidiaries’ success in                 and a reconciliation of these non-IFRS measures to
                                                              anticipating and managing the foregoing factors.               results reported in accordance with IFRS, where
                                                              The listener/reader is cautioned to consider these and         comparable IFRS measures exist.
                                                              other factors, uncertainties and potential events
                                                              carefully and not to put undue reliance on forward-
                                                              looking statements. Information contained in forward-
                                                              looking statements is based upon certain material
                                                              assumptions that were applied in drawing a conclusion
                                                              or making a forecast or projection,

                                                                                                                                                                                        2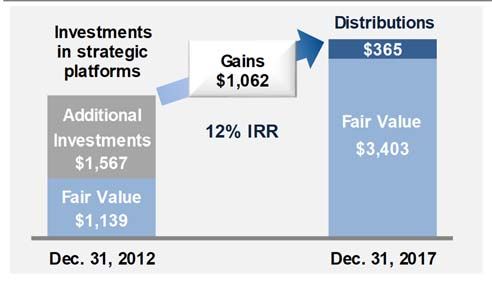
Forward looking statements
All financial information and market data are in Canadian Dollar (C$) as at June 30, 2018, except otherwise noted, with the following abbreviations: millions (M); billions (B).

Change in Accounting Policy
Effective January 1, 2013, the Corporation adopted revised IAS 19 (IAS 19R), Employee Benefits. In accordance with the required transitional provisions, the Corporation
retrospectively applied the revised standard. The 2012 comparative financial information in this report has been restated accordingly.

Non-IFRS Financial Measures
In analyzing the financial results of the Corporation and consistent with the presentation in previous years, net earnings are subdivided into the following components:
• adjusted net earnings attributable to participating shareholders; and
• other items, which include the after-tax impact of any item that in management’s judgment would make the period-over-period comparison of results from operations less
    meaningful. Other items include the Corporation’s share of items presented as Other items by a subsidiary or a jointly controlled corporation.
Management uses these financial measures in its presentation and analysis of the financial performance of Power Corporation, and believes that they provide additional
meaningful information to readers in their analysis of the results of the Corporation. Adjusted net earnings, as defined by the Corporation, assist the reader in comparing the
current period’s results to those of previous periods as items that are not considered to be part of ongoing activities are excluded from this non-IFRS measure.
Adjusted net earnings attributable to participating shareholders and adjusted net earnings per share are non-IFRS financial measures that do not have a standard meaning
and may not be comparable to similar measures used by other entities.

Abbreviations
Canada Life                        The Canada Life Assurance Company                           Pargesa                               Pargesa Holding SA
China AMC                          China Asset Management Co., Ltd                             Parjointco                            Parjointco N.V.
Eagle Creek                        Eagle Creek Renewable Energy, LLC                           Portag3                               Portag3 Ventures Limited Partnership
GBL                                Groupe Bruxelles Lambert                                    Potentia or Potentia Renewables       Potentia Renewables Inc.
Great-West Financial or            Great-West Life & Annuity Insurance Company                 PCC                                   Power Corporation of Canada
   Great-West Life & Annuity                                                                   Power Energy                          Power Energy Corporation
Great-West Life                    The Great-West Life Assurance Company                       Power Financial                       Power Financial Corporation
IFRS                               International Financial Reporting Standards                 Putnam                                Putnam Investments, LLC
IGM or IGM Financial               IGM Financial Inc.                                          Sagard Investment Funds               Sagard Europe, Sagard Holdings and
Investors Group                    Investors Group Inc.                                                                               Sagard China
Irish Life                         Irish Life Group Limited                                    Sagard Holdings                       Sagard Holdings ULC
Lifeco                             Great-West Lifeco Inc.                                      Square Victoria Communications        Square Victoria Communications
London Life                        London Life Insurance Company                                Group or SVCG                         Group Inc.
La Presse                          La Presse, ltée                                             Wealthsimple                          Wealthsimple Financial Corp.
Lion                               The Lion Electric Co.
Lumenpulse                         Lumenpulse Group Inc.
Mackenzie or Mackenzie             Mackenzie Financial Corporation
   Investments

                                                                                                                                                                                   3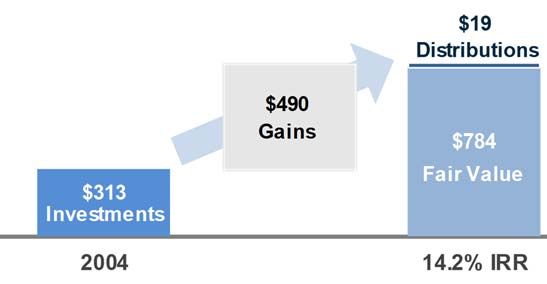
Group overview

                                                            Anchored by its core investment in Power Financial, its value creation strategy is
                                                            designed to capitalize on its long term relationships. Controlled since 1968 by the
                                                            Desmarais family
                                                             MARKET                          DIVIDEND                    INVESTMENT PLATFORM
                                                             CAPITALIZATION                  YIELD                       VALUE(1)
                                                             $12.3B                          5.2%                        $3.7B

                65.5%                                           27.8%(2)                                       100%(3)                                         100%

                                                                                                      Sagard Investment                                   Power Energy
                                                                                                           Funds                                           Corporation

                         MARKET                       Leveraging expertise in                             Achieving superior                         Benefiting from stable
       $22.0B            CAPITALIZATION
                                                      asset management and                            investment returns with                       and growing cash flows
                                                          distribution while                           the Sagard investment                        generated by renewable
                                                       participating in the fast                        platforms operating in                        energy investments
                                                       growing China market                                 three principle
                                                     through our investment in                               geographies
                                                             China AMC                                                                                                     (4)

(1)   Includes Sagard Europe, Sagard Holdings, and Sagard China at fair value, China AMC and Power Energy Corporation at book value, and third party investment funds and other.
(2)   Including IGM’s 13.9% ownership
(3)   Interests in Sagard Europe funds II and III are respectively 22.0%, and 37.3%
(4)   Ontario Power Generation announced on August 8th 2018 an agreement to acquire Eagle Creek, closing subject to standard U.S. regulatory approvals

                                                                                                                                                                                   4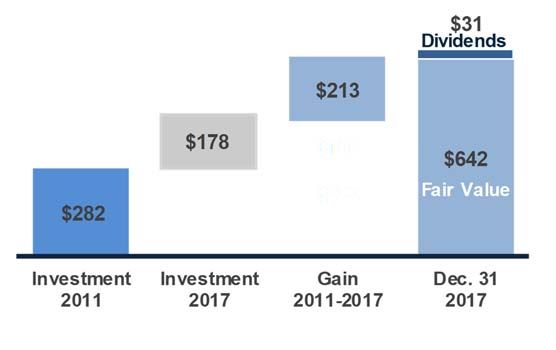
Key principles to achieve long-term value creation
Key Principles
Long-term perspective
Leading franchises with attractive growth profiles
Strong governance oversight
Prudent approach to risk management
To Achieve
Sound long-term investment diversification
Sustainable long-term value creation for our shareholders
5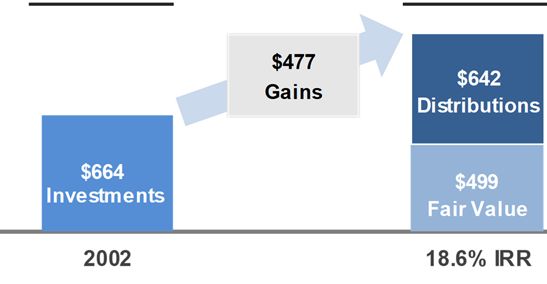
Value creation over the long term

         Value of $100 Invested(1)                             Dividend per Share(2)              30-Year TSR(1)

                                                                                                                 11.4%
                                      $2,518                                 $1.53
                                                                                           9.8%

                                                                                                        7.4%
                 11.4%                                            8.0%
                 CAGR                                             CAGR

                                                               $0.15
            $100

            1988                       2018                    1988          2018         S&P TSX      S&P TSX     PCC
                                                                                       Life & Health

(1) Assumes dividend reinvested, pre-tax
(2) Annualized
Note: Metrics as at June 30; 30-year TSR as at June 30, 2018

                                                                                                                         6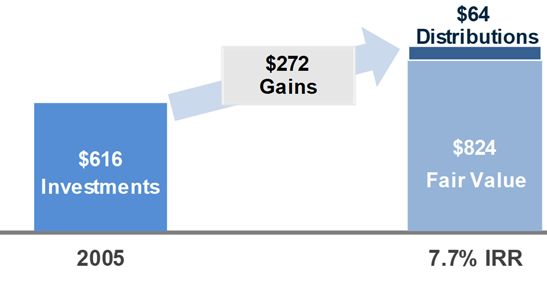
Long-term relationships – a cornerstone of Power’s value creation
Power has been building investment platforms that leverage our unique long term
relationships and partnerships
Strong local partners cultivated over decades of collaboration
PCC and CITIC made their first investment together in 1986. The
relationship was established by Paul Desmarais Sr. and
subsequently developed by André Desmarais
Multiple investments have been made together, the most recent
being the 27.8% interest in China AMC
Frère Group A partnership originally formed in 1981, and formalized in 1990,
which has focused on investment opportunities in European based
companies
Through GBL, meaningful positions are established which provide
opportunities to influence value creation through representation on
the boards of the companies in the portfolio
Sagard investment funds leverage the partnerships and
relationships cultivated by PCC and PFC in their respective
geographies
7Long-term relationships – a cornerstone of Power’s value creation
In the new economy, the principles of collaboration and building trusted relationships
are being applied at initiatives in sustainable and renewable energy and Fintech
Renewable Energy Fintech
Renewable energy initiatives have been Our teams are working with our operating
guided by our own experience throughout companies to build out an “ecosystem” of
the globe augmented by the recruitment of experienced and best-in-class talent
recognized leaders in the field
Power Energy
8PCC investment platforms’ contributions to value creation
PCC has shifted from third party investing to building its own strategic investment platforms
FMV of all investments platforms has grown from $1.4B at Dec. 31, 2010 to $3.6B at Dec. 31, 2017
representing 20% of the PCC’s total NAV
Third party investments funds and other have decreased from $807M to $179M for the same period
Evolution of Investment Platforms(1)
Dec. 31, 2017 ($M)
$3,403 China AMC
(2)
Power Energy(2)
$2,608
$2,360
Sagard China
$1,610
Sagard Holdings
$1,431
$1,139
$957 Sagard Europe
$807
$859
$632 $661 $635 $666
$494
$411 Third party
$179 investment funds and
other (3)
2010 2011 2012 2013 2014 2015 2016 2017
$ Million
(1)(1) Strategic platforms
Strategic platforms include:
include: Sagard
Sagard Europe,
Europe, Sagard Sagard
Holdings,Holdings, Sagard
Sagard China, Pow erChina,
Energy Power Energy
and China and China
AMC. Value AMC funds represents the fair value of the
of the Sagard
investments
(2) Internal rateinoftheir platforms.
return ("IRR") is on a pre-tax basis, and in Canadian dollars.
(3)(2) Power
Pow er Energy
Energy reflected
reflectsatbook
book value
value
(3) Includes investment in CITIC w hich was sold in April 2015
(4) Includes investment in CITIC which was sold in April 2015
9China AMC, a leading asset manager in China
Market position
Formed in 1998, CAMC is an industry pioneer with a diversified Assets under Management
(2)
product shelf as well as a strong investment management and (RMB¥ billion as at Dec. 31)
distribution capabilities
• #1 brand
1,006
• #1 in exchange traded funds 864 870
• #1 in combined long-term mutual funds and institutional AUM
• Over 50 million customers 458
333
179 235
PCC initially acquired a 10% position in 2011, and in 2017 an
additional 3.9% concurrent with IGM’s acquisition of a 13.9% stake.
In aggregate, the PCC group holds a 27.8% position 2011 2012 2013 2014 2015 2016 2017
Strong growth profile
Dividends and Fair Value
China’s asset management industry has seen net new flows in
(C$M)
excess of 30% per annum in recent years(1)
China will account for nearly half of the global industry’s net new
flows to become the second largest asset management market in
the world by 2019. By 2030, China is expected to reach over USD
$17T in addressable AUM compared to 3.2T in 2017(1)
Potential to leverage the group’s extensive knowledge in wealth
management and distribution will lead to further cooperation with
China AMC
In June 2016, CAMC successfully launched a risk parity fund
advised by PanAgora, the first of its kind in China
(1) Casey Quirk Deloitte, 2017
(2) Excludes subsidiary assets under management.
10Building Sagard investment platforms
PCC has been actively building Sagard platforms, investing more than $1.5B over 15 years
PCC has received $725M of distributions since inception and the total fair value of PCC’s investment in the
three platforms was $2.1B at Dec. 31, 2017
Sagard platforms are managed locally with experienced investment professionals having in-depth knowledge of
the public and private markets.
They benefit from the Group’s ecosystem of investors, investment managers, and experts
Capital Committed
2002-2007 2008-2012 2013-2018
Financial crisis
2002 2006 2013 2016
(2)
Fund I Fund II Fund III
PCC €100M €154M €201M €101M
(1)
Third Party €435M €594M €203M €303M
Total €535M €748M €808M
2005 2013 2016 2017 2018
Credit Fund
PCC US$ 250M US$ 200M US$ 100M -
US$ 150M
Third Party US$ 160M US$ 200M
Total US$ 460M
2004 2010 2015
US$ 50M US$ 50M US$ 100M
(1) Third Party includes commitments of Pargesa and GBL (€50M in Sagard I, €150M in Sagard II, and €218M in Sagard 3)
(2) In Dec. 2016, Fund III size increased from €404M to €808M
11Sagard funds have generated substantial returns totaling $1.2B in gains
Investments
Since Inception ($ million) Dec. 31, 2017
Paris
Mid-sized private companies > €100M
Companies based in France, Belgium, Luxembourg and Switzerland
Seek to have control or significant influence Distributions
Superior management talent
High growth potential Investments Fair Value
New York
Invests in the equity and debt capital of middle-market
companies in the U.S. and Canada
Migrate successful investments with potential to
controlled-investments
Shanghai
Minority positions in Chinese and Hong-Kong publicly-listed
companies and American Depositary Receipts
Seeking absolute return with low volatility
Concentrated portfolio of stocks reflecting deep fundamental
analytic methodology
Note: internal rates of returns (“IRR”) are on a pre-tax basis, and in Canadian dollars.
12Power Energy
Power Energy invests in the sustainable and Total Invested Capital ($ million)
renewable energy sector with the goal of
654
building and owning, over the long-term,
companies that can generate growing and stable
cash flows
329
Power Energy invests in companies that can
benefit from the global energy transformation, 118
176
118
recent acquisitions include: 57
Lumenpulse - efficient lighting, and
2012 2013 2014 2015 2016 2017
Lion - electrification of transportation
Power Energy has invested $654M to date, and
is seeking an annual return of 12%
Power Energy
100% 32.9% 55.7% 43.8%
(1)
2012 2013 2017 2017
Developer, owner and operator Owner and operator Leading manufacturer Manufacturer
Solar systems powering 140MW and 64 small-scale hydroelectric High performance Electric school buses
pipeline of wind power across facilities in the U.S. for a total specification-grade LED
Canada and the Americas capacity of 220MW lighting solutions
(1) Ontario Power Generation announced on August 8th 2018 an agreement to acquire Eagle Creek, closing subject to standard U.S. regulatory approvals
13Prudent investment approach has resulted in resilient earnings
11% average annual growth in adjusted net earnings since end of financial crisis
ROE ranging from 9-13% for the same period, achieved through a changing economic and business
environment
Net earnings contribution from investment platforms has significantly grown in recent years
representing an average of 16% from 2013 to 2017
PCC Adjusted Net Earnings(1) (C$M)
1,800
1,573 1,560
1,600
1,400
1,238 1,223
1,200
1,039
957 959
1,000
872
800
600 508 670
2017
400 YTD
289
Q1
200
0
1996 2000 2005 2010 2013 2014 2015 2016 2017 2018 YTD
ROE (2) 9.7% 14.6% 16.6% 10.7% 10.0% 11.8% 13.1% 9.4% 11.8% 12.5%
Adjusted net earnings excl. Investment Platforms Investment platforms Series2
(1) Adjusted net earnings attributable to participating shareholders is a non-IFRS financial measure
(2) Based on adjusted net earnings attributable to participating shareholders
14Historical dividends and earnings per share
Dividends have grown by an annualized 5.3% during the period 2013 to 2018
PCC investments are expected to be growing contributors to earnings and dividend capacity as
they develop
Earnings and Dividend per Share
4.00
3.50 3.40 3.36
3.00
2.69 2.64
2.50 2.32
2.09 2.08
$ per share
2.00 1.88
1.50
1.50 1.41
1.32
1.16 1.16 1.16 1.22
1.15
1.00
0.65 1.44
0.48 Q1
0.50
0.29
0.19 Q2 Q2
0.00
1996 2000 2005 2010 2013 2014 2015 2016 2017 2018
(1) (2)
Dividend per share Adjusted net earnings per participating share
(1) Dividends based on both paid and declared basis. 2018 dividend assumes dividend paid in the fourth quarter will be unchanged
(2) Non-IFRS financial measure
15Appendix
16For further information on the companies in the Group:
www.powerfinancial.com www.chinaamc.com.hk/en/index
www.sagard.com/en www.sagardholdings.com ppcl.com.cn
www.potentiasolar.com www.eaglecreek.com www.lumenpulse.com www.thelionelectric.com
1750 years of growth and cycles
Early Days
Paul G. Desmarais acquired control of PCC and became Chairman and CEO.
1968 Initial focus is to consolidate control over a small number of companies and concentrate on
improving their performance and cash flow.
Core investments constituting the foundation of the Power Group:
• Investors Group (1970)
1968-81
• Great-West Life Assurance (1970)(1)
• Pargesa (1981)
Creation of Power Financial Corporation (“PFC”) to hold PCC financial services investments –
1984 Investors Group, Great-West Life, Montreal Trust and Pargesa (originally its holdings were focused on
financial services).
Consolidation
IPO - Investors Group
1986
Share offering - Great-West Lifeco
Sale of Consolidated Bathurst
1989
Sale of Montreal Trust.
1990 Agreement with the Frere Group of Belgium to acquire majority interest in Pargesa and exercise co-control.
(1) Great-West Life was majority owned by Investors Group at the time of Power Corporation’s acquisition of Investors Group
1850 years of growth and cycles
Insurance Demutualization
1996 Paul Desmarais Jr. and André Desmarais appointed CO-CEOs of PCC.
1997 Great-West acquires London Life
2001 Investors Group acquires Mackenzie Financial
2002-2005 Launch of the Sagard funds (Europe – 2002, China – 2004, Holdings (US) – 2005)
2003 Great-West Lifeco acquires Canada Life
2007 Great-West Lifeco acquires Putnam
Post-Crisis: Changing Regulatory and Technological Environment
2011-2016 Acquisition of a 10% stake in China Asset Management Co. in 2011 and an additional 3.9% in 2016
2012 Launch of Power Energy
2013 Great-West Lifeco acquires Irish Life
2016 Launch of the Fintech initiative with the creation of Portag3
2018 La Presse transformed to a non-profit organization
19Conservative capital structure
Power Corporation’s prudent approach to managing leverage has contributed to
strong and stable credit ratings, throughout economic cycles
Power Corporation (“A”), Power Financial (“A+”), and Great-West Lifeco (“A+”) have had stable
S&P credit ratings since the acquisition of Canada Life in 2003
Q2 2018 $M Rate
4%
6%
2039 debenture $250 8.57%
Debt
2047 debenture 150 4.81%
2048 debenture 250 4.46%
Debt $650 6.12%
(1)
Series 1986 $13 2.42%
Preferred Shares
Series A 150 5.60%
90% Series B 200 5.35%
Series C 150 5.80%
Series D 250 5.00%
Series G 200 5.60%
Preferred shares $963 5.38%
Equity
4%
6% Participating
90% shareholders' equity $14,213
Capital structure
Equity Preferred Debt
Note: capital structure pro forma for the refinancing of the 2019 debentures.
(1) Floating rate associated with July 15, 2018 payment date.
20Net earnings and adjusted net earnings
(C$M) 1996 2000 2005 2010 2013 2014 2015 2016 2017
Net earnings 289 646 1,021 727 977 1,275 1,786 1,082 1,286
(1)
Other items :
Great-West Lifeco - - 29 96 (102) - - 20 223
IGM Financial - - - 9 4 29 10 (14) 51
Pargesa (22) (41) (7) - (25) (49) (61) 135 -
Other subsidiaries and Corporate (42) (97) (4) 125 105 (17) (162) - -
Adjusted net earnings 225 508 1,039 957 959 1,238 1,573 1,223 1,560
(1) Refer to Power Corporation 2017 annual report Management’s Discussion and Analysis for a description of other items: Great-West Lifeco page 29, IGM Financial page 31,
and Pargesa page 33.
21You can also read