FY 18 Results February 2019 - DIA Corporate
←
→
Page content transcription
If your browser does not render page correctly, please read the page content below

FY 18 Results
   February 2019

                   1
Legal disclaimer

This document does not constitute a purchase, sale or exchange of securities invitation or offer, nor does it constitute advice on any securities issued by DIA.

DIA cautions that this document contains forward-looking statements found in various places throughout the presentation and include, without limitation, estimates, projections
or forecasts relating to possible future trends and the performance of DIA. These forward-looking statements speak only as of the date on which they are made and the
information, knowledge and views available on the date on which they are made; such knowledge, information and views may change at any time. Forward-looking statements
may be identified by words such as "expects", "anticipates", "forecasts", "estimates" and similar expressions. Current and future analysts, brokers and investors must operate
only on the basis of their own judgment taking into account this disclaimer, and must bear in mind that these estimates, projections and forecasts do not imply any guarantee of
DIA's future performance and results, price, margins, exchange rates, or other events, which is why they do not constitute a guarantee of future compliance and are subject to
risks, uncertainties and other factors beyond DIA's control and may cause that the final results and outcome differ from those contained in said estimates, projections and
forecasts. In consequence, the future results and the real performance could differ substantially from these forecasts, projections and estimates.

The risks and uncertainties that could affect the information provided are very difficult to anticipate and predict. DIA does not assume the obligation of publicly reviewing or
updating these statements in case unforeseen changes or events occur which could affect these statements. DIA provides information on these and other factors that could
affect the business and the results in the documents it presents to the CNMV (Comisión Nacional del Mercado de Valores) in Spain. This information is subject to, and must be
read in conjunction with, all other publicly available information.

Accordingly, these estimates, projections and forecasts must not be taken as a guarantee of future results, and the directors are not responsible for any possible deviation that
could arise in terms of the different factors that influence the future performance of the company. Neither the company, its directors, nor its representatives shall have any
liability whatsoever for any loss arising from any use of this document or its contents, or otherwise arising in connection with this document.

This document contains some expressions (gross sales under banner, comparable growth of gross sales under banner, adjusted EBITDA, adjusted EBIT, etc.) which are not IFRS
(International Financial Reporting Standards) measures.

In addition, it is stated that the present document may contain confidential information which may be also considered inside information, which is why the recipient of the same
shall assess such circumstance and comply, where applicable, with applicable obligations under market abuse regulations.

                                                                                                                                                                                    2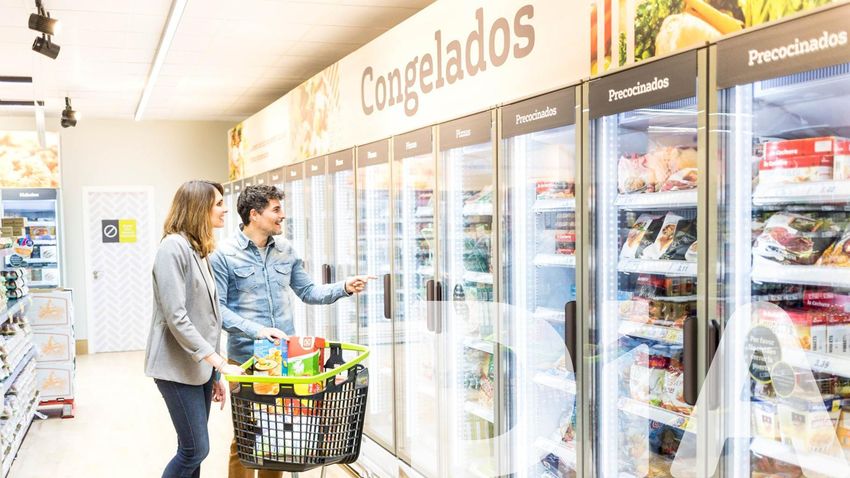
Today’s speakers

                Borja de la Cierva                         Enrique Weickert                              María Miralles
                                                                                                         Chief Transformation
                 Chief Executive Officer                    Chief Financial Officer
                                                                                                                Officer
                 >30 years of experience                   >20 years of experience
                                                                                                        16 years of experience

• Appointed BoD member in September        • Appointed CFO in December 2018           • Appointed CTO in January 2019
  2016 and CEO in December 2018            • Relevant management experience: CFO      • Relevant experience in retail: retail
• Relevant experience in retail: Supply      of OHL Group, CFO                          sector partner at Oliver Wyman for the
  Chain Manager of El Corte Ingles, CFO      of Fertiberia                              last 13 years (experience in
  of Inditex                               • Started his career working 9 years at      transformation processes in Europe,
• Started his career working 9 years at      Arthur Andersen / Deloitte                 North American and Latin America)
  Arthur Andersen                          • Holds a degree in Business               • Previous experience at DIA as a
• Holds a degree in Business                 Administration and is a chartered          consultant since 2016
  Administration and is a chartered          accountant                               • Holds a MEng in Agricultural
  accountant                                                                            engineering

                                                                                                                                 3
DIA at a glance
                                                                                                                   #1 Spanish convenience network
                                                                                                                   >2.1x larger than #2 competitor 1

                        Deep expertise in private label                                                                                                                                                     Well-diversified footprint
                                                                                                                                                                                                            Serving all principal customer missions
     >45% private label penetration in Spain                      1
                                                                                                                                                                                                            under DIA, La Plaza and DIA&Go banners

                                      Loyal customer base
                                                                                                                                                                                      €                     EUR7.3Bn in net sales
   ~74% sales group wide through Club DIA card                                                                                                                                                              A leading proximity retailer in its 4 countries 5

                                                                                                                                                                                                            Unique asset-light model
                       Online sales growing at          37%                                                                                                                                                 Franchisee owned and/or operated stores
     >10% market share of omnichannel market 2                                                                                                                                                              represent 58% of Group’s stores

                                                                                                                   A leading European franchiser

                                                                                                                   #1 franchiser in Spain , #2 franchiser in food retail in Europe
                                                                                                                                                     3                                                       4

                                                                                                                   and Top 25 franchiser worldwide 4
Source: DIA, Nielsen

Notes: 2018 Figures; Store numbers exclude Clarel and Cash & Carry                                      3.   Based on number of stores this includes retailers with a value market share larger than 3.5%
1.   Defined as gross sales of private label products divided by total gross sales in Spain excluding   4.   Top 100 global franchises (Franchise Direct)
     perishable food                                                                                    5.   Spain, Portugal, Argentina & Brazil
2.   Based on market share of DIA Plaza in the omnichannel in Spain, YTD 2018 excluding December

                                                                                                                                                                                                                                                                4
Index

        01 Financial review    6

        02 Strategy update    14

        03 Conclusions        25

        04 Appendix           28

                               5
01
Financial Review
Sales performance
 EURm                            • -40.3% Euro/Argentinian Peso
                                 • -16.2% Euro/Brazilian Real

Gross Sales Under Banner                                          Net Sales

    Change    -3.6%    +2.7%     -14.0%         -14.9%                                             +842.0     -36.5
                                                                                                                       -1,538.6

   11,040.7   -397.5                                               8,217.5    -161.3
                       +298.1   -1,551.1                                                -34.4

                                               9,390.2                                                                             7,288.7

   FY 2017     LFL     Space    FX Effect      FY 2018             FY 2017    Spain    Portugal   Argentina   Brazil   FX Effect   FY 2018

                                                                                                                                             7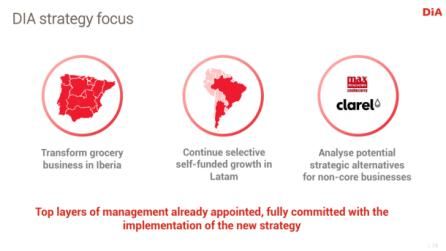
Adjusted EBITDA
EURm
                             Organic adj. EBITDA
                                   -105.8

518.5     -95.9
                   -12.1        +8.1      -5.9      -38.6
                                                                 -36.2                   +36.2          +11.3        385.4
                                                                             337.9
                                                                                                                               EUR350-400m
                                                                                                                               target achieved

FY 2017   Spain   Portugal    Argentina   Brazil   FX effect      IAS29      FY 2018      IAS29      Discontinuing   FY 2018
                                                               (Argentina)             (Argentina)     operations

                                                                                                                                         8
FY 2018 results summary
2018 2018 2017 Var Var
EURm As Reported Impairment Adjusted Re-expressed (%) (EURm)
NET SALES 7,288.7 7,288.7 8,217.5 -11% -928.7
Adjusted EBITDA 1 337.9 337.9 2 518.5 -35% -180.6
Other cash items -91.9 -91.9 -47.5 93% -44.3
EBITDA 246.0 0.0 246.0 470.9 -48% -224.9
D&A -235.2 -235.2 -223.7 5% -11.5
Impairment of Assets -79.9 79.9 0.0 -12.1 -100% 12.1
Losses on disposal of Assets -25.4 -25.4 -17.2 48% -8.2
EBIT -94.5 79.9 -14.6 218.0 -107% -232.6
Net financial result -84.9 -84.9 -53.3 59% -31.6
Gain from net monetary position 67.5 67.5 0.0 67.5
EBT -111.9 79.9 -32.0 164.7 -119% -196.7
Income Tax -16.4 -16.4 -52.0 -68% 35.6
Impairment of DTAs -170.5 170.5 0.0 0.0 0.0
Consolidated Profit -298.9 250.4 -48.4 112.7 -143% -161.1
Discontinuing Operations -15.7 -15.7 -11.5 37% -4.2
Impairment Discont.Op. (Clarel) -38.0 38.0 0.0 0.0 0.0
Net Attributable Profit -352.6 288.4 -64.2 101.2 -163% -165.3
Net Underlying Profit 49.7 0.0 49.7 191.3 -74% -141.7
Note:
1. Adjusted by other cash items
2. Not including 11,3 m of Clarel and Max Descuento
9Change in net debt
EURm
+12.8 1,451.6
+86.3 +18.8
+110.3
+274.1
945.4 -337.9 +343.8 -93.9
+91.9
FY 2017 Adj. EBITDA Other cash Capex Divestments TWC Dividends Net Taxes FX & FY 2018
items (cash) financial result paid other
10Three distinct phases in our performance as an independent company
2011 2015 2016 2017 2018 “End 2018+”
Growth and M&A Loss of focus on execution Refocus on execution: our new strategy
Avg. net rollout:
+221 p.a.
Stores (000s) 6.8 7.7 6.2 6.1 6.2
Avg. LfL:
1.9%
LfL (%) 1.8 1.3% 1.2 (4.9) (3.6)
Avg. Leverage:
1.2x
Leverage (x) 1.0 1.9 1.6 1.8 3.8 2
1,200 6.8
5.7 1,200 6.7 6.3
900 5.1
610 900
558
Profitability: 600 562 519
600 374
Adj. EBITDA 1 (EURm)
300 300
0 0
2011 2015 2016 2017 2018
Adj. EBITDA Margin % Adj. EBITDA Margin %
Source: DIA
Notes: 2011 – 15 as reported, 2016 – 18 audited restated and re-expressed figures excluding Clarel and Cash & Carry, pre-IAS29
1. Defined as operating profit after adding back depreciation and amortization (including amortization related to the closing of stores and impairment of fixed assets), losses on write down of fixed assets, “Other cash items”
2. Based on Adjusted EBITDA pre IAS29 including discontinuation of Clarel of EUR385.4m. Defined as Net Debt / Adj. EBITDA
11What led to deterioration of performance in 2017 – 2018?
Highly competitive environment in Iberia
Profit warnings
Low franchisee support
Lower customer centricity Multiple changes in Board and
Management
Acquisition strategy
Too many formats Rating downgrades
Institutional focus on margins
Liquidity Constraints
Macroeconomic and FX headwinds in
LatAm
12Next steps: working towards a sustainable capital structure
Post Capital Increase Deleveraging
EURm, as of December 2018 2
• Indicative support from the syndicated facility
lenders for an extension of the final maturity of
the syndicated facilities post Rights Issue (EUR 3.8x 2.3x
765m) until March 2023
Debt
• The earlier pre-payment of up to EUR100m with
Refinancing the proceeds from non-core assets disposals 1,452
• Support based on a Head of Terms and subject to
certain conditions, including the completion of a
rights issue of EUR600m
893
+ • Rights issue of EUR600m
• To be underwritten by Morgan Stanley 1
Capital • Use of funds: deleveraging and capex
Increase Net Debt PF Net Debt
• Restores in a timely manner its net equity position FY 2018 Post Capital Increase 3
(EUR-166m consolidated equity at year-end 2018,
of which EUR-99m in the parent company)
Net Financial Debt / Adj. EBITDA (Adj. EBITDA EUR385.7m)
Source: DIA
Notes:
1. Subject to certain conditions
2. Based on Adjusted EBITDA (pre IAS 29) including discontinued operations of EUR385.4m
3. Assuming EUR600m capital increase (EUR558.2m net of related costs), but excluding refinancing adjustments
1302 Strategic Update
Grocery retail is changing rapidly
CONSUMER SEEK ENVIRONMENT EVOLVES COMPETITION ADAPTS
FREQUENTLY
MORE PRICE
FRESH & LOCAL
HEALTHY
VA L U E DIGITAL
VALUE
SOURCING SOFT DISCOUNT
CONVENIENCE
SOFT DISCOUN T
ACCELERATION
SERVICE
/ EVERY DAY LOW
DIGITAL
PRICE SMALLER / E V E R Y D A Y L O W P R I C E
RETHINKING OF
PRIVATE LABEL
PROMOTIONS FORMAT
SUPPLY CHAIN
CONSOLIDATION
IN CVP
DIFFERENTIATION
PRIVATE
SMALLER FORMAT
FRESH & HEALTHY L A B E L RETHINKING OF SMALLER
RETHINKING OF
VA L UE SERVICE
PRIVATE LABEL LESS EFFECTIVE PROMOTIONS LESS SUPPLY CHAIN FORMAT
SERVICE
SUPPLY CHAIN
ANALYTICS
ADVANCED
EFFECTIVE SOFT DISCOUNT / EVERY DAY LOW
FRESH & SMALLER BASKET,
CONVENIENCE
PRICE RETHINKING OF SUPPLY CHAIN
PRESSURE SOURCING
VA L U E
More in-store services
MORE FREQUENTLY CONSOLIDATION
HEALTHY A D V A N C E D A N A LY T I C S LOCAL
Experience
RETHINKING OF
Digitalisation
PARTNERSHIPS
AND ALLIANCES
PARTNERSHIPS
SOURCING
DIGITALADVANCED SUPPLY CHAIN
CONVENIENCE
EVERY DAY LOW PRICE
ANALYTICS SMALLER BASKET,
ACCELERATION PRICE SMALLER AND ALLIANCES
PRICE PRESSURE
SOURCING
LOCAL
SERVICE
VA L U E
FRESH &
SMALLER FORMAT
HEALTHY S MALLER PRESSURE FORMAT CONSOLIDATION
LOCAL
CONVENIENCE BASKET, ADVANCED ANALYTICS DIFFERENTIATION SMALLER
VALUE
SERVICE P R I VAT E
SERVICE
MORE FREQUENTLY IN CVP MORE IN-STOREFORMAT
analytics
advanced
FRESH & HEALTHY L A B E L consolidation SERVICES PARTNERSHIPS
LOCAL SOURCING
VA LUE Experience Digitalisation
a n d ALLIANCES
15Our mission
“Our ambition is to be the day-to-day
grocery retailer closest to our
customers; providing them with the
best value convenience through our
extensive omnichannel store network”
16Our structural advantages
We are close to our We have strong operational We manage capital
customers know-how efficiently
Our convenience focus We benefit from We keep a developed
provides exposure a large, loyal range of private label
to favorable and data-rich with over 2,000 SKUs in
consumption trends 2 customer base 4 Spain 6
1 Our unparalleled 3 We have historically solid 5 Our asset light franchise
capillarity in Spain gives relationships with our model enables us to
us a unique level of suppliers deliver high store
access to customers returns and industry-
leading margins
Source: DIA
17Transformation programme focused on Spain & Portugal and
supported by renewal of our culture
The new DIA
Spain & Portugal Brazil & Argentina
1 2 3 4
Transform our Reinvigorate our Re-engage with Re-focus on Focus on the
commercial estate and franchisees effective core
offer formats execution
5 Culture
Culture of openness and ROI-based
Focus on the customer Recruit the best talent
transparency performance incentives
181 Transform our commercial offer
$
Offer Price Perception
Rationalise assortment and space
Step-up Fresh offering with Invest in on-shelf prices while
via SKUs reduction aligning with
higher share and frequency reducing promotions
customer needs
Higher quality private label Personalised promotions driven Outstanding shopping experience
with continued innovation by customer insights driven by in-store services
Quality and Convenience at the Heart of Our Offer
192 Reinvigorate our estate and formats
Omnichannel ecosystem built around convenience: what
customers need, where they need it, when they need it Case study: DIA&Go
Brick
• 144 stores operating in 2018
• 75% of stores showing high and in-line
On-the- Grab,
go bag & go performance throughout the year 1
• >27% average sales growth throughout
Next Click &
Meal © Collect 2018 with consistent monthly
performance 1
• Average margins >28%, with similar
Stock-up Delivery
results delivered by both own and
franchised stores 1
Digital
Source: DIA Analysis
Notes
1. 84 comparable stores in 2018
203 Re-engage with franchisees
Review and upgrade franchisee Review the incentive Invest in franchisee training and Introduce new model of onboarding
portfolio system for existing and career planning with increased standards for new
new franchisees franchisees
We Invest in Our Franchisees on Equal Terms to Our Own Stores
214 Re-focus on effective execution
Re-engineer store Transform each link of
Modernise our backbone
operating model the supply chain
Upgrade the store labour model Refocus on servicing the stores Implement ZBB 1 + ZBO 2
Reduce operational complexity Review cost structure Review processes / ways of working
Implement advanced analytics across the
Optimise the store network Re-negotiate with suppliers
whole company
Launch the new store format New warehouse and delivery model Upgrade IT infrastructure
Group-wide change driven by the Transformation Management Office
Organisation alignment
Loss
+
Product Time
+ +
Control
and Inventory to Market Long-Term Driver for
Availability & Visibility
- - Effective Execution
Notes
1. Zero based budgeting
2. Zero based organisation
225 Renew and strengthen our company culture
$
Culture of openness and ROI-based performance
Focus on the customer Recruit the best talent
transparency incentives
Reinvigorated Corporate Leadership to Build the New DIA
María Miralles
Borja de la Cierva Previous Enrique Weickert Previous Previous
experience experience Chief Transformation experience
Chief Executive Officer Chief Financial Officer
Officer
>30 years of experience >20 years of experience
16 years of experience
23Our management team
Executive Committee
Borja de la Cierva Enrique Weickert
Chief Executive Officer Chief Financial Officer
32 Years of Experience 21 Years of Experience
María Miralles José Antonio Lombardía Faustino Dominguez de la Torre
Executive Director of Transformation Executive Director of Clients Executive Director Spain
16 Years of Experience 25 Years of Experience 28 Years of Experience
Pedro Barsanti Alejandro Grande Miguel Ángel Iglesias
Executive Director of IT Executive Director Company Secretary
25 Years of Experience Human Resources 29 Years of Experience
20 Years of Experience
Heads of Geographical Divisions
Marin Dokozic Faustino Domínguez de la Torre Damián Dircie Miguel Guinea
Executive Director Executive Director Executive Director Executive Director
Brazil Spain Argentina Portugal
20 Years of Experience 28 Years of Experience 20 Years of Experience 28 Years of Experience
Additional Management
Iván Martín Teresa Travesí Miren Sotomayor
Spain Operations Director Customer Insights Director Reporting and Control Director
17 Years of Experience 28 Years of Experience 19 Years of Experience
Position Covered Externally Position Covered Internally Previous Experience
Source: DIA
2403 Conclusions
A clear vision of the transformed company
DIA has historically We have Our transformation We have a clear
performed but recently multiple structural plan is focused on strategy to build the
went through a advantages execution new DIA
setback
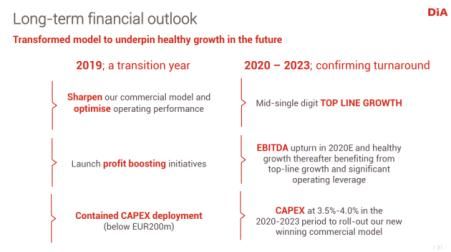
26Reconfirmation of the outlook for DIA
2018 2019 2020 – 2023
Reset A Transition Year Completion of Turnaround
We guided towards: Sharpen our commercial model Mid-single digit top-line growth
Adj. EBITDA of
EUR350 – 400m EBITDA upturn in 2020E and
Refocus on effective execution
(before IAS29) healthy growth thereafter
Capex: EUR350m CAPEX at 3%-4% in 2020-2023 to
Prudently deploy CAPEX roll-out our new commercial model
and build the New DIA
Transformed model to underpin future growth
2704 Appendix
Gross sales under banner by country

EURm           FY 2017       %    FY 2018       %    Change    FX effect Change (ex-FX)

Spain          5,275.1    47.8%   5,147.7    54.8%    (2.4%)      0.0%           (2.4%)

Portugal         834.4     7.6%     808.4     8.6%    (3.1%)      0.0%           (3.1%)

Argentina      2,934.1    26.6%   1,794.5    19.1%   (38.8%)    (41.8%)           3.0%

Brazil         1,997.1    18.1%   1,639.6    17.5%   (17.9%)    (16.1%)          (1.8%)

TOTAL DIA     11,040.7   100.0%   9,390.2   100.0%   (14.9%)    (14.0%)         (0.9%)

                                                                                      29
Currency performance
(%)
6.5
(7.4)
(12.2) (12.0)
(16.1) (17.5) (16.2)
(19.7) (19.0)
(30.9)
(37.5)
(40.3)
(44.0)
(51.2)
Q4 2017 FY 2017 Q1 2018 Q2 2018 Q3 2018 Q4 2018 FY 2018
EUR/ARP EUR/BRL
Source: Bloomberg average currency rates (a negative change in exchange rates implies a depreciation versus the Euro)
30Gross sales under banner & adjusted EBITDA by segment
FY 2017 Gross sales under banner FY 2018 Gross sales under banner
18.1% 17.5%
47.8%
54.8%
19.1%
26.6%
8.6%
7.6%
FY 2017 adjusted EBITDA FY 2018 adjusted EBITDA
13.1% 16.0%
0.8%
11.2%
8.9%
8.0% 74.1%
67.7%
Spain Portugal Argentina Brazil
31Summary of stores
2017 2018
DIA GROUP 1 Owned Franchised TOTAL Owned Franchised TOTAL
Total stores at the beginning of the period 2.608 3.543 6.151 2.462 3.639 6.101
New openings 150 271 421 163 173 336
Owned to franchised net transfers -105 105 0 20 -20 0
Closings -191 -280 -471 -35 -245 -280
Total DIA GROUP stores at the end of the period 2.462 3.639 6.101 2.610 3.547 6.157
SPAIN 1 Owned Franchised TOTAL Owned Franchised TOTAL
Total stores at the beginning of the period 1.630 2.040 3.670 1.473 2.024 3.497
New openings 20 53 73 34 28 62
Owned to franchised net transfers -13 13 0 109 -109 0
Closings -164 -82 -246 -13 -72 -85
Total SPAIN stores at the end of the period 1.473 2.024 3.497 1.603 1.871 3.474
PORTUGAL 1 Owned Franchised TOTAL Owned Franchised TOTAL
Total stores at the beginning of the period 303 256 559 262 297 559
New openings 12 10 22 6 17 23
Owned to franchised net transfers -38 38 0 -35 35 0
Closings -15 -7 -22 -10 -40 -50
Total PORTUGAL stores at the end of the period 262 297 559 223 309 532
ARGENTINA Owned Franchised TOTAL Owned Franchised TOTAL
Total stores at the beginning of the period 296 576 872 303 627 930
New openings 32 78 110 30 64 94
Owned to franchised net transfers -16 16 0 -24 24 0
Closings -9 -43 -52 -11 -34 -45
Total ARGENTINA stores at the end of the period 303 627 930 298 681 979
BRAZIL Owned Franchised TOTAL Owned Franchised TOTAL
Total stores at the beginning of the period 379 671 1.050 424 691 1.115
New openings 86 130 216 93 64 157
Owned to franchised net transfers -38 38 0 -30 30 0
Closings -3 -148 -151 -1 -99 -100
Total BRAZIL stores at the end of the period 424 691 1.115 486 686 1.172
1. By 2018 year-end the company also operated 1,200 Clarel and 35 Max Descuento stores in Spain and 71 Clarel in Portugal
32Other items
Other cash items Other non-cash items
EURm 2017 2018 Change EURm 2017 2018 Change
Expenses relating to store remodellings 18.0 18.6 0.6 Write-off of fixed assets -17.2 -25.4 -7.6
Expenses relating to transfer of own stores to franchises 10.8 10.4 -0.4 Impairment of fixed assets -12.1 -79.9 -67.8
Expenses relating to store closings 31.3 25.7 -5.6 Impairment of DTA’s 0.0 -170.5 -170.5
Expenses relating to warehouse closings 1.7 1.1 -0.6 Impairment of discontinued operations 0.0 -38.0 -38.0
Expenses for efficiency projects and severance payments 20.2 34.6 14.4 Other non-cash items -29.3 -313.8 -283.9
o/w HQ restructuring 5.7 15.5 9.8
o/w Warehouses restructuring 2.7 4.9 2.3
o/w Stores restructuring 11.8 14.2 2.4
Other special expenses 1.7 28.4 26.7
o/w Impact from transportation strike in Brazil 0.0 7.9 7.9
o/w Advisory fees 0.0 18.2 18.2
o/w Other projects 1.7 2.3 0.6
Gains on disposal of assets -31.2 -28.1 3.1
Expenses related to share-based payments transactions -4.9 1.1 5.9
Other cash items 47.5 91.9 44.3
33You can also read