Regional Infometrics - MARCH 2017 - Ashburton District Council
←
→
Page content transcription
If your browser does not render page correctly, please read the page content below
Infometrics
                    Regional
                    Perspectives

An outlook for economic conditions in NZ's regions and industries

                     MARCH 2017

                     Economics put simply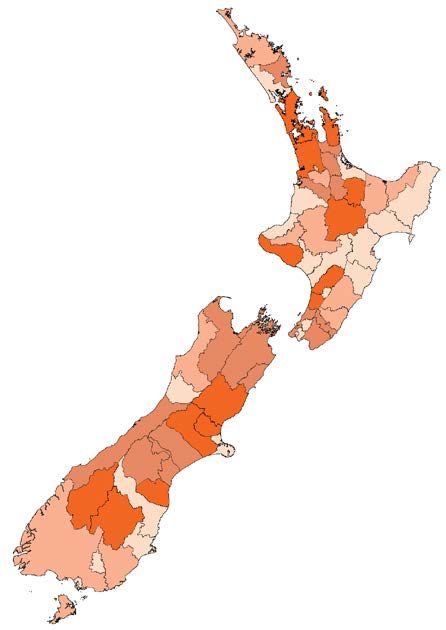
infometrics.co.nz

                             This report was prepared by Infometrics

                                             Author
                                Gareth Kiernan, Chief Forecaster
                                Email: GarethK@infometrics.co.nz
                                       Phone: 04 889 0801

While every effort is made to ensure that the information contained in this publication is accurate,
 Infometrics Ltd accepts no responsibility for any errors or omissions, or for any loss or damage
     resulting from reliance on the use of the information, forecasts or opinions it contains.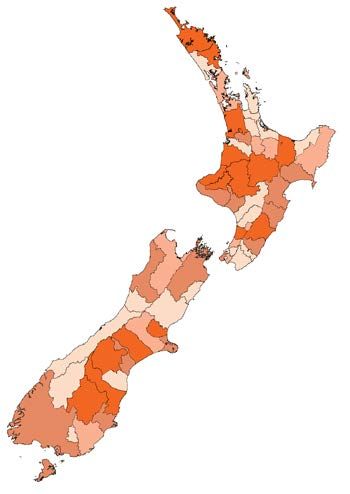
Introduction
    The Infometrics Regional Perspectives report provides our view on the outlook
    for economic conditions in New Zealand’s regions and industries over the next
    2-5 years. It draws off our comprehensive detailed regional economic forecast
    model. The report will be produced on a six-monthly basis.

    In this report, we highlight some of the key industries that are likely to have an impact
    on New Zealand’s short-term economic outlook, both positively and negatively, and
    identify what this growth is likely to mean regionally. This approach enables us to
    explore the range of regional growth prospects across New Zealand and examine some
    of the factors impacting the economic outlook in different parts of the country.
    This report does not focus on the detailed economic outlook of specific cities, towns, or
    districts that sit within those regional areas in any detail. While we have the expertise
    and capabilities to do this, such analysis is best customised to the needs of specific
    areas, organisations and users.

    The four industries focused on in this report are:
    • Electricity and gas supply
    • Professional, scientific, and technical services
    • Heavy and civil engineering construction
    • Health care and social assistance

    As well as looking at the outlook for economic growth in the above industries, we also
    take a closer look at two significant geographic areas and discuss the broader economic
    outlook in these areas. The two geographic areas focused on this report are:
    • Auckland Region
    • Christchurch City

    National growth outlook
    The New Zealand economy is currently enjoying a period of strong growth, with buoyant
    demand conditions in the construction industry and tourism sector being reinforced
    by a broader pick-up in demand across many other industries in the second half of
    2016. Population growth is at a 40-year high due to net migration, and the tightening
    labour market has boosted households’ willingness to spend. There are some
    downside risks to New Zealand’s medium-term outlook posed by international demand
    conditions, particularly in terms of China’s economic prospects and the possibility for
    trade sanctions to be imposed by President Trump, which could undermine Chinese
    economic growth. Imbalances in New Zealand’s housing market also have the
    potential to derail our economy. However, bearing these risks in mind, we expect New
    Zealand’s GDP to increase by an average of 2.6%pa over the next four years, with total
    employment expanding by 1.7%pa.

                                                                    REGIONAL PERSPECTIVES MARCH 2017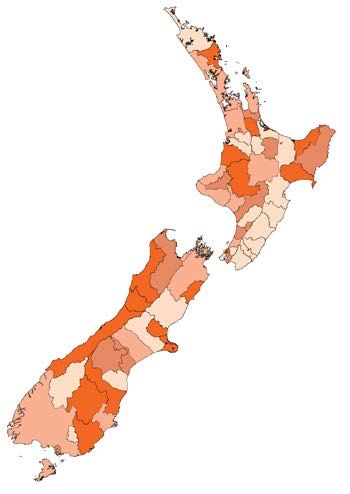
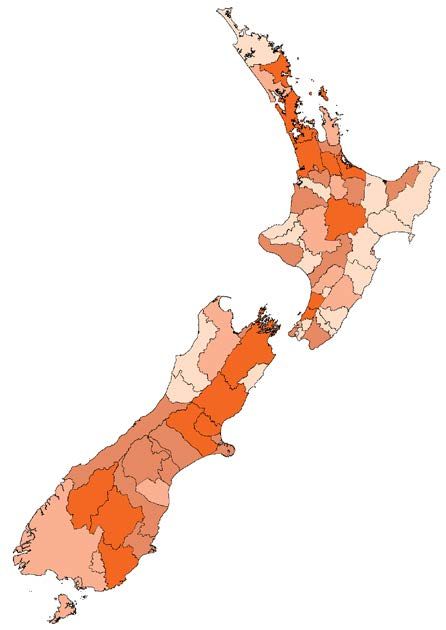
Employment growth 2017-2019

                                  2.54% – 5.30%
                                  2.05% – 2.54%
                                  1.54% – 2.05%
                                  0.42% – 1.54%

4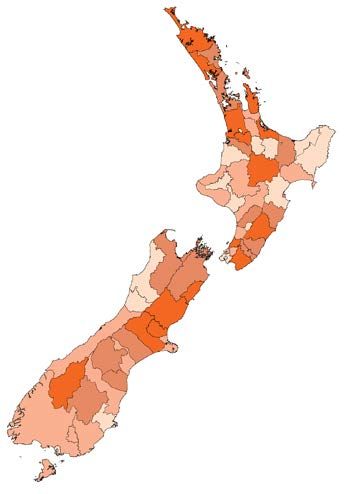
Employment growth 2019-2021

                                   1.1% – 4.3%
                                   0.6% –1.1%
                                   0.3% –0.6%
                                   -1.0% – 0.3%

REGIONAL PERSPECTIVES MARCH 2017                  5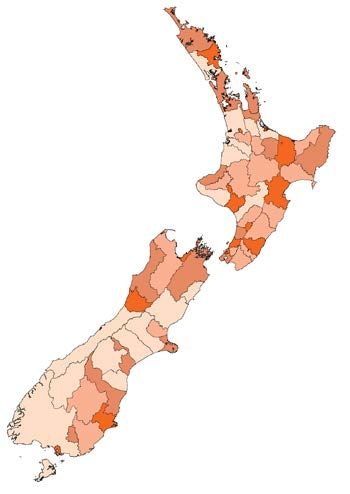
Industry Focus
Expanding population drives job growth in electricity supply
Electricity and gas supply
The electricity and gas supply industry represents 2.4% of the New Zealand economy and 0.3% of
nationwide employment (7,600 jobs). In terms of employment, the biggest subindustries are electricity
distribution, on selling electricity and electricitymarket operation, and fossil fuel electricity generation.

                                           Job Growth at a Glance – %p.a.
                                          ELECTRICITY AND GAS SUPPLY

                      3.3%                                6.7%                             4.0%

                     NZ = 1.9%                          NZ = 2.2%                         NZ = 1.1%
                  2011 – 2016                        2017 – 2019                       2019 – 2021

The electricity and gas supply industry has a relatively      recession in the wake of the Global Financial Crisis,
small proportion of total employment compared to its          while greater energy efficiency due to the increasing
share of GDP. This gap indicates a high level of capital      prevalence of heat pumps and improved insulation
intensity in the industry, which is unsurprising given that   of housing, for example, have reduced growth in
generation facilities mostly consist of machinery and         household demand for electricity.
require a low level of human input.
                                                              Our conclusion is that the electricity and gas supply
Yet the industry has been undergoing a significant            industry is essentially as lean as it can be, and that
change over recent years. Data from the Quarterly             future growth in employment will largely be a function
Employment Survey shows that total hours worked in            of increases in household and business numbers –
the broader electricity, gas, water and waste services        focusing demand predominantly on the distribution and
industry surged 77% over the six years to September           on-selling areas of the industry. And with population
2015, reversing a long-term downward trend in                 growth holding at above-average levels and a solid
employment that had persisted since the 1980s.                economic performance encouraging business creation
Our data shows that nationwide employment in the              and expansion, we anticipate strong growth in
electricity and gas supply industry has grown by an           electricity and gas supply employment.
average of 3.3%pa over the last five years and 5.4%pa
throughout the last decade.                                   Auckland, Hamilton, Wellington City, and Christchurch
                                                              are home to 47% of employment in the electricity and
Paradoxically, at the same time as growth in the              gas supply industry, below their economy-wide share of
industry’s employment has re-emerged, New                     total employment, at 55%. These figures indicate that
Zealand’s overall electricity usage has stalled. Energy       growth in electricity and gas supply will have a bigger-
requirements dipped as the economy suffered a                 than-average effect on job numbers outside the main

  6
centres, and particularly for those areas that are home    employment growth will be an important contributor to
to headquarters of electricity distribution and retail     the local economy. In comparison, the two areas with
firms.                                                     the largest lift in employment (in terms of the number
                                                           of jobs) are expected to be Wellington, with more than
These areas are as diverse as Waitemata and                200 additional jobs over the same four-year period, and
Maungakiekie-Tamaki in Auckland, Waitomo,                  Waitemata in Auckland (180 more jobs).
Waimakariri, and Waitaki. Although the number of
jobs created in the smaller districts will be relatively   In total, electricity and gas supply employment is
minor by nationwide standards (eg 26 jobs in Waitomo       forecast to expand by 14% over the next two years and
or 39 jobs in Waitaki over the next four years), the       23% over the four years to March 2021.

          0.61% – 3.17%                                        contribution to regional employment
          0.23% – 0.61%                                        by electricity and gas supply
          0.03% – 0.23%
          0.00% – 0.03%

REGIONAL PERSPECTIVES MARCH 2017                                                                               7
Industry Focus
Service sector growth driven by professional services
Professional, scientific, and technical services
The professional, scientific, and technical services industry represents 8.1% of the New Zealand economy
and 9.5% of nationwide employment (223,950 jobs). In terms of employment, the biggest subindustries
are computer systems design and related services, management advice and other consulting services,
corporate head office management services, engineering design and engineering consulting services,
and accounting services.

                                         Job Growth at a Glance – %p.a.
                             PROFESSIONAL, SCIENTIFIC AND TECHNICAL SERVICES

                      3.1%                               3.7%                             2.2%
                                                                                    NZ
                    NZ = 1.9%                        NZ = 2.2%                           NZ = 1.1%
                  2011 – 2016                      2017 – 2019                       2019 – 2021

Although the finance sector makes up just under             Our forecasts are predicated on the continuation of
4.0% of the nationwide economy, this activity is highly     stable financial market conditions, both within New
concentrated in two specific geographic areas. The          Zealand and internationally. Offshore risks to this
Auckland CBD local board area of Waitemata is home          view include concerns about the robustness of the
to 29% of economic activity for the finance sector,         Chinese financial system, as well as a tightening of
with a further 25% of nationwide activity in other areas    credit conditions in Australia that could flow through
within the Auckland region. Local board areas in            the banking system and limit growth here. Domestic
Auckland with a significant finance sector presence         risks appear to be mostly centred around the potential
include Maungakiekie-Tamaki, Albert-Eden, Orakei, and       for a correction in the housing market. However, our
Devonport-Takapuna. Outside Auckland, Wellington            forecasts already incorporate a drop in house prices
City contains a further 20% of the finance industry.        during 2018 and 2019.

Growth in economic activity in the finance sector was       Even allowing for a downturn in the housing market,
relatively weak between 2008 and 2012 in the wake of        overall prospects for the finance industry look bright.
the Global Financial Crisis. However, the industry has      The introduction of KiwiSaver last decade and its
experienced stronger growth over the last few years         ongoing growth since has helped boost the industry,
as financial markets have recovered and the housing         and this trend is expected to continue over the medium
market has grown strongly. By mid-2016, borrowing           term. Greater regulation and macroprudential oversight
from registered banks was growing at its fastest rate       of the financial system also mean that the industry is in
since 2009.                                                 a more robust position than it was a decade ago.

  8
As indicated above, the central parts of the Auckland reflected in reductions in physical banking services
and Wellington urban areas will be the most across provincial New Zealand, with technological
positively affected by the finance sector’s growth. advancements enabling more processes to be done
The increasing concentration of financial sector remotely and making it less viable for banks to maintain
operations and employment in these two cities is also branches in small towns.
2.1% – 2.9% contribution to regional employment
1.78% – 2.1% by professional, scientific and
1.48% – 1.78% technical services
0.83% – 1.48%
REGIONAL PERSPECTIVES MARCH 2017 9Industry Focus
Residential development and government projects underpin civil work
Heavy and civil engineering construction
The heavy and civil engineering construction industry represents 1.6% of the New Zealand economy and
1.4% of nationwide employment (33,600 jobs). The two subindustries are road and bridge construction
and other heavy and civil engineering construction.
Job Growth at a Glance – %p.a.
HEAVY AND CIVIL ENGINEERING CONSTRUCTION
4.4% 6.0% 0.0%
NZ = 1.9% NZ = 2.2% NZ = 1.1%
2011 – 2016 2017 – 2019 2019 – 2021
Employment growth in the heavy and civil engineering Route, the Puhoi to Wellsford highway, and the Penlink
construction industry has run well ahead of total road. Also under construction in Auckland within our
employment over the last five years, averaging 4.4%pa forecast period is the City Rail Link.
compared to economy-wide employment growth of
1.9%pa. Almost one-third of this growth has occurred Outside Auckland, there are Roads of National
in each of Auckland and Christchurch, with Tauranga Significance being built in the Waikato, Wellington, and
making the next biggest contribution to growth. Canterbury regions. These projects are expected to
result in strong growth in heavy and civil engineering
Population growth is an important driver of activity in job numbers in Hamilton, Porirua, and Wellington
this industry, with an expanding population requiring Cities. In contrast, Christchurch is likely to see
work associated with residential subdivisions, employment in the industry shrink as earthquake
roading, water and wastewater networks, and other rebuilding and repair work retreats from its peak.
infrastructure. Areas such as south Auckland,
Hamilton, Tauranga, and Queenstown-Lakes require Finally, private sector investment in major projects
significant resources in this industry to meet demand such as irrigation schemes also has the potential to
associated with population growth. have a significant effect on the regional distribution of
employment in areas such as Canterbury.
Another key driver of activity is government investment
in major infrastructure projects. The most significant We expect nationwide employment in heavy and civil
pieces of work in this area are generally large roading engineering to increase by 4,450 jobs over the two
projects, including several ongoing and proposed years to March 2019, before levelling off as population
projects around Auckland such as the Western Ring growth gradually slows and the run of major projects
10across the country eases back from its peak. Auckland Although we have noted the effect on the industry of
is forecast to contribute around 1,900 of those new quake-related work in Christchurch winding down over
jobs, with other significant contributions to employment the next few years, it is also important to comment on
growth coming from Hamilton, Rotorua (subject to activity associated with the Kaikoura earthquake. We
the Rotorua Eastern Arterial project going ahead), predict that employment in heavy and civil engineering
Manawatu-Whanganui, Porirua, Wellington City, and construction in the Kaikoura District will have doubled
Queenstown-Lakes. between 2016/17 and 2018/19, although this increase
is relatively minor in terms of the industry nationwide.
Beyond 2019, we anticipate that job growth in this The Hurunui District will see a smaller increase in
industry will become more dominated by the Auckland heaving and civil engineering construction employment
and Waikato Regions as strong population growth and because of the quake.
demand for new housing persist in the upper North Island.
2.06% – 6.46% contribution to regional employment
1.54% – 2.06% by heavy and civil engineering
1.1% – 1.54% construction
0.1% – 1.1%
REGIONAL PERSPECTIVES MARCH 2017 11Industry Focus
Demand grows for health care and related services
Health care and social assistance
The health care and social assistance industry represents 5.9% of the New Zealand economy and 9.9% of
nationwide employment (233,200 jobs). In terms of employment, the biggest subindustries are hospitals
(except psychiatric hospitals), other allied health services, and aged care residential services.
Job Growth at a Glance – %p.a.
HEALTH CARE AND SOCIAL ASSISTANCE
1.9% 3.0% 3.0%
NZ = 1.9% NZ = 2.2% NZ = 1.1%
2011 – 2016 2017 – 2019 2019 – 2021
Employment growth in the health care and social pressures and lead to increased capacity in the health
assistance industry has lagged behind economy- system, including a lift in overall employment.
wide growth in job numbers over the last three years,
averaging 2.1%pa in the 2013-2016 period, compared Over the medium term, the aging population will place
to 2.4%pa growth across the entire economy. This increased demand on the health care and social
sluggish growth is, in part, reflective of a contraction in assistance industry. This demand will manifest itself
government spending on health from 6.7% to 6.2% of in terms of aged care services, as the popularity of
GDP, despite the value of health spending increasing retirement village and rest home living continues
by $1.1bn between 2013 and 2016. to increase, as well as in broader hospital services
associated with the gradual deterioration in people’s
Projections from The Treasury show that government health as they become older. In some areas,
spending on health as a percentage of GDP is technological advances will limit the additional number
expected to bottom out in 2020 and grow thereafter. of workers required, but we still expect employment in
However, we believe that growth in health spending this industry to run ahead of the national average.
could rise more quickly in the near term given the
tightening political race for this year’s election. The From a regional perspective, growth in the health
government’s improved fiscal position has created care and social assistance industry will be spread
more room for additional spending initiatives in key reasonably evenly across the country, with the
areas such as health care, and the rapid population provision of appropriate health services a fundamental
growth of recent years has stretched areas of social part of the amenities available in different towns and
infrastructure such as the health system. A boost regions around New Zealand. But even within this
to government spending would acknowledge these framework, the concentration of higher-end services
12in the major urban centres tends to create a bias jobs). Although employment growth will be spread right
in job growth towards the larger cities. Provincial across Auckland, the Waitemata, Otara-Papatoetoe,
centres with hospitals offering mid-level medical care Albert-Eden, and Devonport-Takapuna local boards
to a catchment that extends well beyond the town in feature most prominently. Outside the three largest
question will also benefit from the industry’s growth. cities, Hamilton (2,000 jobs), Tauranga (1,300 jobs),
and Dunedin (1,000 jobs) will also record significant
Of the 30,900 additional jobs created in the health care increases, while employment growth in Whangarei,
and social assistance industry over the next four years, Wanganui, Palmerston North, and Masterton will be
we expect just over half to be in Auckland (9,900 jobs), boosted by the importance of the health care and social
Wellington City (2,000 jobs), and Christchurch (3,300 assistance industry in their regional economies.
12.4% – 16.5% contribution to regional employment
8.1% – 12.4% by health care and social assistance
5.7% – 8.1%
1.6% – 5.7%
REGIONAL PERSPECTIVES MARCH 2017 13Regional Focus
Auckland is New Zealand’s engine
Auckland Region
The Auckland Region represents 38% of the New Zealand economy and 35% of nationwide employment
(824,200 jobs). In terms of employment, the biggest industries are professional, scientific and technical
services, health care and social assistance, and education and training.
Job Growth at a Glance – %p.a.
AUCKLAND REGION
2.9% 3.0% 1.7%
NZ = 1.9% NZ = 2.2% NZ = 1.1%
2011 – 2016 2017 – 2019 2019 – 2021
After being hit hard in the wake of the Global Financial We are forecasting employment in Auckland to expand
Crisis, the Auckland economy has rebounded strongly by 83,550 jobs over the four years to March 2021.
over the last six years. Economic growth between The biggest contributions to growth will come from
March 2010 and March 2016 in the region averaged the three industries with the largest number of jobs
3.3%pa, well above the nationwide average of 2.3%pa. in the region: professional, scientific and technical
services (16,450 new jobs), health care and social
Two key factors have contributed to Auckland’s assistance (11,050 new jobs), and education and
success. Growth in the initial part of this decade training (8,200 new jobs). Other service industries also
reflected the recovery of service sector activity, around making significant contributions to employment growth
which much of Auckland’s economic activity is centred. include administrative and support services, local and
Secondly, the surge in international migration since central government administration, arts and recreation
2013 has fuelled population growth in the region and services, and other services.
boosted aggregate demand in Auckland – even if per-
capita growth has, at times, not been that spectacular. Even so, growth will not be limited to the high-end
service part of the economy. The construction industries
With New Zealand’s labour market expected to remain will experience substantial job growth as the prolonged
relatively tight throughout the next four years, we response to Auckland’s housing supply issues continues
anticipate that net migration will hold at above-average throughout the next four years. Residential construction
levels, sustaining strong population growth in Auckland. activity will be accompanied by the need for ongoing
The expanding population will provide a solid basis investment in infrastructure in the region as well.
for continued GDP growth in the region, which will be
magnified by the continued expansion of key service A combination of population growth and further increases
industries that are important to the Auckland economy. in tourist numbers will benefit the retail, accommodation,
14and food services industries in Auckland. Growth in consistent across the Auckland Region. Sizable
retail employment in the region will occur despite the expansion of the stock of office space is currently
continuing trend towards online retailing, with the job underway in the CBD, which will facilitate business and
growth being driven by the need for new retail facilities employment growth in the Waitemata local board area
near areas of strong population growth, particularly over the next 2-4 years.
towards the outskirts of Auckland. Capacity pressures in
the tourism sector are already well-documented and will One spot that is likely to underperform is the Mangere-
demand further growth over the medium term. Otahuhu local board area, which has a relatively
high proportion of industrial firms (manufacturing,
We have also noted the likely growth in electricity and wholesaling, and distribution). Rising land and labour
gas supply employment, which will make a significant costs are making it less viable for these businesses
contribution to the Auckland Region. to be sited in Auckland, and improved transport links
to the south are encouraging more firms to consider
Geographically, we expect growth to be reasonably relocating to the Waikato Region.
Top five job growth industries in Auckland:2017-2021
JOBS 0 4000 8000 12000 16000
REGIONAL PERSPECTIVES MARCH 2017 15Regional Focus
After the rebuild peak, Christchurch finds growth harder to come by
Christchurch City
Christchurch City represents 8.5% of the New Zealand economy and 9.5% of nationwide employment
(224,300 jobs). In terms of employment, the biggest industries are health care and social assistance,
professional, scientific and technical services, and education and training.
Job Growth at a Glance – %p.a.
CHRISTCHURCH CITY
2.0% 1.1% 0.8%
NZ
NZ = 1.9% NZ = 2.2% NZ = 1.1%
2011 – 2016 2017 – 2019 2019 – 2021
Economic activity in Christchurch grew by an average and manufacturing. The drop-off in building activity will
of 4.7%pa between March 2012 and March 2015 as reduce demand for new vehicles from tradespeople,
the city recovered from the devastating earthquakes and the need for replacement vehicles in Christchurch
of 2010 and 2011. This growth rate was a full two over the next few years is likely to be below the national
percentage points faster than nationwide growth. average given the strength of car sales volumes in the
But with residential building activity having peaked city between 2012 and early 2015.
in 2015, and signs that both non-residential and
infrastructure construction are also tapering, economic Manufacturing activity in Christchurch has been under
growth in Christchurch has slipped back below the sustained pressure from the weak Australian dollar
national average. This struggle to keep up with the and soft economy across the Tasman. Demand from
performance of the broader New Zealand economy will Australia is a significant driver of manufacturing activity
continue throughout the next four years. in Christchurch, and although both Australia’s economic
performance and the exchange rate are likely to become
Naturally, the post-rebuild slowdown will be felt most more favourable for exporters over the 2-3 years, the
acutely in the construction industries. Between 2017 city’s manufacturing sector is unlikely to grow rapidly.
and 2021, we are forecasting the loss of 4,200 jobs, or
15% of the workforce, across the building construction, Furthermore, a sizable proportion of manufacturing
heavy and civil engineering construction, and production is related to activity in the construction
construction services industries. sector. The slowdown in building activity will limit
demand for workers in some manufacturing subsectors
Other parts of the Christchurch economy that are likely such as wood product manufacturing and polymer
to come under pressure include motor vehicle retailing product and rubber product manufacturing.
16But it’s not all doom and gloom for the Christchurch the city’s tourism sector gradually returning to “normal”
economy. Strong performances by professional, after its post-quake downturn.
scientific and technical services (2,850 more jobs over
the next four years), health care and social assistance At 0.9%pa over the next four years, we are forecasting
(2,950 more jobs), and education and training (1,650 employment growth in Christchurch to lag behind
more jobs) will be big contributors to new job growth. nationwide growth of 1.7%. The toughest period
Ongoing growth in visitor numbers nationally will is likely over the next 12 months as construction
flow through to Christchurch, with employment in employment declines by over 10%.
accommodation and food services also boosted by
Top five job growth industries in Christchurch City:2017-2021
JOBS 0 1000 2000 3000
REGIONAL PERSPECTIVES MARCH 2017 17Regional Data Table
The following table provides high level summary data about regional employment and job growth in New
Zealand. Please contact Infometrics for information about how to obtain detailed regional and territorial
employment forecasts.
Level %pa growth
2016 2011-2016 2017-2019 2019-2021 2017-2021
Northland Region 68,014 1.2% 2.0% 0.9% 1.4%
Auckland Region 824,200 2.9% 3.0% 1.7% 2.4%
Waikato Region 204,453 1.8% 2.0% 0.8% 1.4%
Bay of Plenty Region 141,455 1.6% 2.0% 1.0% 1.5%
Gisborne Region 21,274 0.5% 1.1% 0.0% 0.5%
Hawke’s Bay Region 76,939 0.3% 1.4% 0.2% 0.8%
Taranaki Region 57,837 0.8% 1.7% 0.1% 0.9%
Manawatu-Wanganui Region 110,421 0.1% 1.4% 0.2% 0.8%
Wellington Region 273,590 0.9% 1.9% 0.6% 1.2%
Nelson Region 30,041 1.0% 2.1% 0.8% 1.4%
Marlborough Region 26,183 1.4% 2.4% 1.2% 1.8%
Tasman Region 21,575 1.7% 2.2% 0.5% 1.4%
West Coast Region 16,615 -0.9% 1.9% -0.3% 0.8%
Canterbury Region 320,669 2.4% 1.6% 1.1% 1.3%
Otago Region 117,130 1.6% 2.2% 1.3% 1.8%
Southland Region 53,030 0.8% 1.5% 0.3% 0.9%
New Zealand 2,363,428 1.9% 2.2% 1.1% 1.7%
18infometrics.co.nz
Level 20, Plimmer Towers
2 Gilmer Terrace, Wellington
PO Box 25-309, Featherston St
Wellington, 6146
ECONOMICS PUT SIMPLYEconomics put simply
You can also read