Housing market trends - Our Insights. Your Story. April 2020 - SF Capital

Page created by Connie Patterson
 
CONTINUE READING
Housing market trends - Our Insights. Your Story. April 2020 - SF Capital
Housing market
trends
Our Insights. Your Story.
April 2020
Housing market trends - Our Insights. Your Story. April 2020 - SF Capital
Australian home values have been
in an upswing since mid-2019,
however the short-term outlook is
for extreme uncertainty and
downside risk followed by a
rebound as economic conditions
recover.
Housing market trends - Our Insights. Your Story. April 2020 - SF Capital
Decline and recovery cycle, Australian capitals

                                         Canberra
                                     4 months to trough                                                Adelaide
                                                                                                                                                         Most housing
                                          (1.5%)
                                     2 months to recover
                                                                                               10 months to trough (-1.6%)
                                                                                                  4 months to recover
                                                                                                                                                          markets have
                                                                  Hobart
                                                         3 months to trough (-1.3%)
                                                                                                                        Brisbane
                                                                                                               15 months to trough (-2.9%)
                                                                                                                                                        already staged a
                                                            5 months to recover                                    7 months to recover
                                                                                                                                                       recovery from the
                                                                                                                         Melbourne
                               5.0%
                                                                                                                19 months to trough (-11.1%)…          recent downturn,
                                                                                                             Sydney
                               0.0%                                                             23 months to trough (-14.9%)
                                                                                                    Still 2.7% below peak
                                                                                                                                                       with Sydney, Perth
% decline from market peak

                              -5.0%                                                                                                           Perth
                                                                                                                               65 months to trough
                                                                                                                                                      and Darwin the only
                             -10.0%

                             -15.0%
                                                                                                                     (-20.7%)Still 20.7% below peak      capitals where
                             -20.0%
                                                                                                                                                         housing values
                             -25.0%                                                                                                                   remain below their
                             -30.0%
                                                                                                                                                        previous peaks.
                             -35.0%                                                                              Darwin
                                                                                                                 71 months of decline (-31.4%)
                             -40.0%
                                         1 3 5 7 9 11 13 15 17 19 21 23 25 27 29 31 33 35 37 39 41 43 45 47 49 51 53 55 57 59 61 63 65 67 69 71
                                                                                   Months since market peak

                              18 July
                                  ©©2020
                                      2019 CoreLogic,
                                           CoreLogic, Inc.
                                                       Inc.All
                                                            AllRights
                                                                RightsReserved.
                                                                       Reserved.                                                                                  Source: CoreLogic   3
Housing market trends - Our Insights. Your Story. April 2020 - SF Capital
Dwelling values increased in six of the eight capital city markets
    in the year to March, with five markets reaching a record high
    value

Annual change in dwelling values
 30%                                                                                  20%
 25%                                                                                  15%
 20%
                                                                                      10%
 15%
 10%                                                                                   5%
  5%                                                                                   0%
  0%
                                                                                       -5%
 -5%
-10%                                                                                  -10%
-15%                                                                                  -15%
   Mar 10               Mar 12              Mar 14       Mar 16    Mar 18    Mar 20      Mar 10     Mar 12   Mar 14   Mar 16   Mar 18         Mar 20

        Sydney               Melbourne               Brisbane     Adelaide   Perth                Hobart         Darwin         Canberra

18 July
    ©©2020
        2019 CoreLogic,
             CoreLogic, Inc.
                         Inc.All
                              AllRights
                                  RightsReserved.
                                         Reserved.                                                                                 Source: CoreLogic   4
Housing market trends - Our Insights. Your Story. April 2020 - SF Capital
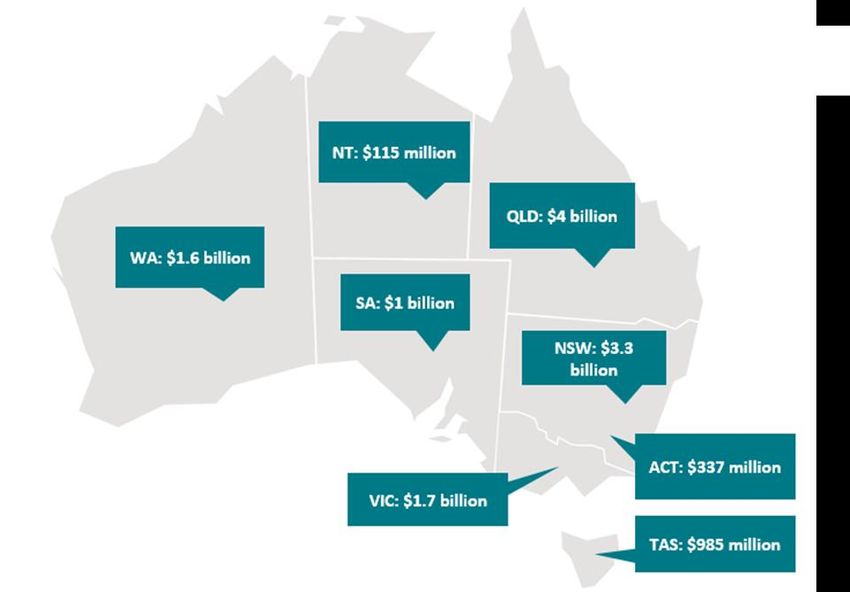
Buyer activity has bounced back since mid-2019, but activity
remains well below recent highs

 18 July
     ©©2020
         2019 CoreLogic,
              CoreLogic, Inc.
                          Inc.All
                               AllRights
                                   RightsReserved.
                                          Reserved.      Source: CoreLogic   5
Housing market trends - Our Insights. Your Story. April 2020 - SF Capital
Days on market was shortening prior to coronavirus as
buyer demand rose against a backdrop of low listing
numbers
             Median days on market, combined
                         capitals
70                                                                                                                             62
                                                                                       National                     50
                                                                             Combined regionals                                        68
                                                                                                                                  63
                                                                              Combined capitals                           57
60                                                                                                             42

                                                                                     Rest of NT                                                      94
                                                                                                                                                   87.5
50                                                                                  Rest of Tas                    47
                                                                                                                   46
                                                                                    Rest of WA                                               78
                                                                                                                                              80
                                                                                     Rest of SA                                                    89
                                                                                                                                             79
40                                                                                  Rest of Qld                                        68
                                                                                                                                  63
                                                                                    Rest of Vic                         53
                                                                                                                        53
                                                                                   Rest of NSW                                               78
                                                                                                                                   66
30
                                                                                     Canberra                                58
                                                                                                              39
                                                                                       Darwin                                                76
                                                                                                                                        71
20                                                                                     Hobart     18
                                                                                                    22
                                                                                         Perth                                     66
                                                                                                                          56
                                                                                     Adelaide                           53
10                                                                                                                       54
                                                                                     Brisbane                           52
                                                                                                                         55
                                                                                    Melbourne                            55
                                                                                                         32
                                                                                       Sydney                                          69
0                                                                                                        33
Mar 10          Mar 12           Mar 14           Mar 16   Mar 18   Mar 20                                         Mar 19                   Mar 20
These charts show the median days on market over 3 month rolling periods.

 18 July
     ©©2020
         2019 CoreLogic,
              CoreLogic, Inc.
                          Inc.All
                               AllRights
                                   RightsReserved.
                                          Reserved.                                                                                                Source: CoreLogic   6
Housing market trends - Our Insights. Your Story. April 2020 - SF Capital
Vendor discounting was also tapering as sellers took advantage
 of a strong negotiation position

             Median vendor discount, combined
                         capitals
0.0%                                                                                           -5.8%
                                                                                                        -4.2%              National
                                                                                                  -5.3%                    Combined regionals
                                                                                                       -4.4%
                                                                                            -6.2%                          Combined capitals
-1.0%                                                                                                    -4.0%

                                                                                             -5.9%                         Rest of NT
                                                                                                -5.4%
-2.0%                                                                                                   -4.3%              Rest of Tas
                                                                                                            -3.5%
                                                                                  -7.7%                                    Rest of WA
                                                                                    -7.3%
                                                                                              -5.8%                        Rest of SA
                                                                                                -5.7%
-3.0%                                                                                          -5.7%                       Rest of Qld
                                                                                                     -4.5%
                                                                                                     -4.5%                 Rest of Vic
                                                                                                         -3.8%
                                                                                                 -5.3%                     Rest of NSW
                                                                                                       -4.2%
-4.0%
                                                                                                                 -2.9%     Canberra
                                                                                                                   -2.6%
                                                                                   -7.5%                                   Darwin
                                                                                      -6.9%
-5.0%                                                                                               -4.7%                  Hobart
                                                                                                               -3.0%
                                                                                      -6.8%                                Perth
                                                                                                  -5.0%
                                                                                                  -5.0%                    Adelaide
-6.0%                                                                                                -4.5%
                                                                                                   -4.8%                   Brisbane
                                                                                                        -4.1%
                                                                                     -6.9%                                 Melbourne
                                                                                                            -3.4%
                                                                                   -7.4%                                   Sydney
-7.0%                                                                                                        -3.3%
    Mar 10           Mar 12           Mar 14           Mar 16   Mar 18   Mar 20                                             Mar 19     Mar 20
 These charts show median vendor discounting over 3 month rolling periods.

  18 July
      ©©2020
          2019 CoreLogic,
               CoreLogic, Inc.
                           Inc.All
                                AllRights
                                    RightsReserved.
                                           Reserved.                                                                                     Source: CoreLogic   7
The impact on the housing
market from coronavirus
remains highly uncertain…

Previous economic shocks
have seen housing values
relatively insulated, while
volumes are more susceptible
to volatility.
Housing values have generally been insulated from financial shocks
      historically but have been more reactive to credit tightening events
Housing indices v All Ordinaries index across previous shocks (5yrs either side of event)
      Black Monday stock                                 Asian financial crisis                        Tech wreck / Sep 11                              GFC                           Macroprudential, (Dec 14
      market crash (Oct 87)                    190             (Dec 97)                      190                                                      (Jan 08)                              / Mar 17)
190                                                                                                                                                                             160
                                                                                                                                       140

140                                            140                                           140

                                                                                                                                        90                                      110

 90                                             90                                            90

                      Housing values                                       Housing values                           Housing values
                                                                                                                                                             Housing values                             Housing values
                      All Ords                                             All ords                                 All ords                                                                            All ords
                                                                                                                                                             All ords
 40                                             40                                            40                                        40                                       60
  Oct 82        Oct 87          Oct 92           Dec 92           Dec 97           Dec 02      Sep 96          Sep 01         Sep 06     Jan 03         Jan 08         Jan 13     Dec 09         Dec 14             Dec 19

Housing volume v All Ordinaries index across previous shocks (5yrs either side of event)
      Black Monday stock                                 Asian financial crisis                        Tech wreck / Sep 11                              GFC                                Macroprudential
      market crash (Oct 87)                                    (Dec 97)              4,000
                                                                                                            (Sep 01)                                  (Jan 08)                             (Dec 14 / Mar 17)
250,000                         2,500                                                        450,000                          6,000    200,000                         8,000    400,000                              8,000

                                               400,000
                                                                                     3,000                                             180,000                         6,000                                         6,000

150,000                         1,500                                                        350,000                          4,000                                             300,000
                                               300,000
                                                                                     2,000                                             160,000                         4,000                                         4,000

                   Volume of sales                                  Volume of sales                              Volume of sales                          Volume of sales                         Volume of sales
                   All ords                                         All ords                                     All ords                                 All ords                                All ords
 50,000                          500           200,000                            1,000      250,000                           2,000   140,000                          2,000   200,000                          2,000
       Oct 82    Oct 87     Oct 92                   Oct 82       Oct 87       Oct 92              Sep 96     Sep 01      Sep 06             Jan 03     Jan 08    Jan 13              Dec 09     Dec 14     Dec 19

Housing values and volumes are based on combined capitals region
  18 July
      ©©2020
          2019 CoreLogic,
               CoreLogic, Inc.
                           Inc.All
                                AllRights
                                    RightsReserved.
                                           Reserved.                                                                                                                                            Source: CoreLogic      9
Weakening consumer sentiment is likely to be a driver of fewer
              housing transactions

Consumer sentiment v Volume of dwellings sales
                           140                                                                                                                     65,000

                           130                                                                                                                     60,000

                                                                                                                                                   55,000
                           120
Consumer sentiment index

                                                                                                                                                               Volume of dwelling sales
                                                                                                                                                   50,000
                           110
                                                                                                                                                   45,000
                           100
                                                                                                                                                   40,000
                            90
                                                                                                                                                   35,000
                            80
                                                                                                                                                   30,000

                            70                                                                                                                     25,000
                                 Consumner sentiment index (LHS)                                            Volume of sales (RHS)
                            60                                                                                                                20,000
                             Apr 00    Apr 02      Apr 04     Apr 06   Apr 08   Apr 10   Apr 12   Apr 14   Apr 16     Apr 18             Apr 20

18 July
    ©©2020
        2019 CoreLogic,
             CoreLogic, Inc.
                         Inc.All
                              AllRights
                                  RightsReserved.
                                         Reserved.                                                                  Source: CoreLogic, Westpac/Melbourne Institute                        10
The ANZ/Roy Morgan weekly reading on consumer sentiment has
  fallen dramatically over the past four weeks, but showed a bounce
  back over the most recent two weeks

18 July
    ©©2020
        2019 CoreLogic,
             CoreLogic, Inc.
                         Inc.All
                              AllRights
                                  RightsReserved.
                                         Reserved.         Source: ANZ/Roy Morgan   11
CoreLogic’s daily home value index, which measures the change in
  housing values, showed a change of pace half way through March,
  with the trend continuing to lose momentum in April
 Daily CoreLogic home value index – rolling 28-day change
     Rolling 28 day change in dwelling                       Rolling 28 day change in dwelling       Rolling 28 day change in dwelling
              values, Sydney                                         values, Melbourne                   values, Combined capitals

1.9%                                                     1.9%                                    1.9%

1.4%                                                     1.4%                                    1.4%

0.9%                                                     0.9%                                    0.9%

0.4%                                                     0.4%                                    0.4%

-0.1%                                                    -0.1%                                   -0.1%
         5/02/2020

         4/03/2020

         1/04/2020
         8/04/2020

                                                                  5/02/2020

                                                                  4/03/2020

                                                                  1/04/2020
                                                                  8/04/2020
        15/01/2020
        22/01/2020
        29/01/2020

        12/02/2020
        19/02/2020
        26/02/2020

        11/03/2020
        18/03/2020
        25/03/2020

        15/04/2020

                                                                 15/01/2020
                                                                 22/01/2020
                                                                 29/01/2020

                                                                 12/02/2020
                                                                 19/02/2020
                                                                 26/02/2020

                                                                 11/03/2020
                                                                 18/03/2020
                                                                 25/03/2020

                                                                 15/04/2020

                                                                                                          5/02/2020

                                                                                                          4/03/2020

                                                                                                          1/04/2020
                                                                                                          8/04/2020
                                                                                                         15/01/2020
                                                                                                         22/01/2020
                                                                                                         29/01/2020

                                                                                                         12/02/2020
                                                                                                         19/02/2020
                                                                                                         26/02/2020

                                                                                                         11/03/2020
                                                                                                         18/03/2020
                                                                                                         25/03/2020

                                                                                                         15/04/2020
    18 July
        ©©2020
            2019 CoreLogic,
                 CoreLogic, Inc.
                             Inc.All
                                  AllRights
                                      RightsReserved.
                                             Reserved.                                                                      Source: CoreLogic   12
Each of the major capital cities has seen the trend in capital gains
losing steam
Daily CoreLogic home value index – rolling 28-day change

 18 July
     ©©2020
         2019 CoreLogic,
              CoreLogic, Inc.
                          Inc.All
                               AllRights
                                   RightsReserved.
                                          Reserved.              Source: CoreLogic   13
Clearance rates have plunged over the past two weeks due to a
                  surge in withdrawn auctions (which are counted as not sold)
                             Auction clearance rate and volume of auctions, National
                             100%
    Auction clearance rate

                              80%
                              60%
                              40%
                              20%
                                 0%
                                      Apr 09
                                               Aug 09

                                                                            Aug 10

                                                                                                                                                                                             Aug 14

                                                                                                                                                                                                                        Aug 15
                                                          Dec 09
                                                                   Apr 10

                                                                                       Dec 10
                                                                                                Apr 11
                                                                                                         Aug 11

                                                                                                                                                                  Aug 13
                                                                                                                     Dec 11
                                                                                                                              Apr 12
                                                                                                                                       Aug 12
                                                                                                                                                Dec 12
                                                                                                                                                         Apr 13

                                                                                                                                                                           Dec 13
                                                                                                                                                                                    Apr 14

                                                                                                                                                                                                      Dec 14
                                                                                                                                                                                                               Apr 15

                                                                                                                                                                                                                                 Dec 15
                                                                                                                                                                                                                                          Apr 16
                                                                                                                                                                                                                                                   Aug 16
                                                                                                                                                                                                                                                            Dec 16
                                                                                                                                                                                                                                                                     Apr 17
                                                                                                                                                                                                                                                                              Aug 17
                                                                                                                                                                                                                                                                                       Dec 17
                                                                                                                                                                                                                                                                                                Apr 18
                                                                                                                                                                                                                                                                                                         Aug 18
                                                                                                                                                                                                                                                                                                                  Dec 18
                                                                                                                                                                                                                                                                                                                              Apr 19
                                                                                                                                                                                                                                                                                                                                       Aug 19
                                                                                                                                                                                                                                                                                                                                                Dec 19
                                                                                                                                                                                                                                                                                                                                                            Apr 20
Portion of auctions withdrawn*                                                                                                                                                               Portion of auctions sold prior*
80%
                                                                                                                                                                                             100%
60%                                                                                                                                                               54.8%                                                                                                                                                                         82.7%
                                                                                                                                                                                              80%
40%                                                                                                                                                                                           60%
20%                                                                                                                                                                                           40%
                                                                                                                                                                                              20%
 0%
                                                                                                                                                                                               0%
                        Apr 15

                                                 Apr 16

                                                                              Apr 17

                                                                                                            Apr 18

                                                                                                                                           Apr 19

                                                                                                                                                                       Apr 20

                                                                                                                                                                                                           Apr 15

                                                                                                                                                                                                                                      Apr 16

                                                                                                                                                                                                                                                                 Apr 17

                                                                                                                                                                                                                                                                                            Apr 18

                                                                                                                                                                                                                                                                                                                           Apr 19

                                                                                                                                                                                                                                                                                                                                                         Apr 20
* As a % of all auction results                                                                                                                                                              * As a % of all ‘sold’ auction results
   18 July
       ©©2020
           2019 CoreLogic,
                 CoreLogic, Inc.
                             Inc.All
                                  AllRights
                                      RightsReserved.
                                             Reserved.                                                                                                                                                                                                                                                                              Source: CoreLogic             14
A change in appetite for auctions is most impactful on
  Melbourne and Sydney, where more than 80% of capital city
  auctions are held
         What % of properties are listed as auction sales?                                           Share of capital city auction listings
                                                                                                             Perth   Hobart Darwin
                       27%                                                                27%                 2%      0%     1% Canberra
          25%
                                                                                                          Adelaide                 4%
                                                                                                            5%
                                                                                                       Brisbane
                                                                                                          6%                                                          Sydney
                                                                                                                                                                       36%

                                                 11%                             10%

                                     5%

                                                                2%
                                                                        1%

                                                                                          Canberra
            Sydney

                                                                Perth

                                                                                 Darwin
                                      Brisbane

                                                     Adelaide

                                                                        Hobart
                         Melbourne

                                                                                                        Melbourne
                                                                                                          46%

18 July
    ©©2020
        2019 CoreLogic,
             CoreLogic, Inc.
                         Inc.All
                              AllRights
                                  RightsReserved.
                                         Reserved.                                                                     Source: CoreLogic, Based on total listings data, 2019 calendar year   15
Agents are less active across RP Data platforms, implying a
sharp drop in pre-listings activity
Rolling 7-day count of CMA activity, Australia
2019 v 2020
                                                                                                                                                                                                 % change from                                                                      % change from
                                                                                                                                                                                                 7 days ago                                                                         same time last year
                                                                                                                                                                             40%                                                                                              30%
                                                                                                                                                                             30%                                                                                              20%
                                                                                                                                                                                                                                                                              10%
                                                                                                                                                                             20%
                                                                                                                                                                                                                                                                               0%
                                                                                                                                                                             10%                                                                                             -10%
                                                                                                                                                                              0%                                                                                             -20%
                                                                                                                                                                             -10%                                                                                            -30%
                                                                                        Down 66% on same time last year
                                                                                  (noting Easter was a week later in 2019)                                                   -20%                                                                                            -40%
                                                                                                                                                                                                                                                                             -50%
                                                                                                                                                                             -30%
                                                                                                                                                                                                                                                                             -60%
                                                                                                                                                                             -40%                                                                                            -70%
                               5/02/2020

                                                                                   4/03/2020

                                                                                                                                        1/04/2020

                                                                                                                                                    8/04/2020
 22/01/2020

                  29/01/2020

                                           12/02/2020

                                                        19/02/2020

                                                                     26/02/2020

                                                                                               11/03/2020

                                                                                                              18/03/2020

                                                                                                                           25/03/2020

                                                                                                                                                                15/04/2020
                                                                                                                                                                             -50%                                                                                            -80%

                                                                                                                                                                                                  5/02/2020

                                                                                                                                                                                                                           4/03/2020

                                                                                                                                                                                                                                                    1/04/2020

                                                                                                                                                                                                                                                                                                 5/02/2020

                                                                                                                                                                                                                                                                                                                          4/03/2020

                                                                                                                                                                                                                                                                                                                                                   1/04/2020
                                                                                                                                                                                    22/01/2020

                                                                                                                                                                                                              19/02/2020

                                                                                                                                                                                                                                       18/03/2020

                                                                                                                                                                                                                                                                15/04/2020

                                                                                                                                                                                                                                                                                    22/01/2020

                                                                                                                                                                                                                                                                                                             19/02/2020

                                                                                                                                                                                                                                                                                                                                      18/03/2020

                                                                                                                                                                                                                                                                                                                                                               15/04/2020
                               Seven day count 2020                                                         Seven day count 2019

              18 July
                   © 2019 CoreLogic, Inc. All Rights Reserved.                                                                                                                                                                                                                                                                         Source: CoreLogic               16
New listing numbers are falling sharply and likely to fall
     materially further over the coming months

     New Listings, rolling 28-day count, combined capital cities
    35,000

    30,000

    25,000

    20,000

    15,000

    10,000

      5,000

             0
                 Jan             Feb             Mar   Apr          May      Jun     Jul    Aug   Sep    Oct   Nov   Dec

                                                             2016         2017     2018    2019   2020

18 July
    ©©2020
        2019 CoreLogic,
             CoreLogic, Inc.
                         Inc.All
                              AllRights
                                  RightsReserved.
                                         Reserved.                                                                    Source: CoreLogic   17
New Listings                                     % change from same
                                                           28 days ending April 12, 2020                    period last year
                                                                Rest of NT   31                                      -44.6%
                                                               Rest of Tas   350                                        -38.6%
                                                               Rest of WA    477                                 -53.2%
                                                                Rest of SA   343                                        -37.2%
Every region has                                              Rest of Qld.        3,341                                   -30.3%

recorded a sharp                                               Rest of Vic
                                                             Rest of NSW
                                                                              1,784
                                                                                  2,957
                                                                                                                           -27.8%
                                                                                                                          -32.2%
decline in new                                                   Canberra    359                                      -40.1%
listing numbers                                                    Darwin    66                                -57.7%

relative to a year                                                 Hobart
                                                                    Perth
                                                                             332
                                                                              1,544                             -55.1%
                                                                                                                                  -16.4%

ago                                                              Adelaide
                                                                 Brisbane
                                                                              1,194
                                                                                  2,733
                                                                                                                      -39.7%
                                                                                                                          -30.7%
                                                              Melbourne            4,306                                    -26.4%
                                                                   Sydney          4,232                                       -20.4%

                                                       Combined Regional                   9,283                          -32.8%
                                                   Combined Capital Cities                         14,766                 -31.9%
                                                                 National                                   24,051        -32.4%
18 July
     © 2019 CoreLogic, Inc. All Rights Reserved.                                                                                 Source: CoreLogic   18
The next few months present an
unprecedented shock to an economy with
otherwise strong fundamentals.

The institutional response is about
‘building a bridge’ to the recovery phase,
with stimulus totaling about 16.5% of GDP
There has been a highly coordinated institutional response
     to a pause in economic activity

   Value of stimulus ($ billions)

                                                                                                                      States
              Monetary stimulus, $105.0                                       Federal fiscal stimulus, $213.6
                                                                                                                      $13.0

                                                                     Federal
                RBA                                APRA                                                               States
                                                                   Government

                                                 Temporary              Targeted funding                        Varied, with focus
                 Cash rate                    changes to capital       for businesses and                       on tax relieve and
                 reduction                          ratio                  households                           support for SME’s
                                                requirements

             Unconventional
               monetary
               response

18 July
     © 2019 CoreLogic, Inc. All Rights Reserved.                                                                                     20
Because the cash rate probably can’t be reduced any
     further, the RBA are now adopting unconventional
     monetary policy

                                                    RBA monetary
                                                      response

       Targeting 3 year
                                                   Cash rate reduced to   A term funding facility for
   government bond rates of
                                                          0.25%                    banks
            0.25%

18 July
     © 2019 CoreLogic, Inc. All Rights Reserved.                                                        21
The RBA has lowered the cash rate to the effective lower
  bound
  Monthly change in values versus RBA cash rate

18 July
     © 2019 CoreLogic, Inc. All Rights Reserved.        Source: RBA, CoreLogic   22
For businesses the focus is on small to medium
            enterprises, saving jobs and incentivising investment
                        A wage subsidy package of $1,500 per          A 15-month investment incentive program,
                        fortnight for eligible employees and          delivered through accelerated depreciation
                        employers                                     deductions

                                                                      Funding of $1 billion to support regions and
                        A 50% subsidy for apprentice’s or trainee’s   sectors most affected by the COVID-19
                        wages                                         outbreak, which include areas heavily reliant on
                                                                      tourism, agriculture and education

                        Operational cost support of between
                                                                      Temporary relief for financially distressed
                        $20,000 and $100,000 for small to medium
                                                                      businesses
                        sized businesses and not-for-profits

                        A framework for preserving commercial         Temporary exemption from responsible
                        tenancies for SMEs that qualify for the       lending obligations for lenders providing
                        JobKeeper program                             credit to existing small business customers

                                                                      A 50% loan guarantee (the SME Guarantee
                        Increases in the instant asset write-off      Scheme) for small to medium sized
                        threshold                                     enterprise borrowers to support new short-
                                                                      term unsecured loans
18 July
     © 2019 CoreLogic, Inc. All Rights Reserved.                                                                         23
For households, the focus is on income support and
ensuring tenants have security of tenure
                                               A 6-month moratorium on evictions for residential and commercial property tenants, for tenants
                                               who are unable to pay rent due to COVID-19. According to a press conference on March 30,
                                               compensation for landlords, such as a rent guarantee, is “still being worked through”

                                               The JobSeeker payment has been temporarily lifted by $550 per fortnight

                                               $750 will be provided to low income households on government assistance this year and next
                                               financial year.

                                               Early access to up to $10,000 in superannuation is available for eligible unemployed Australians

                                               Temporary reduction of superannuation minimum drawdown rates will be implemented.

18 July
     © 2019 CoreLogic, Inc. All Rights Reserved.                                                                                                  24
As of the 3rd of April, $13 billion worth of fiscal measures
had been rolled out across the states and territories

18 July
     © 2019 CoreLogic, Inc. All Rights Reserved.               25
As of the 3rd of April, $13 billion worth of fiscal measures
had been rolled out across the states and territories
   New South Wales - $3.3 billion                                                   Western Australia - $1.60 billion
   • Temporary waiver of payroll tax for eligible businesses                        • Rent relief for commercial tenants in government buildings
   • Deferral of rents for commercial tenants in government buildings               • Energy Assistance Payment (EAP) has been increased to $600
   • $56 million to bring forward the next round of payroll tax cuts                • Payroll tax relief for eligible businesses
   • $80 million to waive fees and charges for small businesses, including for      • A one-off grant of $17,500 for small businesses that pay payroll
      tradespeople                                                                     tax
   • Maintenance work on public assets, including social housing and crown land     • Household fees and charges are deferred until 2021
      fencing

   Victoria - $1.7 billion                                                          Tasmania - $985 million
   • Payroll tax waivers for businesses with annual wages up to $3 million          • $50 million to bring forward maintenance projects
   • Landowners with at least one non-residential property and landholdings up to   • Interest-free loans to affected businesses
       $1 million can defer land tax                                                • Payments to low-income households and payments to
   • Rent relief for commercial tenants in government buildings                        households who need to self-isolate
   • A $500 million support fund for the most impacted sectors
   • $500 million for supporting the deployment of displaced workers

   Queensland - $4 billion                                                          Australian Capital Territory - $337 million
   • Payroll tax refund and relief totaling up to $950 million                      • Easing of taxes to landlords providing rent concessions
   • A $500 million package to train and redeploy workers                           • $20 million fund for simple works on government assets
   • Interest free loans for up to 1 year for the retention of workers              • A $250 cash payment to public housing tenants
   • $1bn industry support package for large businesses making a key contribution   • Household rate rebates and credits to businesses for
      during the crisis                                                                commercial rates
   • $100 million for business electricity bill support

   South Australia - $1 billion                                                     Northern Territory - $115 million
   • Payroll tax relief of up to 6 months for eligible businesses                   • $30 million to incentivize home renovations under the ‘Home
   • Land tax relief                                                                   Improvement Scheme’
   • $300 million ‘Business and Jobs Support Fund’ for businesses affected by       • All Territory businesses will be able to access a $10,000 grant.
      coronavirus                                                                   • Payroll tax exemptions
   • A $500 payment to households receiving government benefits                     • $50 million for a small business survival fund
18 July
     © 2019 CoreLogic, Inc. All Rights Reserved.                                                                                                         26
The federal stimulus has                                                                     However GDP is still forecast
         seen the forecast for                                                                      to drop by 8.5% over the Jun
        unemployment reduce                                                                         quarter and 0.6% through
         from 17% by June to                                                                        the Sep quarter before
             around 9%                                                                              surging 5.2% over Q4
                       Unemployment rate, Australia                                                             Quarterly change in GDP
                                                                17% (forecast prior to         6.0%
17%                                                             JobKeeper stimulus)
                                                                                               4.0%
15%
                                                                                               2.0%
13%
                                                                                               0.0%
11%
                                                                                               -2.0%
9%
                                                                                               -4.0%
7%
                                                                                               -6.0%
5%                                                                                             -8.0%
3%                                                                                            -10.0%
 Dec 90            Dec 95           Dec 00          Dec 05   Dec 10     Dec 15       Dec 20         Dec 90   Dec 96   Dec 02   Dec 08     Dec 14            Dec 20

                                                                                                                                          Source: CoreLogic, Westpac
 18 July
      © 2019 CoreLogic, Inc. All Rights Reserved.                                                                                                                      27
Between lower funding costs, relaxed capital ratios and a
   term funding facility, banks are starting to offer reprieve
   for mortgage holders
                               “All of our home loan customers will be able to pause their repayments for up to six months should
                               they need to.”

                               “Westpac customers who have lost their job or suffered loss of income as a result of COVID-19
                               should contact us for three months deferral on their home loan mortgage repayments, with
                               extension for a further three months available after review.

                               “[Customers can] Pause home loan repayments for up to six months, including a three-month
                               checkpoint.”

                               “[Customers can] Request a deferral of home loan repayments for up to six months, with a review
                               at three months, with interest capitalised”

18 July
     © 2019 CoreLogic, Inc. All Rights Reserved.                                                                                    28
What are real estate agents thinking?
Summary of survey responses from RP Data platform over the past three weeks
The large majority of real estate agents have seen buyer and seller enquiries
more than halve over the two weeks…
Have you noticed a change in the number of                                                                                                                                      Have you noticed a change in the number of
buyer enquiries over the past week?                                                                                                                                             seller enquiries over the past week?

                                                                                                                                                                                         62%
        69%
        68%

                                                                                                                                                                                        59%
                                                                                                                                                                                  36%
  37%

                                                                                                                                                                                                                                                                    23%
                                                                                   24%
                               20%

                                                                                                                                                                                                              17%
                                                                                                                                                                                                              16%
                              17%

                                                                                                                                                                                                             14%

                                                                                                                                                                                                                               14%
                             15%
                                              11%

                                                                                                                                                                                                                             9%

                                                                                                                                                                                                                                                                          8%
                                             9%

                                                                                                                                                                                                                                                                          8%
                                                                                                                                                                                                                                               6%
                                                             6%

                                                                                         6%

                                                                                                                                                                                                                                                                                                                   4%
                                                                                                                                                                                                                            4%

                                                                                                                                                                                                                                              4%

                                                                                                                                                                                                                                                                                               4%
                                                                                         4%
                                            4%

                                                                                                                                                                                                                                                                                                                   3%
                                                                                                                                                                                                                                                                                              3%
                                                                                                                                                             2%
                                                            2%

                                                                                                                                                                                                                                                                                                                                                2%
                                                                                                                                                                                                                                                                                              2%
                                                                                                             2%

                                                                                                                                                                                                                                             1%
                                                            1%

                                                                                                             1%
                                                                                                             1%

                                                                                                                                1%

                                                                                                                                                                                                                                                                                                                               1%

                                                                                                                                                                                                                                                                                                                                               1%
                                                                                                                                                                                                                                                                                                                  1%
                                                                                                                                            0%

                                                                                                                                                            0%
                                                                                                                                0%
                                                                                                                                0%

                                                                                                                                            0%
                                                                                                                                            0%

                                                                                                                                                            0%

                                                                                                                                                                                                                                                                                                                               0%
                                                                                                                                                                                                                                                                                                                               0%

                                                                                                                                                                                                                                                                                                                                               0%
                                                                                                                                Up 10-25%

                                                                                                                                                             Up more than 50%

                                                                                                                                                                                                                                                                                                                   Up 10-25%

                                                                                                                                                                                                                                                                                                                                                Up more than 50%
        Down more than 50%

                              Down 25-50%

                                             Down 10-25%

                                                                                                                                                                                        Down more than 50%

                                                                                                                                                                                                              Down 25-50%

                                                                                                                                                                                                                              Down 10-25%
                                                                                         Relatively steady

                                                                                                             Up less than 10%

                                                                                                                                            Up 25% to 50%

                                                                                                                                                                                                                                                                          Relatively steady

                                                                                                                                                                                                                                                                                               Up less than 10%

                                                                                                                                                                                                                                                                                                                               Up 25% to 50%
                                                              Down less than 10%

                                                                                                                                                                                                                                               Down less than 10%
                                                           Wave 1                   Wave 2                             Wave 3                                                                                                               Wave 1                   Wave 2                              Wave 3

                                                                                                                                                 Wave 1: March 20-23 | Wave 2: March 27-30 | Wave 3: April 3-6
  18 July
       © 2019 CoreLogic, Inc. All Rights Reserved.                                                                                                                                                                                                                                                                                                                 29
What are real estate agents thinking?
Summary of survey responses from RP Data platform over the past three weeks

Expectations around buyer and seller activity look to stabilising

What is your expectation for buyer activity over                                            What is your expectation for seller activity over
the next week?                                                                              the next week?

              77%
                                                                                                     67%
      69%                                                                                      62%

                       51%                                                                                   49%
                                                          46%                                                                               42%

                                                                                                                              29%
                                           26%                                                                                       25%
                                                   23%

                                                                                                                                                              8% 7% 9%
                                                                         5%            4%
                                                                               1%

             Worse                                 Same                       Better                 Worse                          Same                              Better
                                 Wave 1            Wave 2       Wave 3                                               Wave 1          Wave 2         Wave 3

                                                                                                      Wave 1: March 20-23 | Wave 2: March 27-30 | Wave 3: April 3-6
18 July
     © 2019 CoreLogic, Inc. All Rights Reserved.                                                                                                                               30
What are real estate agents thinking?
Summary of survey responses from RP Data platform over the past three weeks

Most agents expect housing values to fall by 10-20% over the next six months,
with more than a quarter expecting a larger decline in values.
To what extent do you expect this                                                                                              Over what time frame do you expect this percentage
pandemic will affect residential                                                                                               change to take place?
property values?                                                                                                               30%                                            31%
                                    35%
                                                                                                                                                          24%
        27%                                                 28%

                                                                                                                                                                                                  10%
                                                                                 7%
                                                                                                     2%                                                                                                                 2%                   1%                    1%
         Decrease more than 20%

                                  Decrease between 10 -

                                                          Decrease bewteen 0 -

                                                                                 Relatively steady

                                                                                                     Increase between 1 - 5%

                                                                                                                                It's already happening

                                                                                                                                                         In the next 1 - 3

                                                                                                                                                                             In the next 3 - 6

                                                                                                                                                                                                 In the next 6 - 9

                                                                                                                                                                                                                     In the next 9 - 12

                                                                                                                                                                                                                                          In the next 12 - 18

                                                                                                                                                                                                                                                                In the next 18 - 24
                                                                                                                                                              months

                                                                                                                                                                                  months

                                                                                                                                                                                                      months

                                                                                                                                                                                                                          months

                                                                                                                                                                                                                                                months

                                                                                                                                                                                                                                                                      months
                                                                  10%
                                          20%

 18 July
      © 2019 CoreLogic, Inc. All Rights Reserved.                                                                                                                                                                                                                                     31
Summary
     •       Most Australian housing markets were generally into the next upswing phase of the cycle
             before the onset of COVID-19
     •       The COVID-19 outbreak presents downside risk for the Australian housing market. New
             information and policy responses are unfolding daily, making it impossible to provide a
             reasonable forecast of capital growth
     •       Property is less volatile and slower to respond to market shocks than equities, and values will
             be susceptible to the state of the labour market in the long term
     •       Transaction activity is already being impacted by low consumer confidence and social
             distancing measures. Australians are likely to temporarily put high commitment decisions on
             hold
     •       The government response should cushion the impact of reduced business activity, and there
             will be more to come, but a recession through the first three quarters of 2020 is highly likely
     •       The depth and duration of this market ‘pause’ depends on how well the virus is contained,
             how long the shutdown period lasts and how long it takes for the economy and sentiment to
             improve.
18 July
     © 2019 CoreLogic, Inc. All Rights Reserved.                                                               32
Disclaimer
In compiling this publication, RP Data Pty Ltd trading as CoreLogic has relied upon information supplied by a number of external sources. CoreLogic does not warrant its accuracy or completeness and to the full extent allowed by law excludes
liability in contract, tort or otherwise, for any loss or damage sustained by subscribers, or by any other person or body corporate arising from or in connection with the supply or use of the whole or any part of the information in this
publication through any cause whatsoever and limits any liability it may have to the amount paid to CoreLogic for the supply of such information.

Queensland Data
Based on or contains data provided by the State of Queensland (Department of Natural Resources and Mines) 2020. In consideration of the State permitting use of this data you acknowledge and agree that the State gives no warranty in relation
to the data (including accuracy, reliability, completeness, currency or suitability) and accepts no liability (including without limitation, liability in negligence) for any loss, damage or costs (including consequential damage) relating to any use of the
data. Data must not be used for direct marketing or be used in breach of the privacy laws.
South Australian Data
This information is based on data supplied by the South Australian Government and is published by permission. The South Australian Government does not accept any responsibility for the accuracy or completeness of the published information
or suitability for any purpose of the published information or the underlying data.
New South Wales Data
Contains property sales information provided under licence from the Land and Property Information (“LPI”). CoreLogic is authorised as a Property Sales Information provider by the LPI.
Victorian Data
The State of Victoria owns the copyright in the Property Sales Data which constitutes the basis of this report and reproduction of that data in any way without the consent of the State of Victoria will constitute a breach of the Copyright Act 1968
(Cth). The State of Victoria does not warrant the accuracy or completeness of the information contained in this report and any person using or relying upon such information does so on the basis that the State of Victoria accepts no responsibility
or liability whatsoever for any errors, faults, defects or omissions in the information supplied.
Western Australian Data
Based on information provided by and with the permission of the Western Australian Land Information Authority (2020) trading as Landgate.
Australian Capital Territory Data
The Territory Data is the property of the Australian Capital Territory. No part of it may in any form or by any means (electronic, mechanical, microcopying, photocopying, recording or otherwise) be reproduced, stored in a retrieval system or
transmitted without prior written permission. Enquiries should be directed to: Director, Customer Services ACT Planning and Land Authority GPO Box 1908 Canberra ACT 2601.
Tasmanian Data
This product incorporates data that is copyright owned by the Crown in Right of Tasmania. The data has been used in the product with the permission of the Crown in Right of Tasmania. The Crown in Right of Tasmania and its employees and
agents:
a) give no warranty regarding the data's accuracy, completeness, currency or suitability for any particular purpose; and
b) do not accept liability howsoever arising, including but not limited to negligence for any loss resulting from the use of or reliance upon the data.

Base data from the LIST © State of Tasmania http://www.thelist.tas.gov.au
                              18 July
                                   © 2019 CoreLogic, Inc. All Rights Reserved.                                                                                                                                                                           33
Get in Touch

Georgia Bice
Sr Professional, Client & Sales Training
CoreLogic

Mobile 0407198696
Georgia.Bice@Corelogic.com.au
You can also read