DIAGNOSING COLORECTAL POLYPS IN THE WILD WITH CAPSULE NETWORKS
←
→
Page content transcription
If your browser does not render page correctly, please read the page content below
DIAGNOSING COLORECTAL POLYPS IN THE WILD WITH CAPSULE NETWORKS
Rodney LaLonde? Pujan Kandel† Concetto Spampinato§ Michael B. Wallace† Ulas Bagci?
?
Center for Research in Computer Vision, University of Central Florida, USA
†
Division of Gastroenterology and Hepatology, Mayo Clinic, Jacksonville, FL, USA.
§
Department of Electrical, Electronics and Computer Engineering, University of Catania, Italy.
arXiv:2001.03305v1 [eess.IV] 10 Jan 2020
ABSTRACT
Colorectal cancer, largely arising from precursor lesions
called polyps, remains one of the leading causes of cancer-
related death worldwide. Current clinical standards require
the resection and histopathological analysis of polyps due to
test accuracy and sensitivity of optical biopsy methods falling
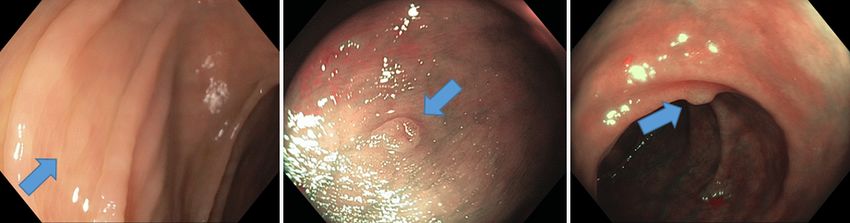
substantially below recommended levels. In this study, we Fig. 1. Typical cases on real-world (‘in-the-wild’) polyp di-
design a novel capsule network architecture (D-Caps) to im- agnosis cases from the Mayo Polyp dataset. Left to right:
prove the viability of optical biopsy of colorectal polyps. hyperplastic, serrated, and adenoma, marked by blue arrows.
Our proposed method introduces several technical novelties
including a novel capsule architecture with a capsule-average
pooling (CAP) method to improve efficiency in large-scale Colorectal polyps are typically classified into one of
image classification. We demonstrate improved results over three categories: hyperplastic, serrated (comprised of sessile
the previous state-of-the-art convolutional neural network serrated adenomas and traditional serrated adenomas), and
(CNN) approach by as much as 43%. This work provides adenomas. Example polyps can be seen in Fig. 1. Ser-
an important benchmark on the new Mayo Polyp dataset, a rated polyps and adenomas are considered premalignant
significantly more challenging and larger dataset than pre- and should be resected during colonoscopy, while hyper-
vious polyp studies, with results stratified across all avail- plastic polyps are considered benign and can safely be left
able categories, imaging devices and modalities, and focus in situ. Unfortunately, existing optical biopsy techniques,
modes to promote future direction into AI-driven colorec- cannot currently be recommended in routine clinical prac-
tal cancer screening systems. Code is publicly available at tice due to test accuracy and sensitivity falling substantially
https://github.com/lalonderodney/D-Caps. below recommended levels [3]. Therefore, current stan-
Index Terms— Capsule Network, Colorectal, Polyp, dards require taking a sample of the polyp and performing
Gastrointestinal, Endoscopy, Diagnosis, Classification histopathological analysis, a somewhat time-consuming and
expensive process. Further, performing polypectomies (i.e.,
biopsy) on non-premalignant polyps is unnecessary, increases
1. INTRODUCTION
procedure-related risks such as perforation and bleeding, and
Among all cancer types, colorectal cancer remains one of the increases procedure-related costs including the cost of histo-
leading causes of cancer-related death worldwide, with the logical analysis for diagnosis. Improvements in colonoscopy
lifetime risk of developing colorectal cancer around 1 in 23 and optical biopsy techniques have been developed [4, 5];
in the United States, accounting for roughly 10% of all cases however, with increased colonoscopy use causing an increase
across genders [1]. The gold standard for colorectal cancer in detected polyps, expecting endoscopists to perform optical
diagnosis is based on the biopsy of colon polyps found dur- diagnosis during colonoscopy screenings might prove too
ing screening (colonoscopy). Due to the vast majority of col- time-consuming to manage in routine clinical practice. There
orectal cancer cases arising from precursor lesions, referred is a high-expectation for artificial intelligence (AI), partic-
to as polyps, the identification and resection of pre-malignant ularly deep learning, approaches to be adopted into clinical
polyps during colonoscopy has been shown to decrease col- settings for earlier and more accurate diagnosis of cancers.
orectal cancer incidence by 40 – 60% [2]. However, small and Research Gap: Previous academic works have achieved
diminutive polyps make up over 90% of polyps detected, with remarkable success in this difficult task, with accuracy scores
less than half of these classified as pre-malignant, making di- just exceeding 90% [6, 7]. However, these methods have
agnosis through ‘optical biopsy’ by colonoscopists difficult. been applied to academic datasets which are highly un-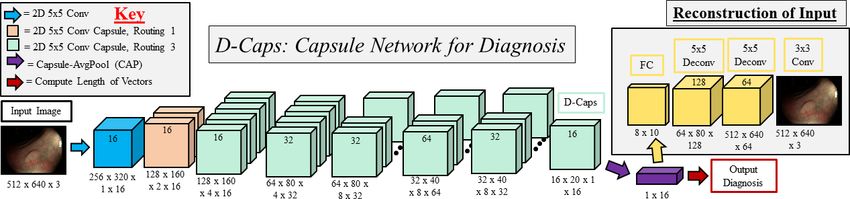
realistic compared to a ‘real-world’ clinical setting. For         extracted the first 3 – 4 layers of an Inception-style network
example, the most popular dataset in the literature is the ISIT-   trained on ImageNet and Places205 and trained an SVM
UMR Multimodal classification dataset [8], containing only         to classify the extracted deep features. The first end-to-
76 polyps. Each polyp is recorded up-close for approximately       end trained network was used in [14], which employed an
30 seconds (nearly 800 videos frames) from multiple angles,        AlexNet style network trained from scratch with data aug-
modalities, and focus modes. Such time-consuming and ideal         mentation to classify polyps as hyperplastic, adenomas, none,
videos cannot be expected in more realistic ‘in the wild’ (i.e.,   or unsuitable image. Most recently, [6] used a pretrained
real-world) clinical settings. To address this discrepancy be-     Inceptionv3 network to classify hyperplastic polyps from
tween ideal academic datasets and real-world examples, we          adenomas. For comparison in this study, we employ the
performed experiments on the significantly more challeng-          Inceptionv3 network as our baseline (see section 4).
ing Mayo Polyp classification dataset, collected at the Mayo           Capsule networks were popularized in [11], where a small
Clinic, Jacksonville by [9] with institutional review board ap-    capsule network (CapsNet) comprised of a single layer of
proval. A total of 963 polyps from 552 patients were col-          convolutional capsules without routing and a single layer of
lected, where one image per imaging type of each polyp are         fully-connected capsules with dynamic routing were used to
chosen by expert interpreters. This dataset is extremely chal-     classify digits and small images. The network produced state-
lenging, having only single images per imaging mode per            of-the-art results on MNIST and relatively strong results on
polyp, large inter-polyp variation (e.g., scale, skew, illumina-   CIFAR-10. Several notable capsule network studies have fol-
tion), and often only a single imaging mode provided, while        lowed; specific to medical imaging applications, [15] em-
also containing far more polyps collected from more patients       ployed CapsNet for a number of medical and non-medical
than all previous AI-driven diagnosis studies in this area.        tasks, and show capsule networks may generalize better given
    To accomplish our task and improve the viability of op-        limited data. To classify brain tumor types, [16] also em-
tical biopsy of colorectal polyps, we design a novel capsule       ployed an unmodified CapsNet. In [10], the authors locally
network (D-Caps). Capsule networks provide equivariance to         constrain the dynamic routing algorithm to allow for deeper
affine transformations on the input through encoding orien-        networks and share transformation matrices across members
tation information in vectorized feature representations, and      of the grid while forming an encoder-decoder style network
we hypothesize that a capsule network can better model the         for pathological lung segmentation. In our proposed work,
high intra-class variation present in the Mayo Polyp dataset       we follow this style of dynamic routing and transformation
and provide superior results to a deep CNN. Our method in-         matrix sharing, while introducing capsule-average pooling, to
troduces several technical novelties including (i) a novel deep    allow for our deep network classification architecture D-Caps.
capsule network architecture based on the locally-constrained
routing introduced in [10], (ii) a capsule-average pooling
                                                                                          3. METHODS
(CAP) technique which allows us to perform classification on
large image sizes, where the original fully-connected capsules     The proposed D-Caps is illustrated in Fig 2. Briefly, input
of [11] are far too computationally expensive to fit in GPU        to the network is a 512 × 640 × 3 color image taken during
memory, and (iii) improves the results over CNNs such as           colonoscopy screening. This image is sent through an initial
Inceptionv3 (Iv3) [12] employed the previous state-of-the-art      convolutional layer which downsamples the image and ex-
[6] by a significant margin, while also reducing the amount        tracts the basic low-level feature information (edges and cor-
of parameters used by as much as 95%. We provide extensive         ners). This output is reshaped to be treated as a convolutional
analysis of results stratified across polyp categories, scanner    capsule with a single capsule type, whose feature vectors are
types, imaging modalities, and focus modes to establish a          then passed to the first convolutional capsule layer, referred to
new benchmark on this challenging, unexplored, large-scale         as the primary capsules and a second capsule type is added.
dataset and promote future direction into the use of AI-driven     All further layers are convolutional capsule layers with locally
colorectal cancer screening systems.                               connected dynamic routing, until the capsule-average pooling
                                                                   layer and reconstruction sub-network.
                   2. RELATED WORK                                     In each capsule layer, there are individual capsules which
                                                                   form a grid. Then, at each layer, there are multiple sets of
For computer-aided diagnosis (CAD) studies, colorectal             these grids which form the capsule types. Capsules within a
polyp diagnosis is fairly limited. In [13], a bag-of-features      lower layer are referred to as child capsules and in a higher
representation was constructed by a hierarchical k-means           layer being routed to as parent capsules. The locally con-
clustering of scale invariant feature transform (SIFT) de-         nected dynamic routing works by forming prediction vectors
scriptors. These features were then used to train an SVM           over a kernel of the child capsules centered at the location of
classifier for classifying hyperplastic polyps vs adenomas.        the set of parent capsule types. For every parent capsule at a
The approach by [7] was the first to incorporate deep learning     given (x, y) position, a set of prediction vectors are formed
to diagnose hyperplastic polyps vs adenomas. The authors           via the multiplication between a locally-defined window and
Fig. 2. D-Caps: Diagnosis capsule network architecture. Routing 1 or 3 refers to the number of routing iterations performed.
a transformation matrix which is shared across the spatial di- mapping from output to input, in order to help preserve a
mension (but not the capsule type dimension). These trans- better approximation of the distribution of the input space.
formation matrices act analogous to affine transformation in Without the inverse mapping, the network will be prone to
feature space, allowing for a strong notion of equivariance to only learn the most common modes in the training dataset.
input features. Once prediction vectors are formed for a given We show in an ablation study this reconstruction significantly
(x, y) location, and therefore set of parent capsules, the mod- helps the accuracy of our approach, which is not possible with
ified dynamic routing algorithm then routes all child capsules a standard CNN that only represents features as scalars.
to all parents capsules only at that given spatial location.
The capsule-average pooling (CAP) layer computes the
4. DATASETS & EXPERIMENTS
spatial average of capsule activation vectors to reduce the di-
mensionality of the features. Each capsule type computes an
Experiments were performed on a Mayo Polyp dataset, col-
element-wise mean across the height and width dimensions
lected at the Mayo Clinic, Jacksonville by [9] with an insti-
of the capsule grid, preserving the length of the capsule vec-
tutional review board approval. A total of 552 patients were
tors in each capsule type. Since, in our application, we are
included in this study with 963 polyps collected. Polyps were
computing a binary classification, we have one capsule type
collected from both standard and dual-focus colonoscopes.
in the final convolutional capsule layer, which transforms to
The dual-focus colonoscope contains near and far modes for
a 1D vector of length k, in our case k = 16. More explicitly,
both white light (WL) and narrow-band imaging (NBI) set-
if we have n capsule types, each with h × w grids of capsule
tings, referred to as WL-N, WL-F, NBI-N, and NBI-F, respec-
vectors of length a, we compute
tively. Challenging images of each polyp type are chosen by
1 XX i expert interpreters (one per imaging type).
pia = ch,w,a , ∀i ∈ {1, 2, ..., n}. (1)
h×w Three sets of experiments were conducted using stratified
w h
10-fold cross validation. In the first set, images were split
In previous approaches, a fully-connected capsule layer is into two categories, hyperplastics and adenomas (with ser-
used to predict the final class-activation vectors. This be- rated adenomas excluded). In the second set, the serrated ade-
comes computationally infeasible with any reasonable sized nomas were included in the adenoma class. In the third set,
GPU memory when working with large-scale images and images were split between hyperplastics and serrated adeno-
number of classes. By utilizing our CAP layer, we are able mas with the adenoma images excluded. The results of these
to dramatically increase the size of the images we work with experiments are presented in the following section. Addition-
beyond the likes of MNIST, CIFAR-10 and smallNORB. The ally, we conducted three rounds of ablation experiments with
D-Caps architecture shown in Fig. 2 contains only 1.3 million results presented at the polyp level: i) varying the amount
parameters, as compared to 24 million in Inceptionv3, a rela- of dynamic routing iterations performed inside D-Caps, ii)
tive reduction of 95%, while achieving higher performance. removing the reconstruction regularization sub-network, and
To decide a class score: the magnitude of each vector is iii) evaluating D-Caps performance on an ‘ideal’ subset of 95
computed, where the longest vector is chosen as the predic- NBI-N images selected by participating physicians for homo-
tion. In the case where multiple images of the same polyp geneity to see performance in more ideal cases of using near-
were given, the votes for each images are averaged, weighted focus NBI colonoscopes with good scale/centering on polyps.
by the relative confidence of the vote being cast. Reconstruc- All networks were trained and tested on a single Titan X
tion of the input is then performed via a dense layer followed GPU using the Keras and TensorFlow frameworks. Both In-
by two deconvolutions and a final convolution. The recon- ceptionv3 and D-Caps were trained from scratch using the
struction serves the purpose of providing a learned inverse Adam optimizer at its default settings. A batch size of 8 wasTable 1. Classifying Hyperplastic vs Adenoma polyps measured by accuracy (acc), sensitivity (sen), and specificity (spe),
where -F and -N denote far and near focus, respectively.
Method All Images All Polyps NBI NBI-F NBI-N WL WL-F WL-N Near Far
Acc. % 63.66 65.53 56.69 53.37 60.95 68.81 72.48 67.65 67.57 69.64
D-Caps Sen. % 65.26 71.12 54.23 51.97 59.74 74.06 75.63 70.86 70.19 73.62
Spe. % 60.00 53.79 61.98 57.14 64.29 57.38 63.79 58.49 60.66 59.02
Acc. % 54.28 56.23 52.49 58.65 53.33 55.41 55.50 58.33 57.66 58.48
Iv3 Sen. % 54.83 63.18 57.69 59.21 56.49 54.89 53.75 58.94 63.35 63.19
Spe. % 53.00 41.67 41.32 57.14 44.64 56.56 60.34 56.60 42.62 45.90
Table 2. Classifying Hyperplastic vs Adenoma and Serrated polyps measured by accuracy (acc), sensitivity (sen), and
specificity (spe), where -F and -N denote far and near focus, respectively.
Method All Images All Polyps NBI NBI-F NBI-N WL WL-F WL-N Near Far
Acc. % 59.81 60.95 60.36 60.09 63.59 54.39 55.86 56.67 58.52 62.01
D-Caps Sen. % 61.39 63.19 60.00 59.24 65.22 59.21 64.02 58.60 60.12 67.86
Spe. % 56.00 56.06 61.16 62.50 58.93 43.44 32.76 50.94 54.10 45.90
Acc. % 51.21 48.10 45.27 51.17 46.54 51.88 59.01 50.95 47.60 50.22
Iv3 Sen. % 53.49 50.35 41.11 50.96 46.58 56.68 66.46 58.60 51.79 55.36
Spe. % 45.75 43.18 54.55 51.79 46.43 40.98 37.93 28.30 36.07 36.07
Table 3. Classifying Hyperplastic vs Serrated polyps measured by accuracy (acc), sensitivity (sen), and specificity (spe),
where -F and -N denote far and near focus, respectively.
Method All Images All Polyps NBI NBI-F NBI-N WL WL-F WL-N Near Far
Acc. % 60.91 58.04 57.85 55.00 60.00 54.14 52.63 52.54 67.21 66.67
D-Caps Sen. % 65.00 54.55 70.00 60.00 71.43 54.55 100.00 50.00 57.14 60.00
Spe. % 60.50 58.33 56.76 54.29 57.58 54.10 49.06 52.83 68.52 67.21
Acc. % 51.45 40.54 45.63 44.90 50.00 48.08 41.86 45.00 40.00 39.62
Iv3 Sen. % 63.64 66.67 83.33 66.67 100.00 16.67 66.67 33.33 100.00 66.67
Spe. % 50.62 39.05 43.30 43.48 46.81 50.00 40.00 45.95 36.17 38.00
used for Inceptionv3 and 4 for D-Caps due to memory con- 50.61%, 65.53%, 45.97%, and 50.86% accuracy at the polyp
straints on capsules. The loss function for all networks was level for 2, 3, 4, and 5 routing iterations respectively. Remov-
a binary cross-entropy. All code for reproducing experiments ing the reconstruction sub-network obtained 56%, 50%, and
are made publicly available. 55% accuracy at the for experiments 1 – 3 respectively, an
average 8% decrease. Lastly on the ideal subset of physician
chosen images, we obtained an accuracy of 82% for hyper-
5. RESULTS & DISCUSSION plastic vs adenoma. These experiments show the dynamic
routing and reconstruction both contribute to the overall per-
The results of the three sets of experiments in presented in formance of our model, while the latter experiment provides
Tables 1 - 3. For all experiments, we present results at several strong evidence that with further improvements in both cap-
levels of analysis: All Images presents results for every image sule network algorithms and screening technology, AI-driven
present in the dataset, while all other results are a weighted approaches can prove viable for raising optical biopsy tech-
average taken across all votes for a given polyp (and imaging niques to clinical practice standards. Our work provides an
modality) to give a final diagnosis score. Looking at the All important baseline for future studies on the extremely chal-
Polyps columns, we can see D-Caps outperforms Inceptionv3 lenging Mayo Polyp dataset, and contributes further evidence
in terms of relative accuracy increases of 17%, 27%, and 43% that given limited data with high intra-class variation, capsule
for experiments 1 – 3 (of increasing difficulty) respectively. networks can significantly outperform deep CNNs.
In our routing iteration ablation experiment, we obtained6. REFERENCES [12] Christian Szegedy, Vincent Vanhoucke, Sergey Ioffe,
Jon Shlens, and Zbigniew Wojna, “Rethinking the in-
[1] American Cancer Society, “Key statistics ception architecture for computer vision,” in Proceed-
for colorectal cancer,” www.cancer.org/ ings of the IEEE conference on computer vision and pat-
cancer/colon-rectal-cancer/about/ tern recognition, 2016, pp. 2818–2826.
key-statistics.html, 2018.
[13] Yoko Kominami et al., “Computer-aided diagnosis of
[2] Hermann Brenner, Christian Stock, and Michael colorectal polyp histology by using a real-time image
Hoffmeister, “Effect of screening sigmoidoscopy and recognition system and narrow-band imaging magnify-
screening colonoscopy on colorectal cancer incidence ing colonoscopy,” Gastrointestinal Endoscopy, vol. 83,
and mortality: systematic review and meta-analysis of no. 3, pp. 643 – 649, 2016.
randomised controlled trials and observational studies,”
BMJ, vol. 348, 2014. [14] Michael F Byrne et al., “Real-time differentiation
of adenomatous and hyperplastic diminutive colorectal
[3] Colin J Rees et al., “Narrow band imaging optical diag- polyps during analysis of unaltered videos of standard
nosis of small colorectal polyps in routine clinical prac- colonoscopy using a deep learning model,” Gut, 2017.
tice: the detect inspect characterise resect and discard 2
(discard 2) study,” Gut, vol. 66, pp. 887–895, 2017. [15] Amelia Jiménez-Sánchez, Shadi Albarqouni, and Diana
Mateus, “Capsule networks against medical imaging
[4] Joep E G IJspeert et al., “Development and validation data challenges,” in Intravascular Imaging and Com-
of the wasp classification system for optical diagnosis of puter Assisted Stenting and Large-Scale Annotation of
adenomas, hyperplastic polyps and sessile serrated ade- Biomedical Data and Expert Label Synthesis, pp. 150–
nomas/polyps,” Gut, vol. 65, no. 6, pp. 963–970, 2016. 160. Springer, 2018.
[5] Yasushi Sano et al., “Narrow-band imaging (nbi) mag- [16] Parnian Afshar, Arash Mohammadi, and Konstantinos N
nifying endoscopic classification of colorectal tumors Plataniotis, “Brain tumor type classification via cap-
proposed by the japan nbi expert team,” Digestive En- sule networks,” in 2018 25th IEEE International Con-
doscopy, vol. 28, no. 5, pp. 526–533, 2016. ference on Image Processing (ICIP). IEEE, 2018, pp.
3129–3133.
[6] Peng-Jen Chen, Meng-Chiung Lin, Mei-Ju Lai, Jung-
Chun Lin, Henry Horng-Shing Lu, and Vincent S.
Tseng, “Accurate classification of diminutive colorectal
polyps using computer-aided analysis,” Gastroenterol-
ogy, vol. 154, no. 3, pp. 568 – 575, 2018.
[7] Ruikai Zhang et al., “Automatic detection and classifi-
cation of colorectal polyps by transferring low-level cnn
features from nonmedical domain,” IEEE Journal of
Biomedical and Health Informatics, vol. 21, no. 1, pp.
41–47, Jan 2017.
[8] Pablo Mesejo et al., “Computer-aided classification of
gastrointestinal lesions in regular colonoscopy,” IEEE
Transactions on Medical Imaging, vol. 35, no. 9, pp.
2051–2063, Sept 2016.
[9] Michael B. Wallace et al., “Accuracy of in vivo col-
orectal polyp discrimination by using dual-focus high-
definition narrow-band imaging colonoscopy,” Gas-
trointestinal Endoscopy, vol. 80, pp. 1072 – 1087, 2014.
[10] Rodney LaLonde and Ulas Bagci, “Capsules for object
segmentation,” arXiv preprint arXiv:1804.04241, 2018.
[11] Sara Sabour, Nicholas Frosst, and Geoffrey E Hinton,
“Dynamic routing between capsules,” in Advances
in Neural Information Processing Systems, 2017, pp.
3856–3866.You can also read