Stability Assessment of High and Steep Cutting Rock Slopes with the SSPC Method
←
→
Page content transcription
If your browser does not render page correctly, please read the page content below
Hindawi
Advances in Civil Engineering
Volume 2021, Article ID 8889526, 10 pages
https://doi.org/10.1155/2021/8889526

Research Article
Stability Assessment of High and Steep Cutting Rock
Slopes with the SSPC Method

 Hongliang Tao,1 Guangli Xu,1 Jingwen Meng,2 Ronghe Ma,3 and Jiaxing Dong 3

 1
 Faculty of Engineering, China University of Geosciences, Wuhan, Hubei 430074, China
 2
 Wuhan City Colledge, Wuhan, Hubei 430083, China
 3
 Faculty of Electric Power Engineering, Kunming University of Science and Technology, Kunming, Yunnan 650500, China

 Correspondence should be addressed to Jiaxing Dong; dong1986@kust.edu.cn

 Received 7 August 2020; Revised 27 January 2021; Accepted 7 April 2021; Published 20 April 2021

 Academic Editor: Luis Neves

 Copyright © 2021 Hongliang Tao et al. This is an open access article distributed under the Creative Commons Attribution License,
 which permits unrestricted use, distribution, and reproduction in any medium, provided the original work is properly cited.
 The stability of high rock slopes has become a key engineering geological problem in the construction of important projects in
 mountainous areas. The original slope stability probability classification (SSPC) system, presented by Hack, has made obvious
 progress and been widely used in rock slope stability analysis. However, the selection and determination of some evaluation
 indexes in the original SSPC method are usually subjective, such as intact rock strength and weathering degree. In this study, the
 SSPC method based on geological data obtained in the prospecting tunnels was presented and applied. According to the field
 survey and exploration of the prospecting tunnels, the weathering degree of the slope rock mass was evaluated. The empirical
 equation for the maximum stable height of the slope was applied to the slope stability evaluation in the presented SSPC method.
 Then, the slope stability probability of numerous cutting slopes in the sandstone unit was evaluated using the presented system.
 Results of the Geostudio software based on the limited equilibrium analysis of the investigated slopes were compared with the
 results obtained by the SSPC method. The results indicate that the SSPC method is a useful tool for the stability prediction of high
 and steep rock slopes.

1. Introduction and excavation methods. At present, rock mass quality as-
 sessment, kinematical, analytical, and numerical analyses are
The geomorphology in southwest China changes rapidly the common methods in rock slope stability assessments [6].
over short distances; in this region, large-scale projects such However, the estimation of the parameters needed for the
as hydropower stations were constructed, with complex abovementioned methods is always challenging due to the
geological conditions [1–3]. In recent years, the heights of heterogeneity of jointed slope masses [7, 8]. Since 1970,
cutting rock slopes can be as high as 300–500 m. For in- many rock mass classification systems that consider many
stance, the maximum cutting slope height at the Dagangshan affecting factors, such as the slope geometry, presence of
project located in the Dadu River is 530 m, and the maxi- water or water pressures, weathering effects, and excavation
mum cutting slope height at the Xiaowan project located in methods, have been proposed or modified and applied in the
the Lancang River is 700 m [4]. Cutting slopes are prone to quantitative stability prediction of rock engineering [9–13].
fail due to the disturbance on original geometry and strength The existing rock mass classification systems are becoming
[5], and assessing the stability of these rock slopes is an increasingly popular and are used in research on slopes
important and difficult task, due to ensure slope safety in worldwide as an accurate and useful tool for the rock slope
period of construction and running. stability assessment. In fact, shortcomings exist in most of
 Slope stability is affected by numerous factors, such as the mentioned classification systems; for instance, failure
geological conditions, rock mass mechanical parameters, modes of the slopes are always not taken into account, and
joint parameters, slope geometry, groundwater condition, only single-point data are used, but the slopes always have
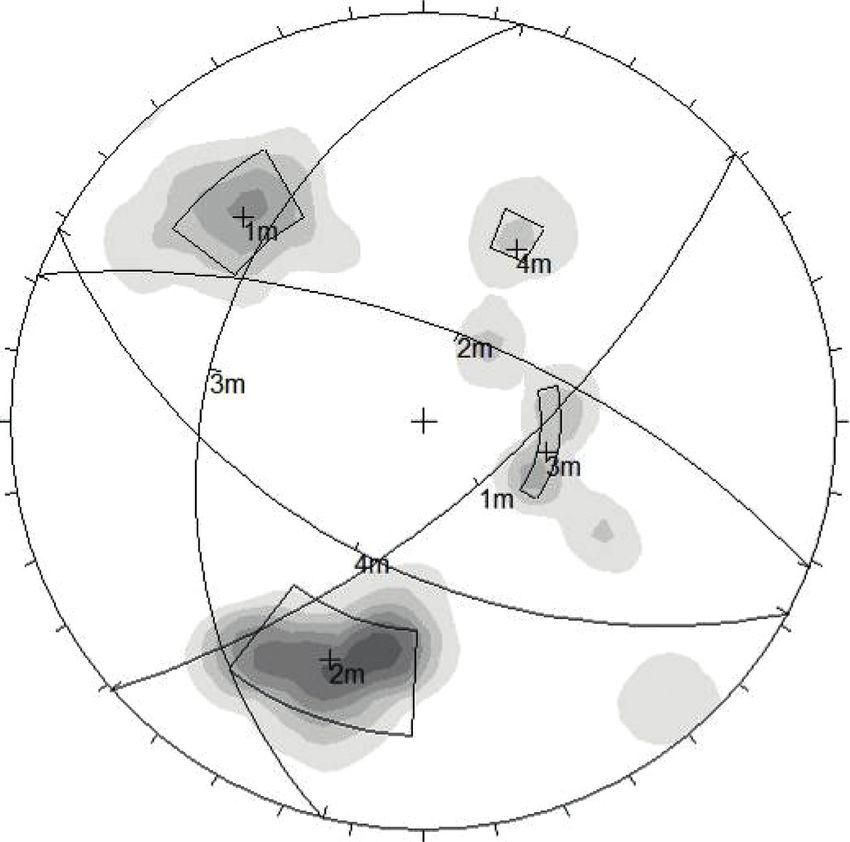
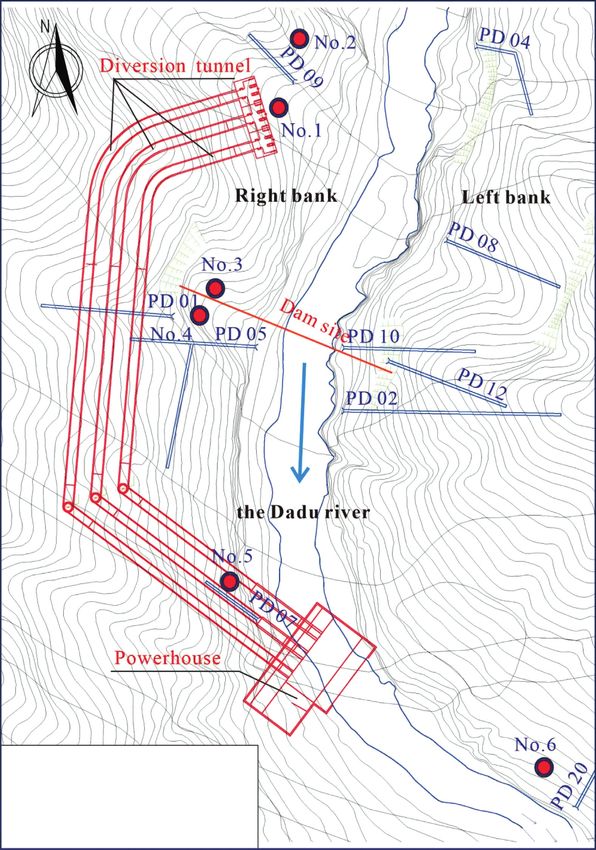
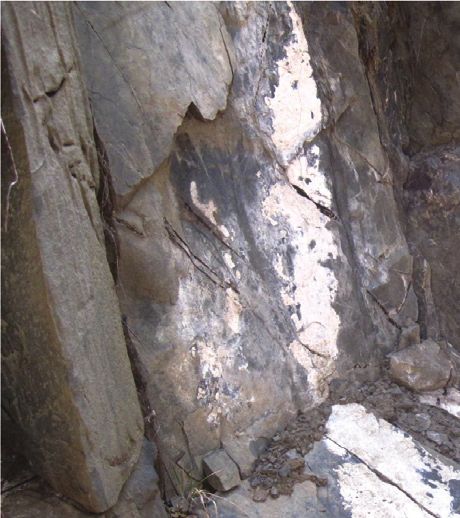
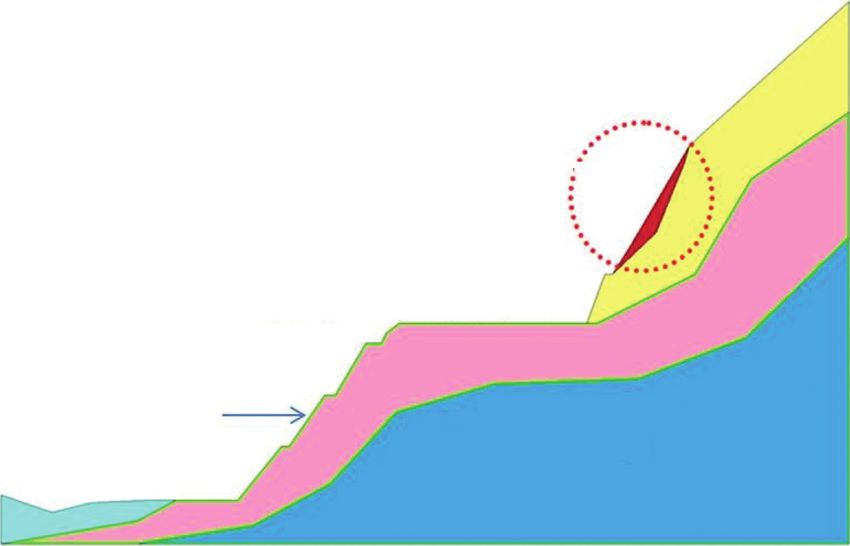
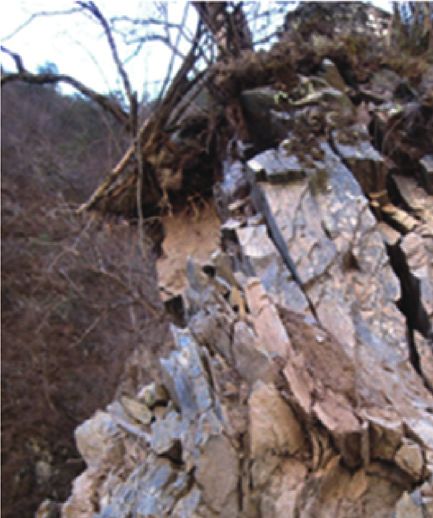
2 Advances in Civil Engineering

large-scale and complex geological conditions. In addition, A total of 1276 discontinuities were collected and described,
slope rock mass and exposure rock mass are always not and the main joint sets are shown in Table 1, and a contour
distinctly differentiated in the existing approach [14]. To plot with Dips software [21] is presented in Figure 3.
overcome the limitations previously, Hack (1998) [15] Discontinuities develop in the studied slopes, collected
presented a new rock slope stability assessment approach in the corresponding prospecting tunnels, and natural ex-
(SSPC, slope stability probability classification), which has posures were divided into statistical and geological domi-
been used worldwide, especially in the research of road nant joints based on the field survey and statistical analysis,
slopes in Spain [16], New Zealand, India [17], and Turkey as shown in Table 2.
[5, 6, 14] with good results. As a matter of fact, the method is Roughness and waviness parameters are of great im-
generally suitable for slopes with a height of less than or portance for the stability of discontinuity-controlled failures.
equal to 45 m. Moreover, discontinuity property survey, An increasing roughness profile of a discontinuity results in
weathering degree, and intact rock strength estimation in- a substantial rise in the discontinuity shear strength. The
volve high subjectivity and arbitrariness [14, 17, 18]. For sandstone unit in the study area commonly presents straight
these reasons, the SSPC method is rarely used in the high and and rough discontinuity surfaces. In addition, the roughness
steep cutting rock slopes [19]. of the same discontinuities can be classified as slightly curved
 In this study, key points of the SSPC method are in- (i � 2–4°) in large-scale roughness profiles and undulating
troduced. Then, discontinuity surveys were carried out and (amplitude roughness >2–3 mm) in small-scale roughness
data were collected and analyzed at four different pro- profiles with respect to the SSPC system. Commonly, no
specting tunnels, and discontinuity properties were obtained infill material in the discontinuities can be observed in
and input for the SSPC assessment system; stability of six sandstone, whereas surface staining can be observed. In
proposed cutting slopes of the supported project is evaluated addition, no karst phenomenon can be observed.
using the SSPC method.
 3. The SSPC System and Its Application
2. Project Background The original SSPC system was presented by Hack (1998) [15]
2.1. Study Area. The supported hydropower project is lo- for probabilistic stability assessments of rock slopes, and a
cated upstream of the Dadu River, Sichuan Province, China, related detailed description can be found in some literature
which flows through a valley with V shape. The reservoir has [14, 16]. In this paper, only key points and the steps of
a normal pool level (NPL) of 2600 m, and the river’s natural stability assessment are introduced.
water level was approximately 2597 m. The basic seismic
intensity of this area is VII degrees, indicating a relatively 3.1. Key Points of the SSPC. The SSPC method encompasses a
stable area. Slopes in this area were mainly in the meta- three-step evaluation of the slope stability probability, ac-
morphic sandstone unit with upper Triassic and Jurassic cordingly identifying three different rock masses (ERM,
bonobo groups. Rock fall phenomena and rock failure exposure rock mass; RRM, reference rock mass; SRM, slope
(sliding, toppling, and wedge failure seen in Figure 1) rock mass) during evaluation [16].
commonly occurred at natural slope in this region. In this
 (a) ERM: exposed rock mass, which is directly observed
paper, stability of six proposed cutting rock slopes seen in
 on the exposure site of a natural or an old engi-
Figure 2 are studied, including tunnel-face slope (no. 1),
 neering slope
intake slope (no. 2), the abutment slope (no. 3), slope of the
toe board (no. 4), back-slope of the powerhouse (no. 5), and (b) RRM: reference rock mass, which is the theoretical
slope of the powerhouse in the left bank (no. 6) of the Dadu and imaginary fresh rock mass, undistributed due to
River. In Figure 2, four prospecting tunnels (PD09, PD01, the excavation
PD07, and PD20) were arranged to find out the geological (c) SRM: slope rock mass, which is the existing or
conditions of the abovementioned slopes. Specifically, dis- proposed new slope to be cut (see Figure 4)
continuity and rock mass properties, weathering degree, and (d) Two types of slope failure modes (orientation in-
other related parameters can be obtained by surveys and dependent and orientation dependent) and the
tests in the prospecting tunnels. corresponding stability probability estimation
 methods are considered, with clear and simple
 needed-data collecting procedure
2.2. Discontinuity Properties. The discontinuity properties of
the sandstone unit along the study area were determined by Figure 5 is the schematic diagram of the SSPC method; in
means of sample windows, scan lines performed at 5 lo- the SSPC system, the slope stability probability can be
cations, and other data that were collected by discontinuity evaluated on the basis of parameters obtained from the
statistics exposed in the 4 prospecting tunnels (PD09, PD01, investigated exposure rock mass, such as the intact rock
PD07, and PD20, seen in Figure 2) distributed in the dam strength (IRS), discontinuity spacing (SPA), and condition
site. Accordingly, parameters of discontinuity such as the of the discontinuities (CD). Obviously, the parameters
spacing, persistence, roughness, infill condition, and obtained on the outcrop are significantly affected by
weathering degree were obtained with the suggestions of the weathering or excavation disturbances. The parameters of
International Society for Rock Mechanics (ISRM 2007) [20]. the ERM with different weathering and excavation
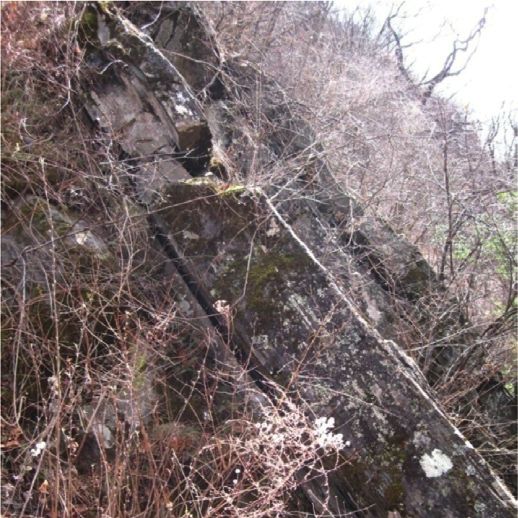
Advances in Civil Engineering 3

 J1 : N30°E/NW ∠85°

 Bedding
 N75°W/SW ∠70~75°

 J2 : N55°E/NW ∠45°

 (a) (b) (c)

 Figure 1: Failure of the natural slopes investigated: (a) sliding, (b) toppling, and (c) wedge failure.

 PD 007 No. 5

 Prospecting tunnel Studied slope and
 and number its number

 Figure 2: Distribution of the prospecting tunnels in the dam site.
4 Advances in Civil Engineering

Table 1: Characteristics of the surveyed discontinuity sets in the SPA � (Factor 1) ×(Factor 2) ×(Factor 3), (2)
study area.
 Dip direction Dip Trace length Spacing SPA
Discontinuity
 (°) (°) (m) (m)
 RSPA � . (3)
 (WE × ME)
1 318 66
Advances in Civil Engineering 5

 N

 Fisher
 concentrations
 % of total per 1.0 % area

 0.00 ~ 1.50%
 1.50 ~ 3.00%
 3.00 ~ 4.50%
 4.50 ~ 6.00%
 6.00 ~ 7.50%
 7.50 ~ 9.00%
 W E 9.00 ~ 10.50%
 10.50 ~ 12.00%
 12.00 ~ 13.50%
 13.50 ~ 15.00%

 No bias correction
 Max. conc. = 10.2159%

 Equal angle
 upper hemisphere
 1276 poles
 1276 entries

 S
 Figure 3: Contour plot of the field-surveyed discontinuity in the study area.

 Table 2: Characteristics of the main discontinuity sets in the surveyed slopes.
 Statistical dominant discontinuity Geological dominant discontinuity Note
Slope Joint
 Dip direction (°) Dip (°) Spacing (m) Dip direction (°) Dip (°) Spacing (m) Prospecting tunnel
 B1 217 70 0.2–0.5 190 70 0.2–0.5
1 J1 113 32 0.1–0.3 75 45 0.1–0.3
 J2 138 83 0.1–0.3 305 55 0.1–0.3 PD09
 B1 217 70 0.2–0.5 215 75 0.3–0.6
2 J1 113 32 0.1–0.3 130 15 0.2–0.4
 J2 138 83 0.1–0.3 130 80 0.2–0.4
 B1 194 66 0.1–0.5 190 60 0.1–0.5
3 J1 122 54 0.2–0.6 120 55 0.2–0.6
 J2 318 69 0.2–0.6 335 60 0.2–0.6 PD01
 B1 194 66 0.1–0.5 185 65 0.2–0.6
4 J1 122 54 0.2–0.6 125 60 0.3–0.7
 J2 318 69 0.2–0.6 330 65 0.3–0.7
 B1 205 68 0.1–0.4 205 70 0.1–0.4
5 J1 78 38 0.1–0.4 70 25 0.1–0.3 PD07
 J2 327 64 0.2–0.4 315 60 0.3–0.4
 B1 195 75 0.2–0.5 200 50 0.1–0.4
6 J1 325 45 0.1–0.3 140 85 0.2–0.4 PD20
 J2 300 85 0.2–0.6 35 45 0.3–0.7

Meanwhile, the discontinuity condition of the slope (STC) is For sliding failure, a relationship graph (see
determined by equation (11). Figure 7(a)) between the STC and AP is employed to
 assess the occurrence probability of the slope. Further-
 AP � arctan cos αs − αj tan βj , (10) more, a relationship graph of the STC, AP, and dipslope
 (see Figure 7(b)) is employed to evaluate the occurrence
 0.5 probability of the slope for toppling failure. In this paper,
 STC � RTC × 1.452 − 1.220 × e− SWE . (11)
 the probability results and the necessary parameters for
6 Advances in Civil Engineering

 Slope rock mass

 Slightly weathered

 ed
 er
 Proposed cutting slope

 ath
 we
 Fresh

 ly
 Prospecting tunnels

 ate
 er
 River od Exposure rock mass
 M

 Reference rock mass

Figure 4: Sketch of exposures in rock masses of various degrees of weathering and different types of excavation indicating the concept of the
reference rock mass.

 Exposure rock mass (ERM):
 Parameters significant for slope stability assessment:
 A. Material properties:
 1. Intact rock strength (IRS)
 2. Susceptibility to weathering (WE)
 B. Discontinuities:
 3. Orientation of discontinuity (dip/dip direction)
 4. Spacing between discontinuity sets (m)
 C. Discontinuity properties:
 5. Roughness large scale (Rl) and small scale (Rs)
 6. Infilling materials (Im)
 7. Karst (Ka) (may not be present)

 Exposure-specific parameters Factors used to establish the
 1. Method of excavation
 theoretical fresh rock mass
 2. Degree of weathering
 Reference rock mass (RRM):
 Same parameters which have been collected for:
 Exposure rock mass to be used to calculate parameters of
 reference rock mass unit for slope stability assessment;
 1. Angle of friction (fmass)
 2. Cohesion (Cohmass)
 Slope-specific parameters:
 1. Method of excavation to be used
 Factors used to assess the influence of
 2. Expected degree of weathering
 excavation method and future weathering
 at the end of engineering life
 time of slope
 Slope rock mass (SRM):
 Slope rock mass parameters significant for slope stability:
 1. Material properties: strength, susceptibility to weathering
 Slope geometry calculation: 2. Discontinuities: orientation sets (spacing) or single
 1. Orientation of the slope 3. Discontinuity properties: roughness, infill, karst
 (dip and strike of the slope)
 2. Height of the slope (Hslope)
 3. Maximum slope height (Hmax)

 Probabilistic slope stability assessment

 Figure 5: Flowchart of the SSPC method (modified after Canal A and Akin M, 2016).
Advances in Civil Engineering 7

 1

 1 discontinuity set
 0.9

 0.8

 0.7 2 discontinuity sets
 0.65 Minimum spacing J3
 0.61 Maximum spacing
 0.6 B1 3 discontinuity sets
 0.58 Minimum spacing
 Factor J2 Intermediate spacing
 0.5 Maximum spacing

 0.4

 0.3

 0.2

 0.1
 0.1 1 10 20 35 100 1000
 Discontinuity spacing (cm)
 Figure 6: Factor determination graph in accordance with the discontinuity spacing [16].

 Table 5. A final assessment of the slopes (see Table 5) was
 Table 3: Weathering degree and its classification. performed by choosing the largest failure probability de-
 termined via the two analyses.
Degree Joint number in a 5 m section Value of WE
Complete 50–60 0.35 ⎪
 ⎧ SIRS � RIRS × SWE,
 ⎪
 ⎪
High 40–50 0.62 ⎪
 ⎨
Moderate-high 30–40 0.77 ⎪ SSPA � RSPA × SWE × SME, (12)
Moderate-slight 20–30 0.92 ⎪
 ⎪
 ⎪
 ⎩
Slight 10–20 0.95 SCD � RCD × SWE,
Fresh 0–10 1.00
 ϕSRM � (SIRS × 0.2417) ×(SSPA × 52.12) ×(SCD × 5.779),

 CSRM � (SIRS × 94.27) ×(SSPA × 28629) ×(SCD × 3593),
probability calculations in the study area are summarized
in Table 4. (13)
 4
 ⎪
 ⎧
 ⎪ 1.6 × 10 × CSRM × sin dipslope × cos ϕSRM
 ⎪
 ⎪ Hmax−SSPC � ,
3.4. Orientation-Independent Stability Assessment of the SRM. ⎪
 ⎨ 1 − cos dipslope − ϕSRM
Parameters needed in the calculation of stability of slope ⎪
 ⎪
 ⎪
 ⎪ σ ci GSI(−0.0003mi +0.0483)
rock mass such as SIRS, SSPA, and SCD are determined as ⎪
 ⎩ Hmax−Huang � 0.00651 + 0.00037m1.5
 i × e .
equation (12), in which the RRM values are corrected by the c
the weathering degree (SWE) and method of excavation (14)
(SME) for existing natural/excavated slopes.
 Accordingly, the friction angle and cohesion of the slope
mass are defined by equation (13). Obviously, an orienta- 4. Discussion
tion-independent stability problem cannot occur under the
condition of the dipslope ≤ ϕSRM of the investigated slopes. Results seen in Tables 4 and 5 show that the calculated slopes
However, the stability condition is evaluated on the basis of were defined as stable. In addition, we also calculated the
the maximum slope height (Hmax) [14, 16]. The orientation- slope stability by the Geostudio software according to the
independent slope stability probability can be easily deter- step of the building model, parameters inputting, and cal-
mined by the chart seen in Figure 8. However, the assess- culating. Figure 9 is the typical simulation model of slope 2;
ment method of the maximum slope height (Hmax) was compared with the outcome through the Geostudio software
modified by Li et al. [19] if the height of slope is larger than (Table 6), the results prove the validity and convenience of
45 m. In this study, we assessed the Hmax using the modified the SSPC methods introduced above. In addition, it is im-
formulation Hmax-Huang. The necessary parameters and portant selecting the suitable discontinuities for assessment
probability calculations in the study area are summarized in of the stability probability in the SSPC method. In this study,
8 Advances in Civil Engineering

 95%
 1.00 1.00
 70%
 50% 95%
 30%
 5%
 70%
 0.80 0.80 50%
 30%

 5%
 0.60 0.60
 STC

 STC
 B1 B1
 0.45
 0.40 0.40
 J2 J2
 0.27 0.27 J3
 0.20 0.20

 0.00 0.00
 0 10 20 25.58 30 40 44.98 50 60 70 80 90 0 10 14.32 20 24.28 30 38.78 40 50 60 70 80 90
 AP (°) -90-AP + slopedip (°)
 (a) (b)

 Figure 7: Flowchart of the SSPC methods determined by sliding and toppling (slope 1). (a) Sliding. (b) Toppling.

 Table 4: Orientation-dependent stability probabilities of discontinuities at the typical investigated slopes.
Slope Discontinuity STC AP Sliding probability Toppling probability Slope stability probability
 B1 0.45 −65.78 100% 95%
1 J2 0.27 25.58 70% 100% 70%
 J3 0.27 73.80 100% 100%
 B1 0.45 58.23 100% 100%
2 J1 0.27 21.88 95% 100% 95%
 J2 0.27 82.28 100% 100%
 B1 0.61 −42.41 100% >95%
3 J1 0.65 45.65 >95% 100% 95%
 J2 0.42 −54.08 100% 95%
 B1 0.61 −42.41 100% >95%
4 J1 0.65 45.65 >95% 100% 95%
 J2 0.42 −54.08 100% 95%
 B1 0.76 −60.26 100% >95%
5 J1 0.65 37.73 >95% 100% >95%
 J2 0.65 −24.76 100% >95%
 B1 0.76 67.37 >70% 100%
6 J1 0.65 9.85 >95% 100% >70%
 J2 0.65 81.33 100% 100%

 10

 95 %

 90 %
 Hmax/Hslope

 70 %
 1 50 %
 30 %
 10 %
 0.45 5%

 0.31

 0.1
 0.68 0.73
 0.0 0.2 0.4 0.6 0.8 1.0
 φSRM/slopedip

 Figure 8: Flowchart of the SSPC methods determined by orientation-independent failure (slope 1).
Advances in Civil Engineering 9

 Table 5: Summary of the orientation-independent stability probability at the investigated slopes.
Slope Hslope (m) dipslope (°) CSRM (MPa) ϕSRM (°) Hmax (m) Hmax/Hslope ϕSRM /dipslope Slope stability probability
1 105 63 0.584 37.84 1322.56 12.60 0.60 >95%
2 105 63 1.525 53.71 5044.85 48.05 0.85 >95%
3 180 73 1.030 39.27 2010.88 11.17 0.54 >95%
4 180 73 1.385 45.02 3045.16 16.92 0.62 >95%
5 90 73 0.648 30.89 1322.56 14.70 0.42 >95%
6 65 73 0.882 41.43 1849.98 28.46 0.57 >95%

 The most dangerous sliding surface 1

 Material Unit weight(kN/m3) c (kPa) φ (°)
 1 26.26 584 37.84
 2 26.46 836 44.84
 3 27.44 1525 53.71

 1: The moderate-weathered and strong-unloading rok mass
 2: The moderate-weathered and strong-unloading rok mass
 3: The fresh rock mass
 2

 Excavated slope
 3

 Figure 9: Typical simulation model of slope 2 using the Geostudio software.

 Table 6: Summary of the stability assessment result using the Geostudio software and the SSPC method.
 Safety factor values under different
Slope conditions Stability assessment result by Geostudio Stability probability by the SSPC method
 Normal Rainstorm Earthquake
1 1.325 1.198 1.206 Stable 70%
2 1.188 1.301 1.377 Stable 95%
3 1.476 1.266 1.376 Stable 95%
4 1.408 1.285 1.293 Stable 95%
5 1.480 1.279 1.290 Stable >95%
6 1.282 1.405 1.135 Stable >70%

statistical dominant discontinuities obtained in the pro- Firstly, three sets of joints were presented in each studied
specting tunnels and natural outcrops were selected, but not slope. To overcome bias, laboratory data of the uniaxial
the geological dominant discontinuities only obtained and compressive strength and rock mass strength parameters can
determined by the natural outcrops. be used for SSPC directly.
 Secondly, statistically dominant discontinuities obtained in
 the prospecting tunnels and natural outcrops were suitable for
5. Conclusions the SSPC method, but not the geological dominant disconti-
In this study, the SSPC method based on geological data nuities only obtained and determined by the natural outcrops.
obtained in the prospecting tunnels was presented, and the Finally, the formula of the critical slope height is opti-
slope stability probability of very high (50–300 m) and steep mized and applied to the stability evaluation, and the SSPC
(60°–75°) cutting slopes in the sandstone unit was investi- method based on geological data obtained in the prospecting
gated using the proposed system. The following conclusions tunnels can be accurately applied to the stability evaluation
can be drawn. of high and steep rock slopes.
10 Advances in Civil Engineering

Data Availability [12] Y. C. Shi, Z. W. Wang, G. R. Wan, Z. Y. Wang, Q. Y. Chen,
 and S. C. Tang, “Study of mountain highway slope mass
The data used to support the findings of this study are in- rating,” Chinese Journal of Rock Mechanics and Engineering,
cluded within the article. vol. 24, no. 6, pp. 939–944, 2005.
 [13] L. Pantelidis, “Rock slope stability assessment through rock
 mass classification systemsfication systems,” International
Conflicts of Interest Journal of Rock Mechanics and Mining Sciences, vol. 46, no. 2,
 pp. 315–325, 2009.
The authors declare that they have no conflicts of interest. [14] X. Z. Li and Q. Xu, “Application of the SSPC method in the
 stability assessment of highway rock slopes in the Yunnan
 province of China,” Bulletin of Engineering Geology and the
Acknowledgments Environment, vol. 75, no. 2, pp. 551–562, 2016.
 [15] H. R. G. K. Hack, Slope Stability Probability Classification,
This study was sponsored by the Program of the Yunnan
 SSPCp. 258, 2nd edition, ITC, Enschede, The Netherlands,
Natural Science Foundation (no. 2015FD008) and Talent 1998.
Development Program of Kunming University of Science [16] R. Hack, D. Price, and N. Rengers, “A new approach to rock
and Technology (no. KKSY201504022). The authors thank slope stability-a probability classification (SSPC),” Bulletin of
Zhenluo Shen for his contribution to the resolution im- Engineering Geology and the Environment, vol. 62, no. 2,
provement of the figures in this article. pp. 167–184, 2003.
 [17] P. Lindsay, J. Anderson, F. Bourke, R. N. Campbell, and
 L. Clarke, “Predicting slope stability in open pit gold and coal
References mines,” in Proceedings of the New Zealand Minerals and
 Mining Conference Proceedings, pp. 29–31, Wellington, New
 [1] R. Huang, “Main characteristics of high rock slopes in
 Zealand, October 2000.
 southwestern China and their dynamic evolution,” Advances
 [18] L. Xiu-zhen, T. Rong-zhi, and G. Yan, “Modification of slope
 in Earth Science, vol. 20, no. 3, pp. 292–297, 2005.
 stability probability classification and its application to rock
 [2] S. W. Song, X. M. Feng, B. Y. Xiang et al., “Research on key
 slopes in hydropower engineering regions,” Geologia Cro-
 technologies for high and steep rock slopes of hydropower
 atica, vol. 72, pp. 71–80, 2019.
 engineering in Southwest China,” Chinese Journal of Rock
 [19] X. Z. Li, J. M. Kong, and S. W. Li, “Stability probability
 Mechanics and Engineering, vol. 30, no. 1, pp. 1–22, 2011.
 classification method for rock slope in hydropower engi-
 [3] J. X. Dong, G. L. Xu, and S. S. Zhang, A New Proposed Rockfall
 neering region,” Chinese Journal of Rock Mechanics and
 Hazard Rating System for Surrounding Slope in Large Hy-
 Engineering, vol. 30, no. 2, pp. 4025–4032, 2011.
 dropower Project, pp. 1327–1340, EJGE, New York, NY, USA,
 [20] ISRM (International Society for Rock Mechanics), “The
 2014.
 complete ISRM suggested methods for rock characterization,
 [4] X. Y. Jing, Y. Wu, Y. Zeng et al., “Application of two di-
 testing and monitoring: 1974-2007: suggested methods pre-
 mensional limit equilibrium method in high slope engi-
 pared by the commission on testing methods,” International
 neering,” Design of Hydroelectric Power Station, vol. 36, no. 4,
 Society for Rock Mechanics, vol. 15, 2007.
 pp. 1–3, 2020.
 [21] Rocscience Inc. (1998) Dips v.5.0-graphical and statistical
 [5] T. Ersoz and T. Topal, “Assessment of rock slope stability with
 analysis of orientation data. Available online at: http://www.
 the effects of weathering and excavation by comparing de-
 rocscience.com.
 terministic methods and slope stability probability classifi-
 [22] I. Das, S. Sahoo, C. van Westen, A. Stein, and R. Hack,
 cation (SSPC),” Environmental Earth Sciences, vol. 77, no. 547,
 “Landslide susceptibility assessment using logistic regression
 pp. 1–18, 2018.
 and its comparison with a rock mass classification system,
 [6] A. Canal and M. Akin, “Assessment of rock slope stability by
 along a road section in the northern Himalayas (India),”
 probabilistic-based Slope Stability Probability Classification
 Geomorphology, vol. 114, no. 4, pp. 627–637, 2010.
 method along highway cut slopes in Adilcevaz-Bitlis (Tur-
 [23] R.-H. Ma, HSSPC Method and its Application in High and
 key),” Journal of Mountain Science, vol. 13, no. 11,
 Steep Rock Slope in Hydropower Engineering, Kunming
 pp. 1893–1909, 2016.
 University of Science and Technology, Kunming, China, 2020.
 [7] Z. C. Tang, Q. Z. Zhang, and J. Peng, “Effect of thermal
 treatment on the basic friction angle of rock joint,” Rock
 Mechanics and Rock Engineering, vol. 53, no. 4, pp. 1973–1990,
 2020.
 [8] Z. Tang and Y. Jiao, “Choosing appropriate appraisal to
 describe peak spatial features of rock joint profiles,” Inter-
 national Journal of Geomechanics, vol. 20, no. 4, Article ID
 04020021, 2020.
 [9] Z. T. Bieniawski, “Engineering classification of jointed rock
 masses,” Journal of the South African Institution of Civil
 Engineering, vol. 15, no. 12, pp. 343–353, 1973.
[10] Z. Chen, “Recent developments in slope stability analysis,” in
 Proceedings of the 8th International Congress ISRM,
 pp. 1041–1048, Tokyo, Japan, May 1995.
[11] A. Singh, “Frhi — a system to evaluate and mitigate rockfall
 hazard in stable rock excavations,” J Div Civ Eng Inst Eng
 (India), vol. 85, pp. 62–75, 2004.
You can also read