Motilal Oswal NASDAQ 100 ETF - Motilal Oswal AMC
←
→
Page content transcription
If your browser does not render page correctly, please read the page content below

© Copyright 2010, The NASDAQ OMX Group, Inc. All rights reserved.

Motilal Oswal NASDAQ 100 ETF

Product Labeling

This product is suitable for investors who are seeking*

•   Return that corresponds generally to the performance
    of the NASDAQ 100 Index, subject to tracking error

•   Investment in equity securities of NASDAQ 100 Index
What is the NASDAQ-100 Index?
The top 100 domestic and international non-financial
securities listed on The NASDAQ Stock Market® based on
market capitalization.
One of the greenest major large cap U.S. equity benchmark
indices.
Long-established holdings include companies that have a
legacy of leadership and innovation.
Does NOT contain securities of financial companies, including
investment companies
Technology stocks have evolved from creating new and niche
consumer products to a group of companies upon which
every industry and sector have become dependent. The
companies within the NASDAQ-100 represent the true
innovators of the modern economy bringing disruption to the
old economy on a global basis.
Today, Apple, Microsoft, Google, Facebook and other
NASDAQ-100 components have become the global leaders of
business and are the new industrials.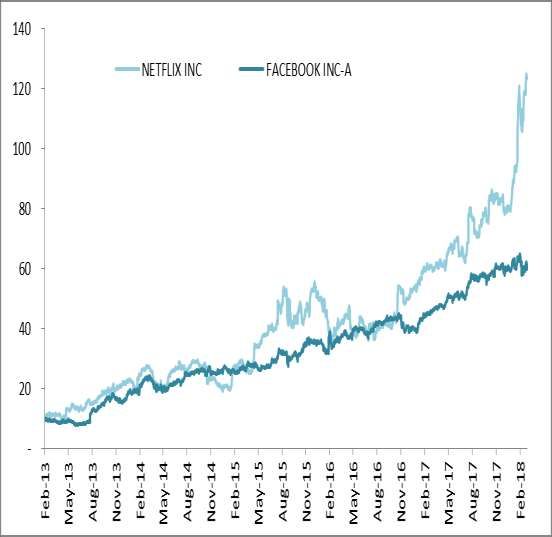
Criteria and Index Rebalancing

   The security must be exclusively listed on NASDAQ, with an average daily trading volume of at least 200,000
                                                    shares

                                     The security must be of a non-financial company
 If the security is of a foreign issuer, it must have listed options or be eligible for listed options trading (A foreign issuer is
                                       determined based on its country of incorporation).

                                                     Review / Rebalancing
Annual Ranking Review (Reconstitution of components) – 3rd         Quarterly Review and Monthly Component Market Weight
Friday of December                                                 Analysis

                                       RIC Diversification Test – 25/5/50 percent rule
  Modified Capitalization-Weighting. If
                                             If collective weight of stocks >5% exceeds    Reset by compressing all stock weights
 highest weighted stock exceeds 24.0%,
                                                48.0%, reset proportionally to 40.0%           toward 1.0% (average weight)
           reset to 20.0% or..

                              Diversification enhanced, relative position preserved

                               Source: NASDAQ OMX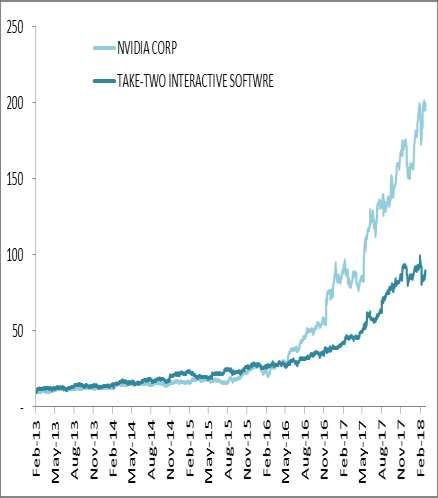
NASDAQ-100 Industry Weights by Market Value

                                         Number of                      Aggregate Market
          Industry                                                                                               Weight of Mkt Value
                                         Companies                          Value ($)

Information Technology                            45                               4,794,959,455,494                              61%

Consumer Discretionary                            25                               1,742,469,998,448                              22%
Health Care                                       20                                  747,816,373,091                             10%
Consumer Staples                                   5                                  334,687,204,271                              4%

Industrials                                        7                                  162,852,207,444                              2%

Telecommunication
                                                   2                                    63,595,207,504                             1%
Services
 Total                                          104                     7,846,380,446,252                                       100%

Data as on 28th February 2018. Source: NASDAQ Economic Research based on the Industry Classification Benchmark (ICB) maintained by FTSE and Dow Jones
Indexes.
NASDAQ-100 Index Performance : Relative
                                                                                                                                                 Russell
                                                                                          NASDAQ-100            S&P 500        Dow Jones
                                                                  Period                                                                           2000
                                                                                             Index               Index           Index
    Even in this tough economy,                                                                                                                   Index
    the NASDAQ-100 Index                               1 year                                 28.59%             14.82%          20.26%          9.07%
    provides outperformance
                                                       3 year                                 15.55%             8.84%           11.33%          7.03%
    over the S&P 500 Index, the
    Dow Jones Index and Russel                         5 year                                 20.13%             12.36%          12.23%         10.66%
    2000 Index.                                        10 year                                14.65%             7.38%            7.39%          8.22%
                                                      From inception (1/31/85)                12.83%             8.54%            9.38%          8.11%

                                                                                  Price/Earnings                                                  27.8
                                                                                  Dividend Yield                                                  0.96
                                                                                  Volume                                               176.79 Million
                                                                                  Index Market Cap                                      $ 8.16 Trillion
                                                                                  Divisor                                                    1144.11
                                                                                  Currency                                                        USD
                                                                                  Composite Volume                                     635.23 Million
Index past performance is not indicative of future results and is not representative of any particular investment product. Does not include dividends. As 30-day
rolling annualized volatility. Volatility is annualized standard deviation of daily price returns. NDX is a modified-capitalization-weighted index. Component true
market values are used. Returns are calculated on USD. Source: Bloomberg. Data as on 28th February 2018
NASDAQ-100 Fundamentals
CY CY CY
CY CY CY CY CY CY CY CY CY
Calendar Year 2018 2019 2020
2009 2010 2011 2012 2013 2014 2015 2016 2017
Est Est Est
Valuation Metrics
Price/Earnings 24.51 18.83 14.69 16.75 21.57 22.00 23.11 23.25 25.04 21.15 18.68 16.60
Price/Earnings, Positive 22.08 18.43 14.54 16.16 21.17 20.55 21.86 22.30 23.94 20.94 18.68 16.60
Price/Earnings before XO 31.64 18.74 14.68 16.86 21.39 22.04 23.84 24.18 28.44
Price/Book Value 3.55 3.64 3.12 3.21 4.13 4.49 4.46 4.24 5.23 5.35 4.71 4.09
EV/Sales 2.29 2.23 1.86 2.01 2.71 2.86 2.94 2.95 3.48 3.45 3.17 2.93
EV/EBIT 20.34 12.92 10.01 11.67 15.79 15.94 16.85 17.75 19.68
EV/EBITDA 13.67 10.08 8.01 9.12 11.92 11.74 12.68 12.66 14.41 12.92 11.74 10.63
Dividend Yield 0.66 0.70 1.02 1.39 1.27 1.28 1.17 1.24 1.05 1.01 1.11 1.29
Fundamentals
Gross Margin 41.85 42.80 44.26 43.26 43.20 44.03 44.17 45.02 45.18
Operating Margin 11.28 17.20 18.35 17.18 16.97 17.78 17.31 16.72 17.54
Profit Margin 7.82 13.12 13.82 13.11 13.44 14.18 12.48 12.31 12.11
Return on Assets 6.27 11.33 11.61 10.26 9.96 10.31 8.45 7.83 7.40 10.72 11.00 11.50
Return on Equity 12.30 21.49 22.72 20.60 20.55 22.87 19.20 18.86 18.47 24.70 26.11 29.89
Values Rebased to INR. All growth CAGR (Compounded Annualised Growth Rate). Source: Internal Analysis and Bloomberg. Past performance may or may not be achieved in the
future.*Data as of 28th February 2018NASDAQ-100 Index performance
America’s Darling Stocks: Even in this tough economy, the NASDAQ-100 provides
outperformance over the S&P 500 Index. Period 31st Dec 2002 – 31st Dec 2017.
CAGR NASDAQ-100 S&P 500 Index NIFTY Index
1 Year 25.67% 12.21% 18.17%
2 Years 24.85% 15.84% 22.55%
3 Years 17.70% 10.86% 5.63%
4 Years 18.25% 11.38% 13.70%
5 Years 24.56% 16.51% 13.00%
7 Years 22.72% 16.66% 10.14%
10 Years 20.38% 12.75% 7.22%
15 Years 16.00% 10.39% 16.47%
CAGR: Compounded Annual Growth Rate. Source: Internal Analysis and Bloomberg Data – Values Rebased to INR. Data as on 28th February 2018.
Past performance may or may not be achieved in the futureGrowth 1995 to 2018: CNX Nifty and NASDAQ-100 INDEX
400
NIFTY
350 NASDAQ 100
300
250
200
150
100
50
-
Nov-96
Oct-97
Jun-01
Apr-03
Mar-04
Oct-08
Jun-12
Apr-14
Mar-15
Jan-95
Sep-98
Feb-05
May-13
Feb-16
Jan-17
Dec-95
Aug-99
May-02
Jul-00
Jan-06
Dec-06
Nov-07
Sep-09
Aug-10
Jul-11
Dec-17
All Index values converted to applicable INR USD exchange rate and values rebased to INR 10000 on 1 st Jan, 1995 Data Source: Bloomberg; Data as on 28th
February 2018. Missing values for holidays taken as previous closing index values. Past performance may or may not be achieved in the futureGrowth 1985 to 2018: Sensex and NASDAQ-100 INDEX
3,000
Sensex
NASDAQ 100
2,500
2,000
1,500
1,000
500
-
Apr-94
Oct-10
Feb-85
Oct-88
Sep-89
Jun-92
Mar-95
Oct-99
Jun-03
Apr-05
Mar-06
Jun-14
Apr-16
Mar-17
Jan-86
Dec-86
Nov-87
Aug-90
May-93
Feb-96
Jul-91
Jan-97
Dec-97
Nov-98
Sep-00
Aug-01
May-04
Feb-07
Jul-02
Jan-08
Dec-08
Nov-09
Sep-11
Aug-12
Feb-18
Jul-13
May-15
All Index values converted to applicable INR USD exchange rate and values rebased to INR 10000 on 31st Jan, 1985. Data Source: Bloomberg; Data as
on 28th February 2018. Missing values for holidays taken as previous closing index values Past performance may or may not be achieved in the futureLow correlations over 10 years with all Indian segments
DIVERSIFY YOUR PORTFOLIO!
INDIA US EUROPE ASIA-PACIFIC
DOW
Security NIFTY NIFTY HANG
NIFTY NASDAQ JONES
MIDCAP NEXT S&P DAX FTSE NIKKEI SENG
50 100 INDUS.
100 50 500 100 225 (HIS)
STOCK AVG
NIFTY 50 1.00
NIFTY MIDCAP
INDIA 0.95 1.00
100
NIFTY NEXT 50 0.95 0.98 1.00
NASDAQ 100
0.64 0.57 0.58 1.00
STOCK
US DOW JONES
0.62 0.57 0.56 0.85 1.00
INDUS. AVG
S&P 500 0.66 0.60 0.60 0.91 0.97 1.00
DAX 0.70 0.66 0.66 0.81 0.81 0.86 1.00
Europe
FTSE 100 0.67 0.63 0.62 0.81 0.83 0.87 0.87 1.00
NIKKEI 225 0.63 0.63 0.63 0.71 0.70 0.74 0.76 0.73 1.00
ASIA-PACIFIC
HANG SENG (HIS) 0.74 0.70 0.72 0.72 0.70 0.73 0.75 0.81 0.70 1.00
Correlation of monthly returns; Period - from Feb 2008 to Feb 2018. Source: Calculated from Bloomberg Data – NDX value rebased to INR.
Correlation of 20 day rolling returns. Past correlations may not be observed in the futureGrowth with diversification examples
Inherent diversification benefits
with growth
Facebook
Facebook, Inc. operates a social
networking website. The Company
website allows people to communicate
with their family, friends, and coworkers.
Facebook has grown 31 % p.a in the past
3 years and 46% p.a in the past 5 years.
Netflix Inc. (E-Commerce Discretionary)
Netflix Inc. is an Internet subscription
service for watching television shows and
movies.
Netflix Inc. has grown 63% p.a CAGR in the
past 3 years and 61% p.a CAGR in the past
5 years.
Past performance may or may not be achieved in the future.
Source: Bloomberg Data as on 28th February 2018Growth with diversification examples
Inherent diversification benefits with growth
NVIDIA Corp
NVIDIA Corporation designs, develops, and markets three
dimensional (3D) graphics processors and related
software. The Company's products provide interactive 3D
graphics to the mainstream personal computer market.
NVIDIA Corp has grown 122% p.a in the past 3 years and
80% p.a in the past 5 years.
Take-Two Interactive Software, Inc.
Take-Two Interactive Software, Inc. develops, markets,
distributes, and publishes interactive entertainment
software games and accessories. The Company's products
are for console systems, handheld gaming systems and
personal computers and are delivered through physical
retail, digital download, online, and cloud streaming
services..
Take-Two Interactive Software, Inc. has grown 62% p.a
CAGR in the past 3 years and 50% p.a CAGR in the past 5
years.
Past performance may or may not be achieved in the future.
Source: Bloomberg Data as on 28th February 2018Motilal Oswal NASDAQ 100 ETF
1. India’s 1st US Equity based ETF
a. Rupee denominated investment
b. does not fall under foreign investment cap of $200k.
2. Indian market hours access – Motilal Oswal NASDAQ 100 trades during Indian
market hours.
a. Real-time iNAV published
3. Investment:
a. Passive Investing: no discretion with fund manager.
b. Transparent portfolio.
c. Listed on NSE and BSE.
4. A mutual fund scheme with the convenience of real time liquidity and prices
a. Low cost structure: Total Expense Ratio (TER) of 1% p.a.
Traditional investment products have TER > 2% p.a.
a. No loads (no entry load, no exit load)
5. Taxed as ‘investment other than equity oriented fund’ (i.e. debt taxation
with/without indexation benefits).
6. Fund Manager: Mr. Swapnil P. Mayekar
7. Mr. Mayekar has 10 years of experience in the financial services industry. He has
been part of fund management & product development team for Motilal Oswal
Asset Management Company Limited (Mutual Fund) for last 5 years. He has done
his post-graduation in Commerce (Finance Management) from University of
Mumbai.
For further details, please refer to the Scheme Information Document (SID)Motilal Oswal NASDAQ 100 ETF Portfolio
Sector Allocation Top 10 Holdings
Software & Services 33.83%
Technology Hardware & Equipment 16.19%
Retailing 14.32% Name of
Sr. No. Weightage
Semiconductors & Semiconductor 11.19% Instrument
Pharmaceuticals Biotechnology 7.31%
Media 4.97% 1 Apple 11.61%
Health Care Equipment & Services 2.36% 2 Amazon.com 9.24%
Food Beverage & Tobacco 2.34%
3 Microsoft Corporation 9.21%
Food & Staples Retailing 1.92%
4 Facebook 5.48%
Consumer Services 1.88%
Transportation 1.12% 5 Alphabet INC-Class C 4.95%
Telecommunication Services 0.80% 6 Alphabet INC-Class A 4.23%
Automobiles & Components 0.75%
7 Intel Corporation 2.96%
Capital Goods 0.52%
Commercial & Professional Services 0.44% 8 Cisco Systems 2.82%
Consumer Durables & Apparel 0.15% 9 Comcast Corporation 2.17%
Cash & Equivalent -0.08% 10 NVIDIA Corporation 1.89%
Data as on 28th February 2018
Industry Classification is as per Global Industry Classification Standard (GICS).About Motilal Oswal NASDAQ 100 ETF
Scheme Name Motilal Oswal NASDAQ 100 ETF (MOFN100)
Date of Allotment March 29 2011
Type of Scheme
An open ended scheme replicating NASDAQ 100 Index NAV (INR) Rs 439.4468
The Scheme seeks investment return that Latest AUM (28th February 2018) Rs 75.30 crore
corresponds (before fees and expenses) generally to
the performance of the NASDAQ-100 Index, subject to
Investment Objective Tracking Error* 0.15%(Annualised)
tracking error. However, there can be no assurance
or guarantee that the investment objective of the
Total Expense Ratio^ 1.50% p.a.
Scheme would be achieved.
Benchmark NASDAQ-100 Index
Standard Deviation 13.22 (Annualised)
On NSE & BSE: Investors can buy/sell units of the
Scheme in round lot of 1 unit and in multiples
thereof. Sharpe Ratio# 0.82 (Annualised)
Continuous Offer
Directly with the Mutual Fund: Investors can buy/sell
units of the Scheme only in creation unit size i.e. Portfolio Turnover Ratio 0.19
100,000 units and in multiples thereafter
Beta 0.97
NSE Symbol/BSE ISIN Code INF247L01031
N100
Code
Entry Load N. A. *Against the benchmark with NASDAQ 100 Total Return Index
Bloomberg Code MOSTNDX ^Year-to-date
Reuters Code N100.NS or N100.BO Exit Load NIL # Risk free returns based on 365-days T bill cut-off of 6.05% as on the last
auction. (Data as on 28th February 2018)Disclaimer DISCLAIMER: This presentation has been prepared and issued on the basis of internal data, publicly available information and other sources believed to be reliable. The information contained in this document is for general purposes only and not a complete disclosure of every material fact and terms and conditions and features of Motilal Oswal NASDAQ 100 ETF (MOFN100). The information / data herein alone is not sufficient and shouldn’t be used for the development or implementation of an investment strategy. It should not be construed as investment advice to any party. All opinions, figures, charts/graphs, estimates and data included in this presentation are as on date and are subject to change without notice. While utmost care has been exercised while preparing this document, Motilal Oswal Asset Management Company Limited does not warrant the completeness or accuracy of the information and disclaims all liabilities, losses and damages arising out of the use of this information. The statements contained herein may include statements of future expectations and other forward-looking statements that are based on our current views and assumptions and involve known and unknown risks and uncertainties that could cause actual results, performance or events to differ materially from those expressed or implied in such statements. Readers shall be fully responsible/liable for any decision taken on the basis of this presentation. No part of this document may be duplicated in whole or in part in any form and/or redistributed without prior written consent of the Motilal Oswal Mutual Fund/ Motilal Oswal Asset Management Company Limited. Readers should before investing in the Scheme make their own investigation and seek appropriate professional advice. Statutory Details: Constitution: Motilal Oswal Mutual Fund has been set up as a trust under the Indian Trust Act, 1882. Trustee: Motilal Oswal Trustee Company Limited. Investment Manager: Motilal Oswal Asset Management Company Ltd. Sponsor: Motilal Oswal Securities Ltd. Scheme Classification & Investment Objective: Motilal Oswal NASDAQ 100 ETF (MOFN100), an open ended scheme replicating the NASDAQ 100 Index that seeks investment return that corresponds (before fees and expenses) generally to the performance of the NASDAQ-100 Index, subject to tracking error. Asset Allocation: Securities constituting NASDAQ-100 Index: 95%-100%; Overseas Debt and Money market instruments and cash at call, mutual fund schemes or exchange traded funds based on NASDAQ-100 Index: 0-5%. Load: Entry Load: Nil Exit Load: Nil Terms of Issue: Minimum Application Amount: During NFO, Rs. 10,000/- and in multiples of Re. 1/- each. Ongoing Basis, On the Exchange: The units of the Scheme are proposed to be listed on the Capital Market Segment of National Stock Exchange of India Ltd. (NSE) and Bombay Stock Exchange Ltd. (BSE). On the Exchange, the units of the Scheme can be purchased/sold in minimum lot of 1 unit and in multiples thereafter. Directly with the Fund: The minimum number of units of the Scheme that investors can create/redeem in exchange of portfolio deposit and cash component is 100,000 units and in multiples thereof. Face Value & Issue Price: Offer of units having face value of Rs. 10/- per unit for cash at a premium approximately equal to the difference between the face value of Rs. 10/- each and allotment price i.e. 1/1000th of the value of NASDAQ-100 Index during the New Fund Offer and at NAV based prices during continuous offer. Investor Benefits and General Services: During continuous offer, sale and redemption of units of the Scheme would be at NAV based prices on all business days. NAVs to be declared on all business days. Risk Factors: (1) All Mutual Funds and securities investments are subject to market risks and there can be no assurance that the Scheme’s objectives will be achieved (2) As the price/value/interest rates of the securities in which the Scheme invests fluctuates, the Net Asset Value (NAV) of the Scheme may go up or down depending upon the factors and forces affecting the securities market (3) Past performance of the Sponsor/AMC/Mutual Fund and its affiliates does not indicate the future performance of the Scheme and may not provide a basis of comparison with other investments (4) Motilal Oswal NASDAQ 100 ETF (MOFN100) is only the name of the Scheme and does not in any manner indicate either the quality of the Scheme, its future prospects and returns. Investors are therefore urged to study the terms of offer carefully and consult their Investment Advisor before they invest in the Scheme (5) The Sponsor is not responsible or liable for any loss or shortfall resulting from the operation of the Mutual Fund beyond the initial contribution made by it of an amount of Rs. 1 Lac towards setting up of the Mutual Fund (6) The present Scheme is not a guaranteed or assured return Scheme. (7) Investment in the scheme shall be subject to various other risk factors including but not limited to risk associated with investment in foreign securities, derivatives, currency risk, exchange rate risk, tracking error risk, etc. Disclaimer of NASDAQ-100: NASDAQ®, OMX®, NASDAQ OMX®, NASDAQ-100®, and NASDAQ-100 Index®, are registered trademarks of The NASDAQ OMX Group, Inc. (which with its affiliates is referred to as the “Corporations”) and are licensed for use by MOAMC. Motilal Oswal NASDAQ 100 ETF (the Product) have not been passed on by the Corporations as to their legality or suitability. The Product are not issued, endorsed, sold, or promoted by the Corporations. The Corporations make no warranties and bear no liability with respect to the product. Disclaimer of NSE: It is to be distinctly understood that the permission given by NSE should not in any way be deemed or construed that the Scheme Information Document has been cleared or approved by NSE nor does it certify the correctness or completeness of any of the contents of the Scheme Information Document. The investors are advised to refer to the Scheme Information Document for the full text of the Disclaimer Clause of NSE. Disclaimer of BSE: It is to be distinctly understood that the permission given by Bombay Stock Exchange Ltd. should not in any way be deemed or construed that the SID has been cleared or approved by Bombay Stock Exchange Ltd. nor does it certify the correctness or completeness of any of the contents of the SID. The investors are advised to refer to the SID for the full text of the Disclaimer Clause of the Bombay Stock Exchange Ltd. For further Scheme Specific Risk Factors & other details, Please read the Scheme Information Document (SID) & Statement of Additional Information (SAI) carefully before investing. A copy of SID, SAI and KIM alongwith the application form are available at the office of the AMC, R&T, Distributors, or can be downloaded from www.motilaloswalmf.com and www.mostshares.com
You can also read