Volaris Capital Management - Failure of the Collar and How to Fix It - IBKR Webinars

Page created by Earl Delgado
 
CONTINUE READING
Volaris Capital Management - Failure of the Collar and How to Fix It - IBKR Webinars
Volaris Capital
Management –
Failure of the Collar
and How to Fix It

Vivek Kapoor,
CEO & CIO
Margaret Sundberg,
Quantitative Trader & Portfolio Manager
Volaris Capital Management
May 13, 2021

Exchange and Industry Sponsored Webinars are presented by unaffiliated third parties. Interactive
Brokers LLC is not responsible for the content of these presentations. You should review the
contents of each presentation and make your own judgment as to whether the content is
appropriate for you. Interactive Brokers LLC does not provide recommendations or advice. This
presentation is not an advertisement or solicitation for new customers. It is intended only as an
educational presentation.
Volaris Capital Management - Failure of the Collar and How to Fix It - IBKR Webinars
Disclosures

Options involve risk and are not suitable for all investors. For information on the uses and risks of options, you can obtain a copy of the Options Clearing
Corporation risk disclosure document titled Characteristics and Risks of Standardized Options by calling (312) 542-6901.

Futures are not suitable for all investors. The amount you may lose may be greater than your initial investment. Before trading futures, please read the
CFTC Risk Disclosure. For a copy visit interactivebrokers.com.

Security futures involve a high degree of risk and are not suitable for all investors. The amount you may lose may be greater than your initial investment.
Before trading security futures, please read the Security Futures Risk Disclosure Statement. For a copy visit Interactivebrokers.com.

There is a substantial risk of loss in foreign exchange trading. The settlement date of foreign exchange trades can vary due to time zone differences and
bank holidays. When trading across foreign exchange markets, this may necessitate borrowing funds to settle foreign exchange trades. The interest rate
on borrowed funds must be considered when computing the cost of trades across multiple markets.

The Order types available through Interactive Brokers LLC’s Trader Workstation are designed to help you limit your loss and/or lock in a profit. Market
conditions and other factors may affect execution. In general, orders guarantee a fill or guarantee a price, but not both. In extreme market conditions,
an order may either be executed at a different price than anticipated or may not be filled in the marketplace.

There is a substantial risk of loss in trading futures and options. Past performance is not indicative of future results.

Any stock, options or futures symbols displayed are for illustrative purposes only and are not intended to portray recommendations.

IRS Circular 230 Notice: These statements are provided for information purposes only, are not intended to constitute tax advice which may be relied
upon to avoid penalties under any federal, state, local or other tax statutes or regulations, and do not resolve any tax issues in your favor.

Interactive Brokers LLC is a member of NYSE FINRA SIPC
Volaris Capital Management - Failure of the Collar and How to Fix It - IBKR Webinars
Failure of
the Collar &
How to Fix
It
Presented by:

Vivek Kapoor
CIO

Margaret Sundberg
Quantitative Trader Portfolio Manager
                                        Take calculated risks. That is quite different from being rash.
                                                                                General George Patton
Volaris Capital Management - Failure of the Collar and How to Fix It - IBKR Webinars
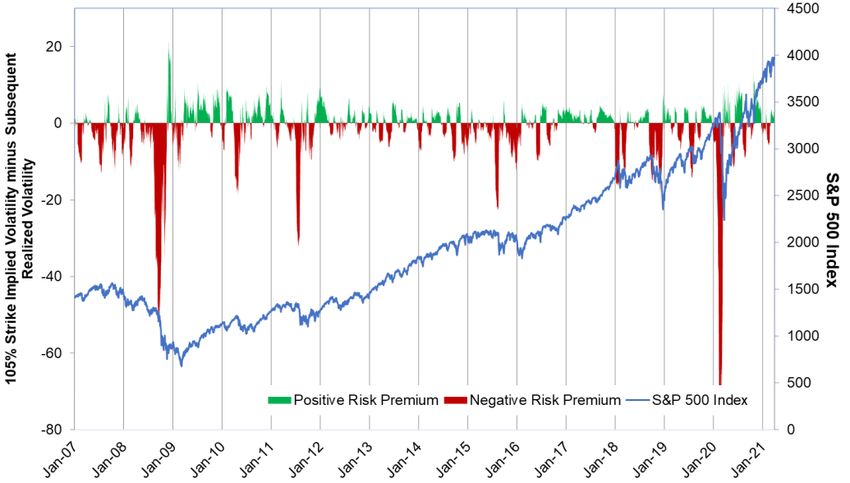
Presentation Overview

Destruction of Value by the Collar Hedging Strategy:
         Forsaking Upside Participation.
         Adverse Option Risk Premium Trade.
Option Risk-Return Informed Hedging:
         Risk Aware Approach to Options.
         Asymmetry of Irreducible Risks.
         Tail Risk versus Body Risk.
Self-Financed Net Ownership of Options
         Single Stock and Index Solutions

                                                       2
Volaris Capital Management - Failure of the Collar and How to Fix It - IBKR Webinars
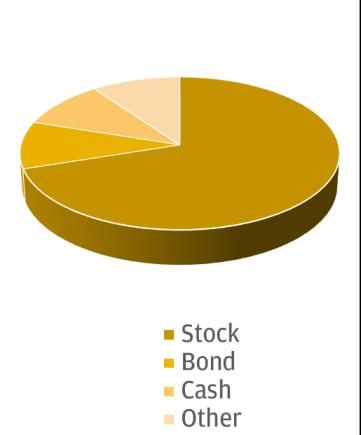
Long Term Destruction of Value

CLL Index: CBOE S&P 500 95-110 Collar Index: Entails holding the stocks in the S&P 500 Index; buying three-month S&P 500 put options to protect this S&P 500
portfolio from market decreases; and selling one month S&P 500 call options to help finance the cost of the puts.

CLLZ Index: CBOE S&P 500 Zero-Cost Put Spread Collar Index: The option strategy holds a long position S&P 500 Index; on a monthly basis buys a 2.5%-5% S&P
500 put option spread; and sells a monthly out-of-the-money S&P 500 call option to cover the cost of the put spread.

3       *Source: Bloomberg. All images are for illustrative purposes only. Please see important disclosures.
Simple Diversification >> Collar Hedging Strategy

                                                                    1

160%   SPTR Index and 40% LBUSTRUU Index.
         SPTR Index (S&P 500 Total Return Index): SPTR Index reflects effects of reinvested dividends on the SPX Index.
         LBUSTRUU Index (Barclays US Aggregate Bond Index): Measures the investment grade, US dollar-denominated, fixed-rate taxable bond market
         (including Treasuries), government-related and corporate securities, MBS (agency fixed-rate and hybrid ARM pass-throughs), ABS, and CMBS.
CLL Index: CBOE S&P 500 95-110 Collar Index: Entails holding the stocks in the S&P 500 Index; buying three-month S&P 500 put options to protect this S&P 500
portfolio from market decreases; and selling one month S&P 500 call options to help finance the cost of the puts.

CLLZ Index: CBOE S&P 500 Zero-Cost Put Spread Collar Index: The option strategy holds a long position S&P 500 Index; on a monthly basis buys a 2.5%-5% S&P
500 put option spread; and sells a monthly out-of-the-money S&P 500 call option to cover the cost of the put spread.

4        *Source: Bloomberg. All images are for illustrative purposes only. Please see important disclosures.
Collar Hedging Programs Forsake Upside Participation

                                                                 *Source: Bloomberg.
    70%
                                                                 NUSI US Equity: Nationwide Risk-Managed
                                                                 Income ETF is an actively-managed ETF
    60%    NUSI Collar Cumulative Total                          that seeks to achieve its investment
                                          Underlying
           Return                                                objective principally by investing in a
    50%    NDX Index Cumulative Total                            portfolio of the stocks included in the
           Return                                                NASDAQ Index.
    40%                                                          NDX Index: NASDAQ 100 Stock Index.

    30%
    20%
    10%
     0%
    -10%
                                                Collar Hedging
    -20%                                           Strategy
    -30%

5
Collar: Adverse Option Risk Premium Trade

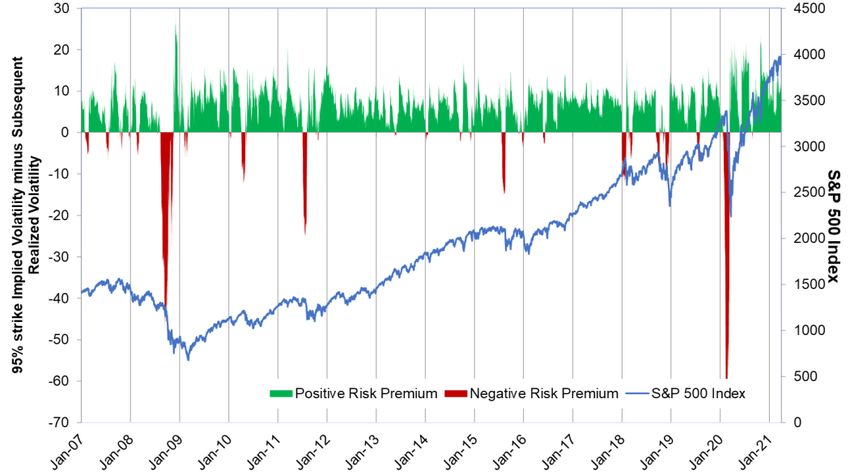
    Out-of-The-Money Put Option Risk
    Premium for S&P 500

      • Presentation
    Out-of-The-Money Call Option Risk
    Premium for S&P 500
        Overview

6   Source: Bloomberg, Volaris Capital Management, LLC.
Collar: Adverse Option Risk Premium Trade

                                                                                                           Sellers Rate of Expected Return on Risk Capital

                                                                                                                                            ln       +1
                                                                                                                                   (T ) =                 (1/year)
                                                                                                                                                 T

                                                                                                                                Bid Price - Expected Hedging Cost
                                                                                                                            =
                                                                                                                                            Risk-Capital

                                                                                                                            T: duration of derivative (years)

                                                                                                             A sample snapshot is shown from February 11, 2019 of the
                                                                                                                 estimated risk-return profile of an option seller.

      Comparison of an option bid-price with expected hedging costs provides an estimate of the option-seller’s
      expected P&L. The expected P&L when compared to the hedge-cost distribution reveals the option’s risk-
      return profile from a seller’s perspective.

7 Source: Bloomberg, Volaris Capital Management, LLC. All images are for illustrative purposes only. Please see important disclosures.
Real Returns
                                                                                        RYTHMS & RHYMES                                                                                                                                                                             NON-NORMALITY
                                                   0.15                                                                                                                                                                                                      35

                      S&P 500 Index daily return
                                                                                                                                                                                                                                                                                                                                     0
                                                    0.1                                                                                                                                                                                                      30
                                                                                                                                                                                                                                                                                      kurtosis
                                                   0.05                                                                                                                                                                                                                                                                              -0.2
                                                                                                                                                                                                                                                                                      Normal Distribution Kurtosis
                                                                                                                                                                                                                                                             25

                                                                                                                                                                                                                                                                                                                                            return skewness
                                                                                                                                                                                                                                 return kurtosis
                                                                                                                                                                                                                                                                                      skewness
                                                         0                                                                                                                                                                                                                                                                           -0.4
                                                                                                                                                                                                                                                                                      Normal Dstribution Skewness
                                                                                                                                                                                                                                                             20
                                                   -0.05
                                                                                                                                                                                                                                                                                                                                     -0.6
                                                                                                                                                                                                                                                             15
                                                    -0.1

                                                   -0.15                                                                                                                                                                                                                                                                             -0.8
                                                                                                                                                                                                                                                             10

                                                    -0.2                                                                                                                                                                                                                                                                             -1
                                                                                                                                                                                                                                                              5

                                                   -0.25

                                                                                                                                                       1/3/90
                                                             1/3/50
                                                                      1/3/54
                                                                               1/3/58
                                                                                        1/3/62
                                                                                                 1/3/66
                                                                                                          1/3/70
                                                                                                                   1/3/74
                                                                                                                            1/3/78
                                                                                                                                     1/3/82
                                                                                                                                              1/3/86

                                                                                                                                                                 1/3/94
                                                                                                                                                                          1/3/98
                                                                                                                                                                                    1/3/02
                                                                                                                                                                                             1/3/06
                                                                                                                                                                                                      1/3/10
                                                                                                                                                                                                               1/3/14
                                                                                                                                                                                                                        1/3/18
                                                                                                                                                                                                                                                              0                                                                      -1.2
                                                                                                                                                                                                                                                                  0          2        4         6          8         10         12
                                                                                                                                                                                                                                                                                    holding horizon (months)

                                                     1                                                                                                                                                                                                       0.04

                                                                                                                                                                                                                                 return sign-mag crosscorr
                                                   0.9
                                                                                                                                                                                                                                                             0.02
                      return mag autocorr

                                                   0.8
                                                   0.7                                                                                                                                                                                                            0
                                                   0.6
                                                                                                                                                                                                                                                             -0.02
                                                   0.5
                                                   0.4                                                                                                                                                                                                       -0.04
                                                   0.3                                                                                                                                                                                                       -0.06
                                                   0.2
                                                                                                                                                                                                                                                             -0.08
                                                   0.1
                                                     0                                                                                                                                                                                                        -0.1
                                                         -252              -189                  -126               -63                   0                     63                 126                189               252                                           -252   -189    -126    -63       0        63        126   189             252
                                                                                                                            lag (days)                                                                                                                                                             lag (days)

                                                                                                  PERSISTENCE                                                                                                                                                                        ASYMMETRY

“Molecules colliding randomly under thermal agitations have nothing in common with the human enterprise of risk-
taking, trading, and price discovery”.
Anonymous 2000 AD

8   Source: Bloomberg, Volaris Capital Management, LLC.
Risk-Aware Approach
                                                                                                                                              1.08
 Our tool to describe the asset is a Real-World Stochastic Model:                                                                                                 Conditional Simulations
                                                                                                                                              1.06
                                                                                                                                                               (Non-Stationary & Non-Normal)
      We exploit observed persistence & lead-lag relationships between return                                                                 1.04
      magnitude and sign and other conditioning variables using a vector auto-
      regressive framework to realistically capture the first four moments of return term                                                     1.02

                                                                                                              asset value
                                                                                                                                                             Observed
      structure.                                                                                                                                1

                                                                                                                                              0.98

                                                                                                                                              0.96

 Our tool for analyzing options is Multi-Variate Variational Calculus:                                                                        0.94

                                                                                                                                              0.92
      The pair of optimal functions being sought are the hedge-ratio and expected
                                                                                                                                                     0           21      42       63          84     105         126   147
      attempted replication cost as a function of the underlying. The functional being
      minimized is the wealth change variance.                                                                                                                                   trading days

      An explicit articulation of the optimal hedging strategy at each time-step enables                                                                 1
      an ex-ante assessment of residual risks.

                                                                                                             probability density (centered)
                                                                                                                                                      0.1

                                                                                                                                                     0.01
                                                                                                                                                                                          std dev
 We infer Option Risk Premiums by comparing price with Expected Costs of
 Attempted Replication.                                                                                                                          0.001
                                                                                                                                                                                               down
                                                                                                                                                                                               std dev
                                                                                      Expected
                  C           =       G− Wh                   +         W            Replication                                                0.0001
                                                                                        Cost
               option-price       expected replication cost       risk − premium                                                                                                  tail-loss
                                                                                                                                               0.00001
                                                          h                                                                                                  -50 -45 -40 -35 -30 -25 -20 -15 -10 -5      0   5    10 15 20
               G : option payoff                     W : hedge P & L
                                                                                                                                                                         attempted replication P&L ($)

9 Source: Bloomberg, Volaris Capital Management, LLC. All images are for illustrative purposes only. Please see important disclosures.
Asymmetry of Residual Risk

     Opportunity: Own Positive Carry                                                              Challenge: Negative Carry Costs
     Challenge: Adverse Negative Surprise                                                         Opportunity: Own Positive Surprise

                                                             Centered Hedge Cost Distribution
                  1

                0.1

               0.01
                                                                                                                                                    42 day
                                                                                                                                                    95% strike put
             0.001

                                                                                                                                                       Seller
            0.0001
                                                                                                                                                       Buyer
          0.00001
                      -50 -45 -40 -35 -30 -25 -20 -15 -10                   -5    0     5    10     15    20    25    30    35    40      45   50

                                                            Optimal hedger’s change in wealth ($)

10 Source: Bloomberg, Volaris Capital Management, LLC. All images are for illustrative purposes only. Please see important disclosures.
Tail Risk vs. Body Risk
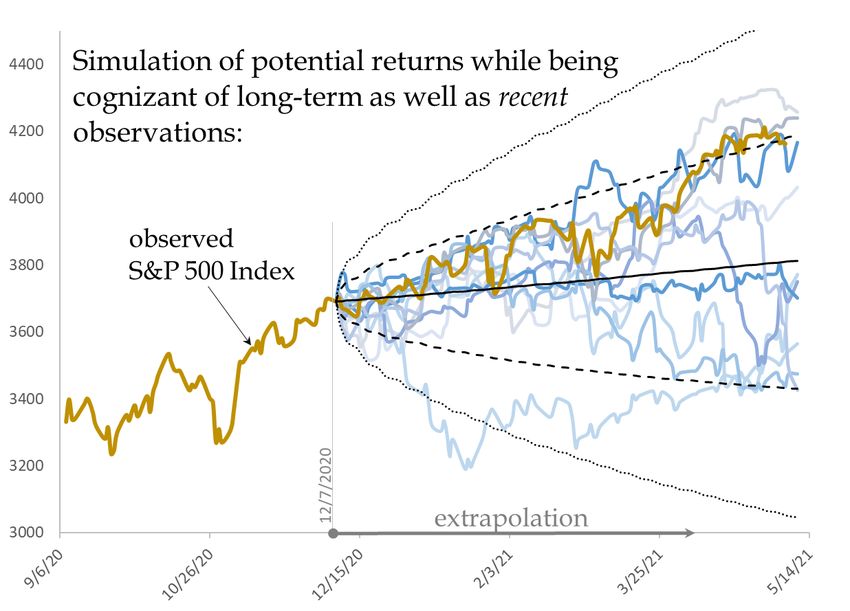
Returns associated with significant fear (downside) and euphoria (upside) in the market are Tail Risk.
    The band of uncertainty of returns increases with investment holding horizon (i.e., Term).
          At one-month holding horizon, the two-upside standard deviation return is +10% and the two-downside standard deviation return is -12%.
          At two-month holding horizon, the two-upside standard deviation return is +14% and the two-downside standard deviation return is -17%.
    Depicted below is the term structure of tail risks.
          At one-month holding horizon, the 1% confidence level of return is +12% and the 99% confidence level return is -18%.
          At two-month holding horizon, the 1% confidence level of return is +16% and the 99% confidence level return is -27%.

                                            S&P 500 Index Returns 1(%)   30%
                                                                                                                                 TAIL GAINS
                                                                         20%
                  1% CL

                  μ+2σ+                                                  10%
                  μ+σ+
                                                                          0%                                                              BODY OF RETURNS
                  μ
                                                                                                                                              (μ±2σ±)
                                                                         -10%
                  μ-σ-

                  μ - 2σ -                                               -20%

                  99% CL                                                 -30%                                                    TAIL LOSSES
                                                                         -40%
                                                                                0
                                                               Source: Bloomberg, Jan 1928 - Present
                                                                                                    1             2              3
Glossary                                                                                      Holding Horizon (Months)
  μ    Mean
  σ+   Upside Standard Deviation
  σ-   Downside Standard Deviation
  CL   Confidence Level

 11 1Return statistics are based on daily rolling returns over multiple holding horizons.
    Source: Bloomberg, Jan 1928 –Jan 2020
Tail Risk Opportunity Framework compared to a Collar Hedging Program

                            50%
                                     Alternative to the Collar                                                                              *Source: Volaris Capital Management LLC
    Cumulative Net Return
                            40%             TRO-SPX                                                                                         (“Volaris”), Bloomberg . Past performance
                                                                                                                                            does not guarantee or indicate future
                            30%                                                                                                             results. More information is available upon
                                                                                                                                            request. All images are for illustrative
                                                                                                                                            purposes only. The Tail Risk Opportunity
                            20%                                                                                                             strategy is a composite performance which
                                                                                                                                            consists of the performance of number of
                                                                                                                                            individual accounts. Net returns account for
                            10%                                                                                                             management and performance fee. These
                                                                                                                                            materials do not constitute an offer to sell
                             0%                                                                                                             or an offer to buy securities.

                                                                                                                                            JHQAX US Equity: JP Morgan Hedged
                            -10%                                                                                                            Equity fund is an open-end fund that seeks
                                                                                            Collar Hedging                                  capital appreciation. The Fund participates
                                                                                                                                            in the broad equity markets while hedging
                            -20%                                                               Strategy                                     overall market exposure relative to
                                                                                                                                            traditional long-only equity strategies. The
                                                                                                                                            Fund uses an enhanced index strategy to
                            -30%                                                                                                            invest in these equities, which consist of
                                   Underlying                                                                                               common stocks of large capitalization U.S.
                            -40%                                                                                                            companies.

                                                                                                                                            SPTR Index: Total return of S&P 500 Index.

                            SPTR + Volaris Tail Risk Opportunity                 JHQAX US Equity                      SPTR

12 *Source: Volaris Capital Management LLC (“Volaris”), Bloomberg . Past performance does not guarantee or indicate future results. Any stock, options or futures
    symbols displayed are for illustrative purposes only and are not intended to portray recommendations More information is available upon request.
Self-Financed Tail Positive Convexity
         Excess Kurtosis of Asset Returns
                                                                             • Option sell positions exhibit adverse asymmetry.
                                                                             • Option buy position exhibit favorable asymmetry.
  Distribution of P&L of Hedged Option

                    Five Cardinal Characteristics of
                          SPX Index Options
                                                                                                 Challenges of Indexation in S&P 500
1. Disparity Between Out of the Money Puts and Calls                                             Index Volatility Investment Strategies
2. Asymmetry Between Buyer and Seller                                                             https://ssrn.com/abstract=3427350
3. Exploding Asymmetry at Expiry
4. Exploding Asymmetry with Out-of-the-Moneyness
5. Elements of Timing (recognizing Volatility environment)

      Volaris portfolio composition systematically seeks portfolio configurations with controlled
      expected costs and favorable asymmetry.

131For more on the research approach visit www.volariscapital.com/research
Self-Financed Tail Positive Convexity

                         50%
Cumulative Net Return

                         40% Tail Risk Opportunity-SPX
                         30%
                         20%
                         10%
                          0%
                        -10%
                                                   Collar Hedging
                        -20%                          Strategy
                        -30% Underlying
                        -40%

                                                                                                                 Tail ETF Features:
                                                                                                                         ▪ Tail ETF purchases OTM SPX Index options and is
                              SPTR + Volaris Tail Risk Opportunity                                                         invested in Treasury Bonds.
                                                                                                                         ▪ Buying expensive puts is unsustainable.
                              JHQAX US Equity                                                                    Volaris Tail Risk Opportunity Features:
                                                                                                                         ▪ Self-Financed, Carry-controlled Positive Surprise
                              SPTR

  14 *Source: Volaris Capital Management LLC (“Volaris”), Bloomberg . Past performance does not guarantee or indicate future results. Any stock, options
               or futures symbols displayed are for illustrative purposes only and are not intended to portray recommendations More information is available upon
               request.
What are the
                   Potential to participate in price appreciation.
Risk/Reward
Implications of    Significant concentration risk.

a Concentrated     Lack of diversified portfolio.
Equity Position?   Potential lack of yield/return source.

What are the
Potential          Liquidity of underlying shares.
Considerations     Tax implications of selling shares.
of Selling Large   Potential restrictions on sale of stock.
Equity
Positions?

                                                                     15
VOLARIS OVERLAY SOLUTIONS
▪ Clients may use existing portfolio holdings (stocks, bonds, etc.) as collateral to employ Volaris strategies.
  ▪ Minimal opportunity cost implementation employing listed options in Separately Managed Account.
                     ▪ Defined risk strategies with transparency and daily liquidity.

        ADDITIONAL RETURN SOURCE                                   GAIN IN EXTREME MOVE

                                                                         TAIL RISK OPPORTUNITY
                           VOLATILITY INCOME
                                                                                   SPX

       Risk-controlled participation
                                                                                       Performing asset in deep
       in S&P 500 Index option risk
                                                                                      S&P 500 Index downturns.
                premium.

                                                Client Portfolio
                            CALL WRITE                                  TAIL RISK OPPORTUNITY
                                                                             SINGLE STOCK

          Opportunistic selling of call-                                            Performing asset in deep
         options for large stock position                                               stock downturns.
                      holder.

                                                                                             Volaris Capital Management LLC
                                                                                          Phone       +1 973 379 0600
                                                                                                                            16
                                                                                          Contact     www.volariscapital.com/contact.html
TAIL RISK OPPORTUNITY
                                    SINGLE STOCK

         Performing asset in deep                        Minimal opportunity cost
             stock downturns.                                implementation.

                                 Does not explicitly limit
                                upside like collar hedging.

What are the
benefits of the                     Decrease concentration risk by managing downside risk.
Volaris Tail Risk
                                    Maintain upside participation.
Opportunity
framework for a                     Avoid tax bill.
Concentrated
Equity Position?
                                                                                             17
Sustainable Yield and Tail Risk Opportunities

     Vivek Kapoor, CEO/CIO                               Margaret Sundberg, Portfolio Manager
        vivek.kapoor@volariscapital.com                       margaret.sundberg@volariscapital.com

18                              www.volariscapital.com
Important Legal Information and Disclosures

Volaris Capital Management, LLC is not affiliated with Interactive Brokers LLC, or any other FINRA broker-dealer
This material has been prepared by Volaris Capital Management LLC (“Volaris”) on the basis of publicly available
information, internally developed data and other third-party sources believed to be reliable. Volaris has not sought to
independently verify information obtained from public and third-party sources and makes no representations or
warranties as to accuracy, completeness or reliability of such information. All opinions and views constitute
judgments as of the date of writing without regard to the date on which the reader may receive or access the
information, and are subject to change at any time without notice and with no obligation to update. This material is
for informational and illustrative purposes only and is intended solely for the information of those to whom it is
distributed by Volaris. No part of this material may be reproduced or retransmitted in any manner without the prior
written permission of Volaris. Volaris does not represent, warrant or guarantee that this information is suitable for
any investment purpose and it should not be used as a basis for investment decisions. This material does not purport
to contain all of the information that a prospective investor may wish to consider. This material is not to be relied
upon as such or used in substitution for the exercise of independent judgment. Past performance does not guarantee
or indicate future results.
This material should not be viewed as a current or past recommendation or a solicitation of an offer to buy or sell any
securities or investment products or to adopt any investment strategy. The investment views and market
opinions/analyses expressed herein may not reflect those of Volaris as a whole and different views may be expressed
based on different investment styles, objectives, views or philosophies. To the extent that these materials contain
statements about the future, such statements are forward looking and subject to a number of risks and uncertainties.
All images are for illustrative purposes only.

 19
You can also read