ELECTRIFICATION OF BC WEBINAR MARCH 20TH 2019 - Clean Energy BC
←
→
Page content transcription
If your browser does not render page correctly, please read the page content below
ELECTRIFICATION OF BC WEBINAR MARCH 20TH 2019

Our overarching priority for CEBC in 2019 is to support BC’s
                    transition to low-carbon energy through the development of
                    effective climate policy and clean energy electrification. We will do
Mission Statement   this at a greater speed, lower financial risk and with less cost than
                    any new alternative, thus providing the BC ratepayers, BC Hydro
                    and the BC government with affordable, best value, clean energy.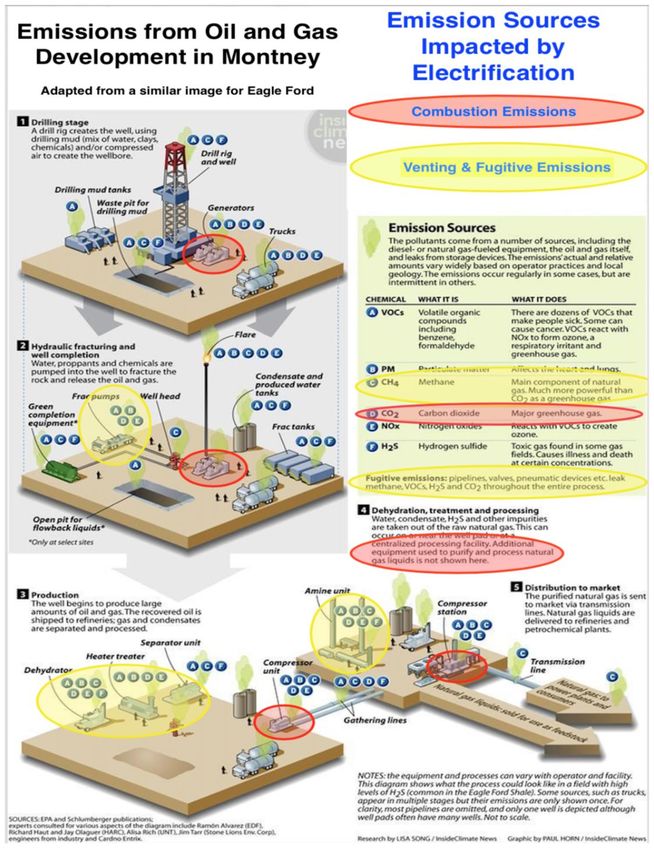
Outline
Putting electrification & climate change
in perspective by Martin Mullany

                         Electrifying transportation
                         by Martin Mullany

                                   Decarbonizing the built-environment
                                   by Ron Monk

                                                                         Time for Q&A and discussion
                                       Electrifying LNG
                                                                         Type questions through out!
                                       by Richard Harper

                                       Upstream natural gas
                                       by Steve Davis
The Big Picture
Climate Change

• 50% predicted loss in biodiversity over the next 100 years
• CO2 concentrations in atmosphere indicating that we are already
  committing us to at least ¾ of a meter of sea level rise by 2100
• Over the past 30 years coral reefs have shrunk by 38%
• If we burn the worlds proven fossil fuel reserves we would likely
  raise the global temperature by 6 degrees!
• Extreme weather events: 14 of the 15 hottest years on record have
  occurred since 2000
Positive Clean Energy Indicators
• Only 1 country not signed up to the Paris climate change accord:
    • Nearly 500 American cities have pledged to meet their climate
       obligations. These cities, along with 15 states represent more than
       half of the United States' economy

• France and UK to not allow the sale of internal combustion cars after 2040,
  Norway in 2025

• Over 100 large global companies have committed to 100% renewable
  energy: e.g. TD Bank, Facebook, eBay, Bloomberg, Google, Apple, Visa,
  Lego, Nike, Wells Fargo, Goldman Sacks, IKEA….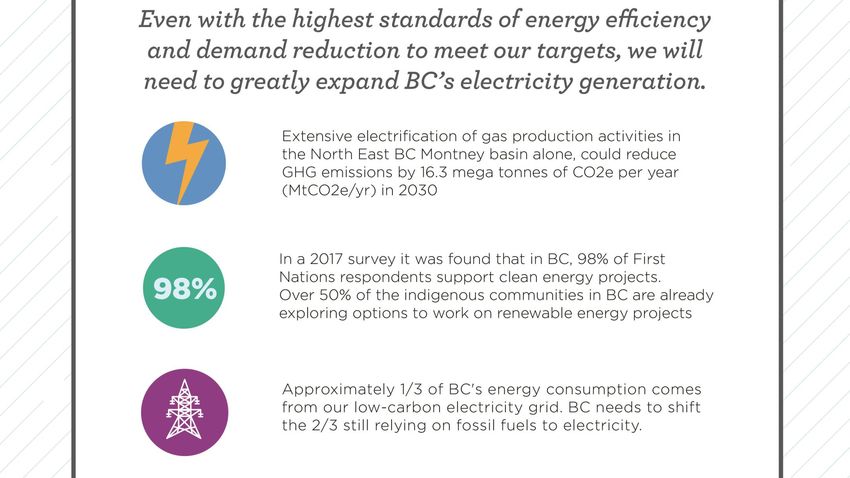

Positive Clean Energy Indicators

• In 2017 China announced plans to spend $360 Billion (USD) and create
  more than 13 million jobs in the renewable energy sector by 2025

• Saudi Arabia has kicked off a $50 Billion (USD) push for renewable
  energy with a near term goal of increasing the generating capacity to
  9.5GW of wind and solar

• Our relationship with energy has changed to become innovative,
  diverse, and much more complex
European Super Grid

                      www.zcb2030.org
Outline 15
Why Electrification?
Electrification Opportunities for the Built
Environment (i.e. Buildings)
Low Carbon Case Studies
• South East False Creek
• Alexandra District Energy Utility
• House example
11/06/2008 October 2017Greenhouse Gas Emissions from Built Environment 16 In 2017 about 17% of GHG Emissions were from Buildings in BC 11/06/2008
25 % of residential Homes and Multi family dwells Air Source Heat Pumps or Exchange HP.
           30% of private sector office buildings and retail, wholesale and warehousing buildings and
      2030
           15% of all other commercial and institutional building stock have been retrofitted with heat
           pumps for space heating by 2030.
   Segment Conventional        Natural Gas Electrification % increase         Extensive     % reduction
              Approach             GHG             Power        from 2017 Electrification
             (Natural Gas       emissions      Requirements         BC         (Tonnes
             displaced by        (Tonnes          (GWhr)        electricity   CO2e/yr)
           Electricity GWh)     CO2e/yr)                       production

Residential       6,806          1,392,587        2,084          3.1%          22,231         98.4%

Commercial       38,667          7,912,231        11,838        17.9%         126,309         98.4%
  Total          45,472          9,304,817        13,921        21.0%         148,540         98.4%
Key Actions – Low Density Residential Housing Encourage high efficiency air source and ground source heat pumps for space heating and cooling 11/06/2008
House Example (Yearly Consumption)
                                                             Heat Pump
Natural Gas                                                  Heating
Heating               Flue Losses           Heat from Air
                      3,900 kWh             25,000 kWh
                                            (free)
                                                              Air
              High                                            Source
              Efficiency                                      Heat
              Condensing                                      Pump
              Furnace                                                     Heat to Building
                         Heat to Building
                                                                          35,000 kWh
                         35,000 kWh
                                                            COP = 3.5
                                              Electricity
Natural Gas
                                              10,000 kWh
38,900 kWh
    $1,200 per year in fuel (natural gas)       $1,200 per year in fuel (electricity)
    28,000 tonnes of CO2 e per year
   11/06/2008                                   ~0 tonnes of CO2 e per year
Electrified Low-Carbon Heating Projects in British Columbia Alexandra District Energy in Southeast False Creek in Vancouver – Richmond – low carbon energy sources are low carbon energy source is sewer heat geo-exchange, waste heat from cooling of recovery commercial space & air source 11/06/2008
Key Takeaways                                   21

•       To meet BC government GHG targets for 2030, extensive electrification needed

•       Electrification through low carbon options such as

           •     air source heat pumps

           •     ground source heat pumps

           •     waste heat recovery

    11/06/2008
GHG Total GHG % increase
Year 2030 (HYPOTHETICAL Mean Reductions Reductions
%
from 2017 BC
SCENARIO (GWh) (Mt of (Mt of electricity
CO2e) CO2e) production
Electric Cars 1,185 0.43 0.43 14.9% 1.8%
Electric passenger light trucks 1,178 0.55
Electric freight light trucks 443 0.21
Electric medium duty trucks 2,563 1.29 2.44 84.0% 8.0%
Electric heavy-duty trucks 1,130 0.39
Electric school buses 4 0.00
Electric transit 44 0.03 0.03 1.1% 0.1%
Electric Inter city buses 7 0.00
TOTAL 6,554 2.9 7.9%
Mean GHG Total GHG % % increase
Year 2040 (HYPOTHETICAL
(GWh) Reductions Reductions from 2017 BC
SCENARIO
(Mill. of (Mt of electricity
Tonnes of CO2e) production
CO2e)
According to CleanBC, all new vehicles will be zero Electric Cars 4,297 1.51 1.51 13.4% 6.5%
emission by 2040 Electric passenger light trucks 4,334 1.99
Electric freight light trucks 1,584 0.75
Electric medium duty trucks 11,500 5.51 9.6 85.7% 32.7%
Switch to cleaner fuels, low-carbon fuel standard Electric heavy-duty trucks 4,211 1.36
will be at 20% by 2030 Electric school buses 10 0.01
Electric transit 160 0.06 0.1 0.9% 0.3%
Electric Inter city buses 30 0.03
CleanBC’s target for 2030 is to reduce emissions TOTAL 26,127 11.2 39.5%
from transportation by 6.0MtLNG and Upstream Gas
Greenhouse Gas (GHG)
Reduction Through Extensive
Electrification
Richard Harper, M.Eng., P. Eng. WSP Canada Group Ltd.
March 2019Why Electrify LNG and Upstream Gas?? • Climate Change – Heading in the wrong direction for a healthy planet, Paris Climate Summit ratified by all but one country (195 countries) • LNG has potential significant GHG impact to provincial (legislated) and national targets (Paris Climate Agreement). • Natural gas identified a bridge fuel. • Electrification could assist in meeting provincial and global GHG reduction targets • Help meet Cleanest LNG in the world goal (both plant and upstream gas) • Infrastructure development based on avoided cost of carbon. Is there a win win??.
GHG Reduction Analysis
• Considered LNG Facility, Transmission, and Upstream Gas
• Focused on Combustion Sources
   • LNG Facility – Refrigeration Compressors, Utility Power
   • Transmission - Compressor Stations
   • Upstream - Combustion Sources (compressor station Gathering System and
     Processing Facilities)
• Started with LNG Export Capacity and Worked Upstream Accounting
  for System Gas Combustion Losses.
• Considered Three LNG Development Scenarios (13 MPTA, 26 MPTA,
  60 MPTA)
LNG Facility
• Reviewed several facilities primarily US, Australia, Proposed Canadian
Facilities.
LNG Facility Type Range GHG Intensity Plant Intensity
Base Case (100% 0.245 to 0.275 0.260 0.260
Gas Drives for
compression and
utility power)
BC Grid Utility 0.025 to 0.050 0.035 0.225
power
50% Renewable/BC 0.055 to 0.075 0.075 0.15
Grid
100% 0.110 to 0.150 0.15 0.075
Renewable/BC Grid
Analysis Consistent with Aurora LNG (0.273), PNW LNG (0.276), and Arrow LNG (0.265 adjusted for
temperature efficiency). Current E-Drive intensity - Woodfibre LNG 0.06, Freeport LNG (0.08)Transmission – Coastal Gaslink, PRGT,
Westcoast Connector
Coastal Gaslink Prince Rupert Gas Transmission (PGRT)
Pipeline Annual Pipeline Annual GHG’s
Throughput GHG’s Throughput (tonnes CO2e)
Stage 1 2 Bcfd 350,000 Scenario 1 Initial 2.2 Bcfd 660,000
Pipeline and
Stage 2 3 Bcfd 800,000 Compression
Scenario 2 - Initial 4.2 Bcfd 2,357,000
Stage 3 5 Bcfd 3,500,000
Pipeline and Full
Compression
Scenario 3 - Two 8.4 Bcfd 4,150,000
Pipelines and Full
Westcoast Connector Compression,
Pipeline Annual GHG’s
Throughput (tonnes CO2e)
Stage 1 2 Bcfd 453,800
Very good data on which to estimate GHG
Stage 2 3.6 Bcfd 1,815,200 reduction. Emissions almost 100% CombustionUpstream Gas
Emission Source Category Total Gas Percentage Assumed Gas Emission Carbon Emission Source Category Total Gas Percentage Assumed Gas Emission Carbon
and Oil Emmisions at Source Totals Tax and Oil Emmisions at Source Totals Tax
Emissions 90% (tCO2e) (@90%) Applies Emissions 90% (tCO2e) (@90%) Applies
(tCO2e) (tCO2e)
Stationary Combustion: Stationary 5,389,000 53.01% 4,850,100 YES Centrifugal Compressor Venting 62,600 0.62% 56,340 NO
Natural Gas Combustion Vents
Stationary Combustion: Stationary 296,000 2.91% 266,400 YES Reciprocating Compressor Venting 98,900 0.97% 89,010 NO
Other Fuels Combustion Vents
Electricity Generation Electricity 271,000 2.67% 243,900 YES EOR Injection Pump Venting - 0.00% NO
generation Blowdowns
Subtotal NG/Other 5,360,400 Other Venting Sources Venting 75,500 0.74% 67,950 NO
Combustion/Generation
Well Testing Flares Flaring 141,000 1.39% 126,900 NO Subtotal Venting 2,690,397
Associated Gas Flares Flaring 17,300 0.17% 15,570 NO Storage Tanks Fugitive 48,100 0.47% 43,290 NO
Flare Stacks Flaring 391,000 3.85% 351,900 NO Gathering Pipeline Fugitive 109,000 1.07% 98,100 NO
Subtotal Flaring 494,370 Equipment Leaks
Equipment Leaks from Fugitive 441,000 4.34% 396,900 NO
Continuous High-Bleed Venting 187,000 1.84% 168,300 NO
Valves, Connectors, etc.
Device Vents
Above-Ground Fugitive 6,300 0.06% 5,670 NO
Pneumatic Pump Vents Venting 261,000 2.57% 234,900 NO
Meters/Regulators at Gate
Continuous Low-Bleed and Venting 55,600 0.55% 50,040 NO Stations
Intermittent Device Vents Below-Ground Fugitive 59,100 0.58% 53,190 NO
Acid Gas Removal Venting 2,088,000 20.54% 1,879,200 NO Meters/Regulators/Valves
Third-Party Line Hits Fugitive 1 0.00% 1 NO
Dehydrator Vents Venting 51,800 0.51% 46,620 NO
Other Fugitive Sources Fugitive 7,400 0.07% 6,660 NO
Well Venting for Liquids Venting 3,500 0.03% 3,150 NO
Unloading Wastewater Processing Wastewater 140 0.00% 126 NO
Well Venting, with or Venting 2,600 0.03% 2,340 NO
without Hydraulic Subtotal Fugative 603,937
Fracturing TOTAL 10,165,671 9,149,100
Blowdown Vent Stacks Venting 102,000 1.00% 91,800 NO
Well Testing Venting Venting - 0.00% - NO Total Excluding Flaring 8,654,730
Associated Gas Venting Venting 830 0.01% 747 NO
Very good detailed data on GHG emissions which were
matched with BC Oil/Gas Production for same year.
Key Assumption 90% emissions from gas 10% from oil.Upstream Gas
Emissions broken down by source and sector.
Source GHG Emissions % TOTAL Oil and Gas Total (tCO2e) Percentage
Industry
Combustion 5,360,400 58.6% Segment
Well Drilling and 375,300 4.1%
Flaring 494,370 5.4% Completions
Venting 2,690,397 29.4% Upstream / 3,444,300 37.7%
Gathering
Fugitives 603,937 6.6% Processing 4,195,800 45.9%
TOTAL 9,149,100 100% Transmission 1,134,000 12.4%
TOTAL UPSTREAM 9,148,500 100%
OIL AND GAS AND
Targeted emission reduction for combustion in TRANSMISSION
the Upstream/Gathering and Processing biggest
bang.Power Requirements • LNG Facility looked at data from several sources for E-Drive. Average 57MW/MPTA. • Detailed Power Requirements for Gas Transmission Available based on BCEAO data. • Upstream Gas based on BC Hydro methodology using 0.14 intensity • LNG and Upstream Gas facilities run virtually 24/7. High conversion to GWh. Strong baseload demand which fits well with BCH system.
GHG Reduction Potential Through Electrification
Medium LNG Plant – Export Volume 13MPTA (1.734 Bcfd)
Segment            Conventional             LNG Canada (5)           % Reduction LNG         Significant               %Reduction           Power Requirements    Power Requirements
                   Approach                                          Canada                  Electrification (4)       Conventional         (MW)                  (GWhr)
LNG Facility (3)             3,380,000      1,976,000                51%                                    975,000                   71%                  750                  6,390

Transmission (2)                  350,000   350,000                  0%                                       15,000                  99%                   100                   852

Upstream (1)                  3,865,000     3,865,000                0%                                    1,141,000                  70%                   310                 2,180

Total                         7,595,000     6,191,000                18%                                   2,131,000                  72%                 1,160                 9,422

   Large LNG Plant – Export Volume 26MPTA (3.468 Bcfd)
Segment            Conventional             LNG Canada (5)           % Reduction (LNG        Significant               % Reduction          Power Requirements    Power Requirements
                   Approach                                          Canada)                 Electrification (4)       Conventional         (MW)                  (GWhr)

LNG Facility (3)             6,760,000                   3,979,000                  41%                   1,950,000                   71%                1,480                12,610

Transmission (2)             1,800,000                   1,800,000                      0%                   30,000                   98%                  360                 3,155

Upstream (1)                 9,945,000                   9,945,000                      0%                4,498,000                   55%                  620                 4,370

Total                       18,505,000                  15,724,000                  15%                   6,478,000                   65%                2,460                20,135

   60 MPTA LNG export capacity reduction from 45MT to 16MT (64%). Power requirements 5,840MW
   and 47,880 GWHr. Many issues to be resolved to consider this level. Extensive electrification first
   step.
Economic Case for Extensive Electrification
• Economic case looks at benefits and costs primarily through avoided costs of
carbon over the long term.
• Many costs and benefits and how they are interpreted.
• Range of NPV benefit/cost $6.8 billion to $36 billion depending on scenario.
• Key finding parasitic load from combustion sources for LNG development is 25-30% (ie 25-
30% of gas produced from wells does not make it to tidewater!!)
• Analysis does not include value of NGL’s.
• What is needed is policy’s which mandate extensive electrification and retrofits,
and incentivization and tax policies which support the mandate.
• Quicker deployment of infrastructure to match industry development
timeframes.
• Accommodation within BCCLEAN and Pan Canadian Framework on Climate
Change and Clean Growth.Recent Developments
• Katowice Agreement sets stage for potential trade issue based on carbon reduction
and/or intensity.
• Requires other countries to report their emissions the same as the United States — report their
GHG emissions across all sectors, including trade-sensitive industries like steel, chemicals and
aluminum.
• Countries could reduce significant GHG emissions through an economic nationalist policy that
imposes carbon tariffs that displace dirtier products made abroad with cleaner goods made at
home.
• Export products, in many cases, would face lower carbon tariffs than their global competitors in
foreign markets.
• Moved Russia to move towards ratification of Paris “In a letter to the environment ministry on 17
January, Alexander Shokhin, the head of the Russian Union of Industrialists and Entrepreneurs
(RSPP), wrote that “Russian producers are interested in ratification” as “the absence of national
obligations and state regulation of activities to combat climate change may serve as a pretext for
imposing economic restrictions on Russian companies”. Shoshkin also cited concerns over a loss of
competitiveness and unnecessary costs”.
• EU prefers trade agreements with countries that conform to Paris (EU-Japan TA)
• Western Australia EPA will require new LNG proposals and changes to proposals,
including those currently under assessment, to be offset 100%
• US Gulf Coast LNG continues moving towards E-Drive. Recent approval of 60MT of LNG
export using E-Drive.GHG Reduction from Electrifying Montney
Summary of a report prepared for the
Clean Energy Association of B.C. by
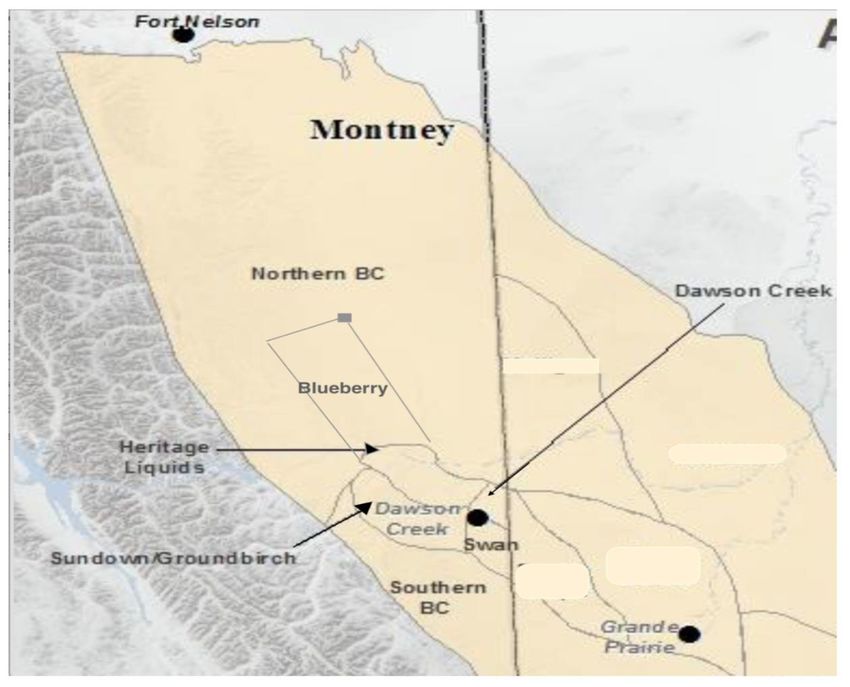
Steve Davis & Associates Consulting LtdMontney is where most of BC.’s gas is being produced
Montney is where the wires are
Montney gas production is the biggest single
      source of of BC’s total GHGs

 MONTNEY
12% (7.5 MT)
   (2012)
SUMMARY OF RESULTS
OF SDACL REPORT: GHG REDUCTION FROM ELECTRIFYING MONTNEY
Extensive electrification of gas production
activities in the Montney basin could
reduce GHG emissions by 16.2 mega
tonnes of CO2e per year in 2030.The math: 3 components GHG Reduction = Gas Production Volume x GHG Intensity x Electrification Penetration GHG Reduction = 11.0 Bcfd x 2.75 MtCO2e/Bcfd x 60 % = 18.2 MtCO2e Less 2 MtCO2e for facilities that have already been electrified = 16.2 MtCO2e
Gas production forecast: 11 bcfd in 2030

• Total of the
  volume from
  seven sub-basins
  that make up the
  Montney Basin
• Using data from
  ten industry and
  government
  sources.
• Current
  production is 5
  Bcfd
Average GHG Intensity = 2.75 MtCO2e/Bcfd
Industry Segments

                    Upstream
                    Segments:
                    •   Wells
                    •   Gathering
                    •   Processing
                    •   Transmission
Emission Reduction by Segment Weighted Average reduction = 60%
Emission
Sources:

- Combustion
- Flaring
- Venting
- Fugitives
Emission
Reductions from
   27 sources
        in
  4 categories.

   Average =
     60%
Key underlying assumptions • 11 Bcfd of natural gas will be produced in Montney in 2030. • i.e. at only 9 Bcfd then emissions would drop from 16.2 to 12.8 MtCO2e/year. • 11 Bcfd assumes one large and one small LNG terminal exporting a total of 28 MTPA will be fully operating. • All of the natural gas for the LNG terminals will come from Montney. • New transmission lines and new connections to gas production facilities will built quickly. • Government and BC Hydro will implement extensive fuel switching policies.
If no more electrification occurs, and if 11 bcfd of
       gas are produced in 2030 then GHG
emissions could reach 28.3 mega tonnes of CO2e
                      per year.

The math:

GHG = 11.0 Bcfd x 2.75 MtCO2e/Bcfd x 0 % reduction
= 30.3 MtCO2e

Less 2 MtCO2e for already electrified facilities
= 28.3 MtCO2e
SUMMARY OF RESULTS
OF SDACL REPORT: GHG REDUCTION FROM ELECTRIFYING MONTNEY
Extensive electrification of gas production
activities in the Montney basin could
reduce GHG emissions by 16.2 mega
tonnes of CO2e per year in 2030.Discussion & Questions
Martin Mullany
Clean Energy BC Chair of the Board
Bridge Power
m.mullany@bridgepower.ca
C: (604) 907-0150
Ron Monk, M.Eng., P.Eng.
Member of Clean Energy BC
Principal & Energy Sector Leader, KWL
rmonk@kwl.ca
C: (604) 314-5297
Richard Harper, M.Eng., P.Eng.
Member of Clean Energy BC
WSP Practice Leader Infrastructure BC
richard.harper@wsp.com
C: (604) 655-2290
Steve Davis, P.Eng., MBA
Clean Energy BC Board Member
Steve Davis & Associates Consulting Ltd.
svdavis@gmail.com
C: (604) 360-3816You can also read