Patient Access & Reimbursement: Current Challenges & Strategies - Chris Mancill Vice President, Government Programs & Reimbursement, EMD Serono ...
←
→
Page content transcription
If your browser does not render page correctly, please read the page content below
Patient Access & Reimbursement:
Current Challenges & Strategies

Chris Mancill
Vice President, Government Programs &
Reimbursement, EMD Serono

April 13, 2018

Disclaimer

    ● The information and views shared in this presentation
      are my own and do not necessarily represent any official
      positions of EMD Serono or Merck KGaA, Darmstadt,
      Germany.

2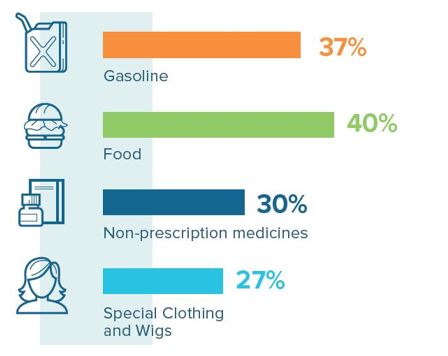
Topics for Today’s Discussion

    This session will review the following:
    ● the current access and reimbursement landscape for
      community oncology and strategies to deal with
      emerging challenges
    ● the role of government and commercial payers, as
      well as Pharmacy Benefit Managers (PBMs) and the
      changing ways that we work with them
    ● the new opportunities presented by the Administration’s
      focus on value-based agreements and its implications
      for community oncology
    ● the growing funding gaps for patients and strategies
      for working with assistance programs to help them meet
      their needs

3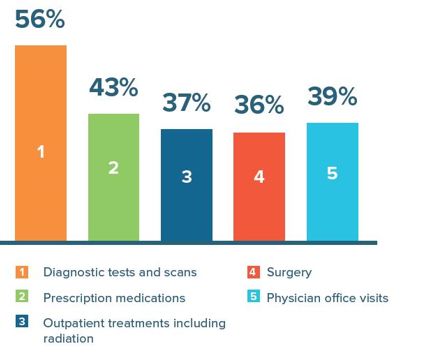
Since Peaking in the Early 1990s,
Cancer Death Rates Have Declined by
About 25 Percent
U.S. Death Rates from Cancer Decline Over Time
250
Cancer Death Rate (Number of
Deaths Due to Cancer per
200 215
150 -25%
100,000)
161
100
50
0
1991 2014
Increases in cancer survival are estimated to
translate to the avoidance of nearly 2.1 million
cancer deaths.
Source: American Cancer Society. Cancer Facts & Figures 2017. Available at http://www.cancer.org/research/cancerfactsstatistics/cancer-
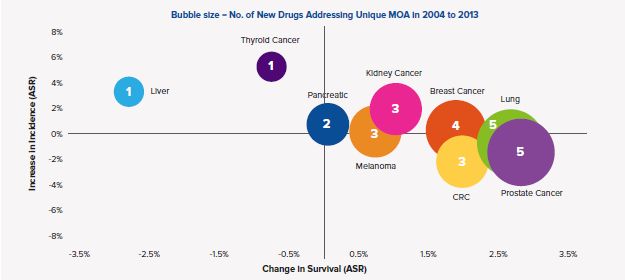
5 facts-and-figures-2017.Introduction of Novel Cancer Medicines
Associated with Survival Increases
Change in Incidence and Survival (2004-2013)
Medicines are one factor driving increased survival,
along with screening, earlier diagnosis, and lifestyle
changes.
Source: Quintiles IMS Institute. Global Oncology Trends 2017. Available at https://www.iqvia.com/institute/reports/global-oncology-trends-
6 2017-advances-complexity-and-cost.Promise in the Pipeline: More than 800
Medicines in Development for Various
Cancers
Number of Medicines in Development in the United States,
September 2015, Selected Cancer Types1
Bladder Cancer
Brain Cancer
Breast Cancer
Colorectal Cancer
Hematological Malignancies
Kidney Cancer
Leukemia
Liver Cancer
Lung Cancer
Lymphoma
Multiple Myeloma
Ovarian Cancer
Phase I
Pancreatic Cancer
Prostate Cancer
Phase II
Skin Cancer
Stomach Cancer
1 Some medicines are being explored in more than one therapeutic category.
Sources: PhRMA. Medicines in Development for Cancer (2015). Available at http://phrma.org/sites/default/files/pdf/oncology-report-
2015.pdf; American Association for Cancer Research. AACR Cancer Progress Report (2017). Available at
7 http://www.cancerprogressreport.org/Documents/AACR_CPR17_Final.pdf.Cancer Drugs Account for About One
Percent of U.S. Healthcare Spending1
Cancer Medicines as a Portion of NHE Projected Total U.S.
Health Care Spending, 2016
$45.5 Billion2
Cancer Drug
Spending
$3.3 Trillion*
1 2016 CMS total National Health Expenditures is a projection
2 Cancer drug invoice spending and does not include discounts
Sources: Quintiles IMS Institute. Medicines Use and Spending in the US: A Review of 2016 and Outlook to 2021. May 2017; CMS, National
Health Expenditures Data. Available at https://www.cms.gov/research-statistics-data-and-systems/statistics-trends-and-
8 reports/nationalhealthexpenddata/nationalhealthaccountsprojected.html.Cancer Medicines Represent About 20
Percent of Cancer Spending
Medicare Treated Commercially Insured
Cancer Population, 2014 Treated Cancer Population,
2014
18% 20%
Cancer
20%
Cancer
Drugs 34% Drugs
5%
4%
13%
21%
8% 11% 28% 10%
3% 4%
Source: K. Fitch, et al. Milliman. Cost Drivers of Cancer Care: A Retrospective Analysis of Medicare and Commercially Insured
Population Claim Data 2004-2014 (April 2016). Available at http://www.milliman.com/uploadedFiles/insight/2016/trends-in-cancer-
9 care.pdf.Average Price Growth of Cancer
Medicines in Medicare Part B Is In Line
With Medical Inflation
Weighted ASP (Oncology Drugs vs. All Other Drugs) vs
Consumer Price Index – Medical (CPI-M)
Cancer
Drugs
The trend of volume-weighted Average Sales Price
(ASP) for cancer drugs administered through
Medicare Part B has been growing in line with
medical inflation.
Source: The Moran Company. Trends in Weighted Average Sales Prices for Prescription Drugs in Medicare Part B, 2007-2017 (December
10 2017). Available at http://phrma-docs.phrma.org/files/dmfile/PhRMA-ASP-Trend-Report-final-02212018.pdf.Better Use of Cancer Medicines Can
Reduce Health Care Costs
Difference in Total Healthcare Costs by Adherence Status for
Advanced Melanoma Patients
$51,991
$48,263
$41,830
$37,549
Cancer Low Adherence
Drugs
High Adherence
All-Cause Costs Melanoma-Related Costs
Advanced melanoma patients who were adherent to
immunotherapy experienced 10 percent lower health
care costs.
Source: Gupte-Singh K, Lin J, Lingohr-Smith M, Menges BL, Rao S. Adherence to cancer therapies and the impact on healthcare
costs among patients with advanced melanoma in the USA. Proceedings of the 22nd Annual International Meeting International
Society of Pharmacoeconomics and Outcomes Research (May 2017); Available at
11 https://www.ispor.org/ScientificPresentationsDatabase/Presentation/70971?pdfid=49558.Patients Face Medical and Non-Medical
Cost Burdens
Top Patient Financial Concerns1
NON- Cancer
MEDICAL
MEDICAL Drugs
1 Among patients (n=110) diagnosed with cancer in the past five years and surveyed by CancerCare in April 2017.
More than 40 percent of patients say medical and non-
medical costs cause equal financial hardship.
13 Source: CancerCare. Financial Hardship Associated with Cancer (2017). Available at https://media.cancercare.org/publications/original/349-
financial_hardship.pdf.A Cancer Diagnosis Impacts
Productivity and Employment for
Patients and Caregivers
Patients Caregivers
More than
67%
of patients who were
25%
of cancer caregivers made
employed full-time when extended employment
diagnosed either stopped changes
working or reduced their
work hours
Sources: CancerCare. Financial Hardship Associated with Cancer (2017). Available at https://media.cancercare.org/publications/original/349-
financial_hardship.pdf; Yabroff et al. Financial Hardship Associated with Cancer in the United States: Findings from a Population-Based Sample
of Adult Cancer Survivors (2016), DeMoor et al. 2016. Employment implications of informal cancer caregiving (2016); Yabroff & Kim. Time costs
14 associated with informal caregiving for cancer survivors (2009).Out-of-Network (OON) Utilization
Contributes to High of OOP Costs
Percent of Total Out-of-pocket Costs Incurred Out of
Network, All Cancers (2011)
Highest (99th percentile) 41%
OOP Spending Percentile
High (90th percentile) 10%
Moderate (50th percentile) 7%
Low (10th percentile) 7%
Out-of-pocket (OOP) costs can be high when insurance
does not cover the services patients need. For cancer
patients with high OOP spending, a large portion of
their costs are due to OON services.
15 Source: G. Dieguez, et al, Milliman Research Report. A Multi-Year Look at the Cost Burden of Cancer Care (2017). Available at
http://www.milliman.com/insight/2017/A-multi-year-look-at-the-cost-burden-of-cancer-care/.Benefit Design Is a Barrier for Some
Cancer Patients
Percentage of Silver Plans Placing All Drugs per
Class on Specialty Tier, 2016
Molecular Target
23%
Inhibitors*
Antiangiogenics* 50%
*There are no generic drugs available in this class.
All products are single-source.
Some plans place treatments for certain high-cost
conditions on the highest drug formulary cost sharing
tier (sometimes called adverse tiering).
Source: Avalere Health PlanScape®, a proprietary analysis of exchange plan features, April 2016. This analysis is based on data
collected by Managed Markets Insight & Technology, LLC.
16High Cost Sharing Leads to
Abandonment or Delays in Cancer
Treatment
Oral Oncolytic Abandonment Rate by
Patient Out-of-Pocket Amount
45%
38%
29%
13%
9%
$2000
Highest cost sharing group was six times more likely to
delay treatment than the lowest cost-sharing group.
Source: Doshi JA, Li P, Huo H, Pettit AR, Armstrong K. Higher patient cost sharing is associated with prescription abandonment and delay in fills
of novel oral oncolytic prescriptions. Proceedings of the 22nd Annual International Meeting International Society of Pharmacoeconomics and
Outcomes Research (2017). Available at https://www.ispor.org/ScientificPresentationsDatabase/Presentation/73657?pdfid=49504.
17What Is CMS Going to Do?
“What we should Part B “was “I think we need to
be doing is, those constructed a rethink how we are
techniques that long time ago, in structured and how
drive such good a different era” we’re paying for
“I think where
net pricing in Part with different these new drugs.”
the government
doesn’t have D, what can we drugs and types
negotiation, it’s take from the of therapy.
worth looking at learnings there
that.” into Part B?”
“I think we need to
rethink how we are
structured and how
we’re paying for these
new drugs… the Part
B program in
particular may not
have contemplated
these types of new
drugs coming out in
the market.”
19Commercial Payers Are Using A
Variety of Tools to Control Access to
Oncology Therapies
Current and Anticipated Payer Measures
to Manage Oncology Costs (Q1 2017)
Utilizing one or more value frameworks* in
determining reimbursement 31%
Using clinical pathways to determine
treatment regimens 35%
Contracting for preferred first-line therapies 59%
*Value Frameworks: NCCN Evidence Blocks, ASCO Value Framework, etc.
20 Source: Zitter Health Insights, Managed Care Oncology Index (2016).Manufacturers and Health Insurers Are
Pursuing Novel Outcomes-Based
Contracts (OBCs)
Private Sector Risk-Sharing Contracts
Announced
16
7
Late 1990s-2013 2015-2017
About 35 percent of payers with outcomes-based
21
contracts have or are considering OBCs in oncology.
The Administration has also signaled willingness to
allow OBCs for government programs.
Source: PhRMA Member Survey, Barriers to Value-Based Contracts for Innovative Medicines (2017). Available at
21 https://www.statnews.com/wp-content/uploads/2017/03/PhRMA_ValueBased_MemberService_R2122-2.pdf; Avalere Health. Payer
Perspectives on Outcomes-Based Contracting (2017).Enabling the Cancer Drug Market’s
Move to Value
Value Based Value Quality
Contracts Frameworks Measures
Expand value- Develop better Close gaps in
based contracts data and tools to clinical and
by modernizing support informed patient-focused
outdated decision-making quality measures.
regulations. by patients,
physicians and
payers. “All phases of the
“[R]egulatory reforms
cancer care
can address these
continuum…need new
concerns and “[E]merging approaches measures.”
encourage more robust for assessing drug value
competition within the are welcome….The National
drug market.” frameworks will require Academy of
refinement, however, Medicine
Scott
Gottlieb & before they're ready to
Kavita be broadly applied.”
22 Patel Peter
Neumann &
Joshua
Cohen
Sources: S Gottlieb, K. Patel. A Fair Plan for Fairer Drug Prices, Health Affairs; P. Neumann, J. Cohen. Measuring the Value of Prescription
Drugs, NEJM; Institute of Medicine. Delivering High-Quality Cancer Care: Charting a New Course for a System in Crisis (2013).
22Payers Are Increasingly Exploring Novel
Ways to Manage Specialty Drugs
● Cigna recently announced that it will no longer allow
buy-and-bill reimbursement for certain providers that
purchase so-called “limited distribution drugs,” a term
that could be applied to most oncology drugs
● Instead, the payer will mandate that these products
be ordered and delivered by a specialty pharmacy
provider
Restrictions like this one can be disruptive to the
practice of oncology care. Providers should be ready to
express their concerns to payers that make such
changes.
Source: Conti RM, Landrum MB, and Jacobson M. The impact of provider consolidation on outpatient prescription drug-based cancer care
23 spending (2016).Pharmacy Benefit Managers (PBMs)
Are Targeting Physician Dispensing
● Since 2011, PBMs have consolidated into just a
handful of major corporations that control about 80
percent of covered lives in the United States
● A leading PBM, CVS Caremark, recently attempted to
decertify physicians dispensing oral oncology
therapies from its pharmacy network
● This move, which was swiftly and successfully
opposed by groups like COA, would have left patients
without access to their medications from the provider
offices where they are treated
Source: Frier Levitt. Pharmacy Benefit Managers’ Attack on Physician Dispensing and Impact on Patient Care: Case Study of CVS
24 Caremark’s Efforts to Restrict Access to Cancer Care. Available at https://www.communityoncology.org/wp-
content/uploads/2016/08/PBMs_Physician_Dispensing-WhitePaper_COA_FL.pdf.There Are Many Resources Available to
Help with Patient Needs, But Keeping
Track Can Be A Challenge
● A handy reference for manufacturer
programs is the ACCC Patient Assistance &
Reimbursement Guide1
● In the past, it was hard to find a centralized
resource for not-for-profit and foundation
assistance programs; however, ACCC
recently added these aspects as well
Source: ACCC. 2018 Patient Assistance & Reimbursement Guide. Available at https://www.accc-
26 cancer.org/home/learn/publications/patient-assistance-and-reimbursement-guide.Your Input to Manufacturer Partners Is
Absolutely Critical in Designing Patient
Access Services
● Please give your manufacturer partners
feedback on their patient access and
reimbursement services
● We cannot design and implement these
programs without your input
● Each company has different approaches, but
consider taking advantage of available
opportunities to provide feedback
Your feedback and thoughts for improvement are
greatly appreciated.
27With So Many Threats and Changes
Looming, What Can We Do?
● There is no better advocate for community
oncology than COA
● Be involved and be an advocate for your
profession, and encourage your peers to do
the same
● Participate in Congressional fly-ins and Hill
Days and make your representatives in DC
aware of your concerns
Network to amplify your voice and make your
manufacturer partners aware of your concerns,
so you can leverage them on issues of mutual
interest.
29You can also read