Screening for hub genes and signaling pathways of CD8+ T cells in systemic lupus erythematosus using bioinformatics
←
→
Page content transcription
If your browser does not render page correctly, please read the page content below
E3S Web of Conferences 271, 03034 (2021)                                                   https://doi.org/10.1051/e3sconf/202127103034
ICEPE 2021

    Screening for hub genes and signaling pathways of CD8+ T cells
    in systemic lupus erythematosus using bioinformatics
    Yuefeng Wu1,*
    1Zhejiang   University-University of Edinburgh Institute, Zhejiang University, Haining, Zhejiang, CHINA

                  Abstract: Systemic lupus erythematosus (SLE) is a chronic autoimmune disease, which can damage
                  multiple organs. The adaptive immune system, including CD8+ T cells, plays an essential role in this
                  disease. However, the pathogenesis of SLE remains unclear, and there is a lack of effective diagnosis and
                  treatment methods for SLE. In particular, there has been little research on SLE biomarkers, which have been
                  widely studied and used in cancer diagnosis and treatment. In this study, bioinformatics tools were used to
                  screen for hub genes and signaling pathways involving CD8+ T cells in patients with SLE. This is the first
                  determination of metabolic abnormalities in SLE CD8+ T cells using bioinformatics pathway enrichment
                  analysis. The PPI network and MCC algorithm identified SKP2 as a potential biomarker for SLE.

  1 Introduction                                                       expressed genes (DEGs) were identified using the R
                                                                       software. Next, we performed GO and KEGG
  Systemic lupus erythematosus (SLE) is a chronic                      enrichment for the DEGs. Additionally, the online tools
  autoimmune        disease    characterized    by     tissue          STRING and Cytoscape were used to identify hub genes
  inflammation and multiple organ damage. The                          which could be used as biomarkers. The signal pathways
  mechanism of SLE is complicated and remains to be                    were helpful for explaining the presence of abnormal
  elucidated. Recent research has reported connections                 CD8+ T cells in patients with SLE. This analysis offers
  between SLE and genetics, environmental factors, and                 insight into the mechanism of SLE and provides a
  hormones[1].                                                         potential biomarker for its diagnosis.
      The adaptive immune system, especially T cells,
  plays an essential role in this process. Both deficiencies
  in and alterations of T-cell signals influence their                 2 Material & Methods
  proliferation, cytokine production, and even their
  functions[3]. Because epigenetic modifications can                   2.1. GEO data query and normalization
  impact T cells in patients with SLE, DNA sequences
  from their T cells have been studied. An ex vivo study               The GEO data were downloaded from the GEO database
  showed that IFN-regulated gene promoters were                        (http://www.ncbi.nih.gov/geo) using the following
  hypomethylated, which may result in the SLE                          selection criteria[8]: (1) patient diagnosed with SLE; (2)
  phenotype[2].                                                        must have CD8+ T-cell data; and (3) must have CD8+
      Apart from generalized lymphocytopenia, specific T               T-cell data from healthy control subjects. The GSE55447
  cell populations have been another focus; CD8+ T cells               dataset was selected[7]. Forty-two SLE samples and 10
  could predict prognosis in SLE[5]. Expansion of CD8+ T               samples from healthy controls were collected.
  cells is associated with poor prognoses because these                    The downloaded MINiML files were normalized by
  cells can damage tissue.                                             log2 transformation using the preprocessCore package in
      Early diagnosis and precise classification of SLE will           R[10]. The probe IDs were translated into gene symbols.
  aid clinical treatment and patient recovery. Currently, the          Probes representing more than one gene were excluded.
  diagnosis of SLE is based on chest pains, arthralgias, and           The removeBatchEffect function in the Limma package
  headaches[6], and to our knowledge, there is no                      was used to remove the batch effect[9].
  diagnostic method based on gene expression detection.
  However, with the development of sequencing methods
                                                                       2.2 Differential expression genes analysis
  and bioinformatics techniques, biomarkers have been
  widely used and studied with high specificity and                    The differential expression of genes was analyzed using
  sensitivity for other diseases.                                      the Limma package (version 3.40.2) of the R software.
      Herein, we used GEO data to compare CD8+ T cells                 The adjusted P value was calculated to correct for false-
  from patients with SLE and healthy controls. The data                positive results in the GEO datasets. The thresholds for
  was preprocessed and normalized, and differentially                  differentially expressed genes were defined as “Adjusted

    *
        Corresponding author: flaviuswu@zju.edu.cn
© The Authors, published by EDP Sciences. This is an open access article distributed under the terms of the Creative Commons Attribution
License 4.0 (http://creativecommons.org/licenses/by/4.0/).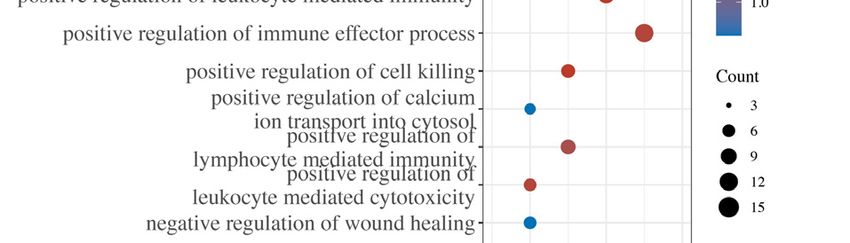
E3S Web of Conferences 271, 03034 (2021) https://doi.org/10.1051/e3sconf/202127103034
ICEPE 2021
P < 0.05 and Log (Fold-Change) > 1 or Log (Fold- 3.2 DEGs function enrichment analysis
Change) < -1.” The DEGs were visualized with the help
of a volcano plot and a heatmap. The ClusterProfiler in The GO database is a widely used tool for systematically
R was used to analyze potential signaling pathways. Two describing gene functions; it classifies genes into three
methods were used: gene ontology (GO) functions and groups: molecular function (MF), biological pathways
Kyoto Encyclopedia of Genes and Genomes (KEGG)[11]. (BP), and cellular components (CC)[12]. In our analysis,
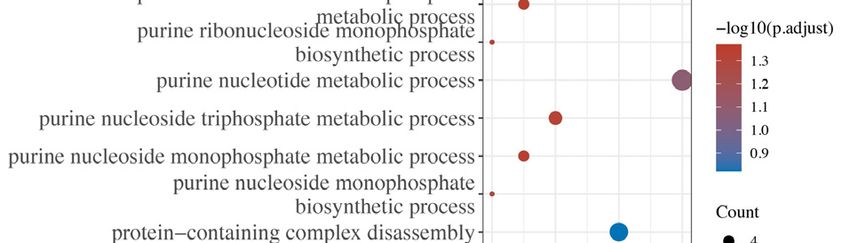
many genes related to the processes of metabolism and
biosynthesis were upregulated. Genes related to
2.3 PPI network construction and hub gene immunological processes were downregulated. The
identification detailed information is listed in Fig. 2.
The DEGs were uploaded to the online tool STRING
(http://string-db.org/) for protein-protein interaction (PPI)
network construction. Next, the TSV file containing the
PPI information was downloaded and opened in
Cytoscape. CytoHubba was used to identify hub genes in
the network. The Maximal Clique Centrality (MCC)
algorithm was used for calculating.
3 Results
3.1 Differential expression genes result
From the GSE55447 dataset, we collected CD8+ T cells
from 42 patients with SLE and 10 healthy controls. We
identified 428 DEGs in total; 134 upregulated genes and
294 downregulated genes. A heatmap and volcano plot
show the DEGs (Fig. 1a,b).
Fig. 1a Volcano plot of DEGs between CD8+ T cells from
patients with SLE and healthy controls. The blue dots represent
downregulated genes and the red dots represent upregulated
genes.
Fig. 2 The results of the GO term enrichment analysis, where
different colors represent the significance of the enrichment
results. The larger the number is, the lower the FDR will be.
The size of the circle is representative of the number of genes.
P < 0.05 or FDR < 0.05 indicates a statistically significant
pathway.
KEGG analysis can be used to present a more
Fig. 1b Heatmap of DEGs between CD8+ T cells from patients
advanced view of the functional behavior of the cell[13].
with SLE and healthy controls. G1 is the SLE group and G2 is KEGG enrichment results indicated that pathways
the control group. Colors represent how gene expression related to biosynthesis, metabolism, hormones, and
changed. The most significant 50 upregulated genes and 50 axons were upregulated. The JAK−STAT, cAMP,
downregulated genes are shown here. RIG−I-like receptor, GnRH, ErbB, and p53 signaling
2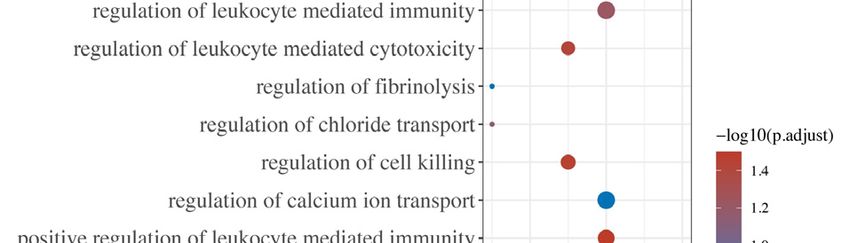
E3S Web of Conferences 271, 03034 (2021)                                                    https://doi.org/10.1051/e3sconf/202127103034
ICEPE 2021

  pathways were found to be downregulated, although
  their downregulation was not statistically significant.
  The details are listed in Fig. 3.

                                                                                    Fig. 4 Hub genes and their PPI network

                                                                          4 Discussion
                                                                          Early diagnosis and treatment of patients with SLE could
                                                                          improve their prognoses and remission rates. However,
                                                                          commonly used antibody testing cannot accurately
                                                                          predict these outcomes. Therefore, finding new
                                                                          biomarkers is increasingly important.
                                                                              T cells play a critical role in SLE, and T-cell
                                                                          abnormalities have an essential impact on SLE
                                                                          pathogenesis. In our analysis, the metabolism of CD8+ T
                                                                          cells from patients with SLE differed from the CD8+ T
                                                                          cells of control subjects, which is consistent with
                                                                          previous reports[14]. However, it is the first use of
                                                                          bioinformatic analysis to reveal metabolic abnormalities
                                                                          in CD8+ T cells from patients with SLE and identify hub
                                                                          genes. The hyperexcitation of T cells may explain the
                                                                          symptoms of autoimmune disorders.
                                                                              In line with our anticipation, the hub genes were
                                                                          enriched in pathways related to protein metabolism
                                                                          because T-cell hyperexcitation requires the adjustment of
                                                                          enzyme activities and more nutrients. Accumulating
                                                                          evidence has shown that T-cell hyperexcitation is
                                                                          characterized by processes such as abnormal glycolysis,
                                                                          oxidative stress, and mitochondrial hyperpolarization[17].
                                                                              S-phase Kinase-associated Protein 2 (SKP2) controls
                                                                          the ubiquitination and subsequent proteasomal
     Fig. 3 KEGG enrichment results, in which different colors
                                                                          degradation of targeted cell cycle and signal transduction
    represent the level of significance of the enrichment results.
   The larger the number is, the lower the FDR will be. The size          proteins[15]. It is also involved in the G1/S transition,
   of the circle is representative of the number of genes. P < 0.05       which makes it a critical target for cancer therapy[16].
     or FDR < 0.05 indicates a statistically significant pathway.             Moreover, the vitamin D receptor can suppress SLE
                                                                          by downregulating SKP2, which provides support for
                                                                          recognition of SKP2 as a biomarker in patients with
  3.3 PPI network construction and hub gene                               SLE[18].
  identification

  The interaction network generated by using STRING
                                                                          5 Conclusion
  and visualized using Cytoscape contained 314 nodes and                  Our work identified the hub gene SKP2 in CD8+ T cells
  617 edges (Fig. 5). Ten hub genes and their interactions                from patients with SLE as a potential biomarker for
  were identified using MCC in cytoHubba (Fig. 4). The                    diagnosis or treatment. Moreover, bioinformatics
  hub genes included ASB7, WSB2, GRWD1, COPS4,                            analysis indicated that the metabolism of CD8+ T cells
  FBXL13, KBTBD8, DCUN1D3, KLHL41, SKP2, and                              from patients with SLE differs from that in the CD8+ T
  TULP4. SKP2 was the highest ranked hub gene. These                      cells of healthy controls, which provides insight for SLE
  genes were subjected to GO and KEGG analysis; the                       treatment and may help explain the underlying
  analysis indicated enrichment in protein metabolism                     mechanism of SLE. Moreover, this research also
  modification.                                                           provided an insight into the way of enhance the T cell

                                                                      3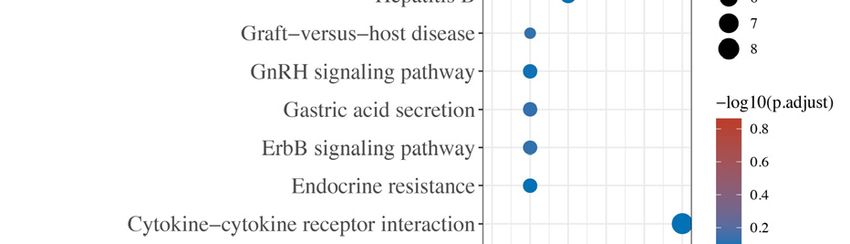
E3S Web of Conferences 271, 03034 (2021)                                                   https://doi.org/10.1051/e3sconf/202127103034
ICEPE 2021

   ability, which might be applied in the chimeric antigen
   receptor T-cell immunotherapy (CAR-T).

                  Fig. 5 PPI network for the predicted proteins of the identified differentially expressed genes (DEGs)

                                                                            transcription signature predicts prognosis in
                                                                            autoimmune       disease.    Nat      Med.    2010
   References                                                               May;16(5):586-91, 1p following 591.
   1.   Katsuyama, Takayuki et al. “Aberrant T Cell                    6.   Arnold, W. J. (ed.) American Rheumatism
        Signaling and Subsets in Systemic Lupus                             Association Glossary Committee: Dictionary of the
        Erythematosus.” Frontiers in immunology vol. 9                      Rheumatic Diseases. Vol I: Signs and
        1088. 17 May. 2018                                                  Symptoms (American College of Rheumatology,
   2.   Kaul A, Gordon C, Crow MK, Touma Z, Urowitz                         1982).
        MB, van Vollenhoven R, Ruiz-Irastorza G, Hughes                7.   Sharma S, Jin Z, Rosenzweig E, Rao S, Ko K,
        G. Systemic lupus erythematosus. Nat Rev Dis                        Niewold TB. Widely divergent transcriptional
        Primers. 2016 Jun 16;2:16039.                                       patterns between SLE patients of different ancestral
   3.   Crispín JC, Kyttaris VC, Terhorst C, Tsokos GC. T                   backgrounds in sorted immune cell populations. J
        cells as therapeutic targets in SLE. Nat Rev                        Autoimmun.        2015       Jun;60:51-58.     doi:
        Rheumatol.       2010      Jun;6(6):317-25.      doi:               10.1016/j.jaut.2015.04.002. Epub 2015 Apr 24.
        10.1038/nrrheum.2010.60. Epub 2010 May 11.                     8.   Barrett T, Wilhite SE, Ledoux P, Evangelista C,
   4.   Coit P, Jeffries M, Altorok N, Dozmorov MG,                         Kim IF, Tomashevsky M, Marshall KA, Phillippy
        Koelsch KA, Wren JD, Merrill JT, McCune WJ,                         KH, Sherman PM, Holko M, Yefanov A, Lee H,
        Sawalha AH. Genome-wide DNA methylation study                       Zhang N, Robertson CL, Serova N, Davis S,
        suggests epigenetic accessibility and transcriptional               Soboleva A. NCBI GEO: archive for functional
        poising of interferon-regulated genes in naïve CD4+                 genomics data sets--update. Nucleic Acids Res.
        T cells from lupus patients. J Autoimmun. 2013                      2013      Jan;41(Database     issue):D991-5.   doi:
        Jun;43:78-84.                                                       10.1093/nar/gks1193. Epub 2012 Nov 27.
   5.   McKinney EF, Lyons PA, Carr EJ, Hollis JL, Jayne               9.   Ritchie, M.E., Phipson, B., Wu, D., Hu, Y., Law,
        DR, Willcocks LC, Koukoulaki M, Brazma A,                           C.W., Shi, W., and Smyth, G.K. (2015). limma
        Jovanovic V, Kemeny DM, Pollard AJ, Macary PA,                      powers differential expression analyses for RNA-
        Chaudhry AN, Smith KG. A CD8+ T cell

                                                                   4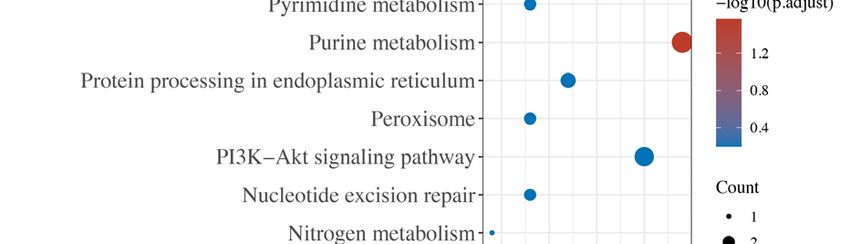
E3S Web of Conferences 271, 03034 (2021)                          https://doi.org/10.1051/e3sconf/202127103034
ICEPE 2021

        sequencing and microarray studies. Nucleic Acids
        Research 43(7), e47.
  10.   Ben Bolstad (2021). preprocessCore: A collection of
        pre-processing functions. R package version 1.52.1.
        https://github.com/bmbolstad/preprocessCore
  11.   Yu G, Wang LG, Han Y, He QY. clusterProfiler: an
        R package for comparing biological themes among
        gene clusters. OMICS. 2012 May;16(5):284-7. doi:
        10.1089/omi.2011.0118. Epub 2012 Mar 28.
  12.   Zhao Y, Wang J, Chen J, Zhang X, Guo M, Yu G. A
        Literature Review of Gene Function Prediction by
        Modeling Gene Ontology. Front Genet. 2020 Apr
        24;11:400.
  13.   Kanehisa M. The KEGG database. Novartis Found
        Symp. 2002;247:91-101; discussion 101-3, 119-28,
        244-52.
  14.   Morel L. Immunometabolism in systemic lupus
        erythematosus. Nat Rev Rheumatol. 2017
        May;13(5):280-290.
  15.   Méndez J, Zou-Yang XH, Kim SY, Hidaka M,
        Tansey WP, Stillman B. Human origin recognition
        complex large subunit is degraded by ubiquitin-
        mediated proteolysis after initiation of DNA
        replication. Mol Cell. 2002 Mar;9(3):481-91.
  16.   Cai Z, Moten A, Peng D, Hsu CC, Pan BS, Manne R,
        Li HY, Lin HK. The Skp2 Pathway: A Critical
        Target for Cancer Therapy. Semin Cancer Biol.
        2020          Dec;67(Pt        2):16-33.       doi:
        10.1016/j.semcancer.2020.01.013. Epub 2020 Feb 1.
  17.   Sharabi A, Tsokos GC. T cell metabolism: new
        insights in systemic lupus erythematosus
        pathogenesis and therapy. Nat Rev Rheumatol. 2020
        Feb;16(2):100-112.
  18.   Liu D, Fang YX, Wu X, Tan W, Zhou W, Zhang Y,
        Liu YQ, Li GQ. 1,25-(OH)2D3/Vitamin D receptor
        alleviates systemic lupus erythematosus by
        downregulating Skp2 and upregulating p27. Cell
        Commun Signal. 2019 Dec 10;17(1):163.

                                                              5
You can also read