2016 Operating Budget Overview - "Balancing Vision and Economic Reality" Craig Curtis, City Manager - The City of Red Deer
←
→
Page content transcription
If your browser does not render page correctly, please read the page content below
2016 Operating Budget Overview
             “Balancing Vision and Economic Reality”
Craig Curtis, City Manager                        January 6, 2016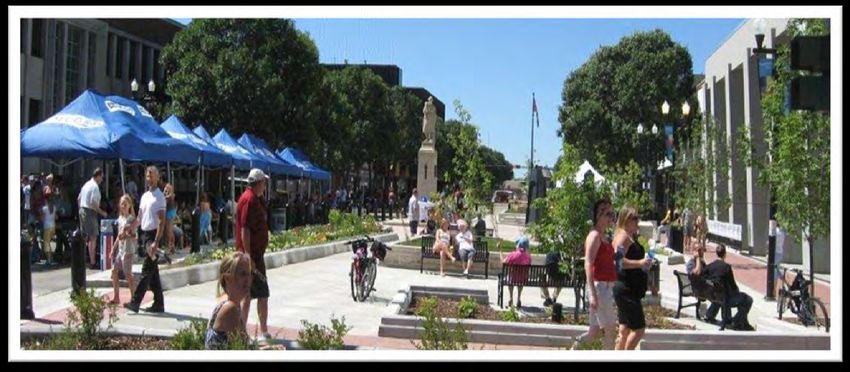
Operational Planning
                                 2

• The Strategic Plan is the
  direction set by Council that guides
  Administration.
• Strategic Plan Implementation
  includes comprehensive,
  coordinated plans detailing
  organizational work to achieve the
  Direction.
• The Budget implements the
  course for 2016.
Our Vision
                         3

         Innovative Thinking
           Inspired Results
         Vibrant Community
Our Mission
                            4

    The City of Red Deer works together to provide
  leadership and sustainable municipal services for our
                       community.
2015 – 2018 Strategic Direction
5
Strategic Direction
2015 - 2018
Adopted September 15, 2014
Principles:
Citizen focused service
Accessible and welcoming community
Strategically oriented leadership
2015 – 2018 Strategic Direction
                        6

                  Three Themes
2015 – 2018 Strategic Direction
                          7

             Five Sub- Themes Underway
          from 2012-2014 Strategic Direction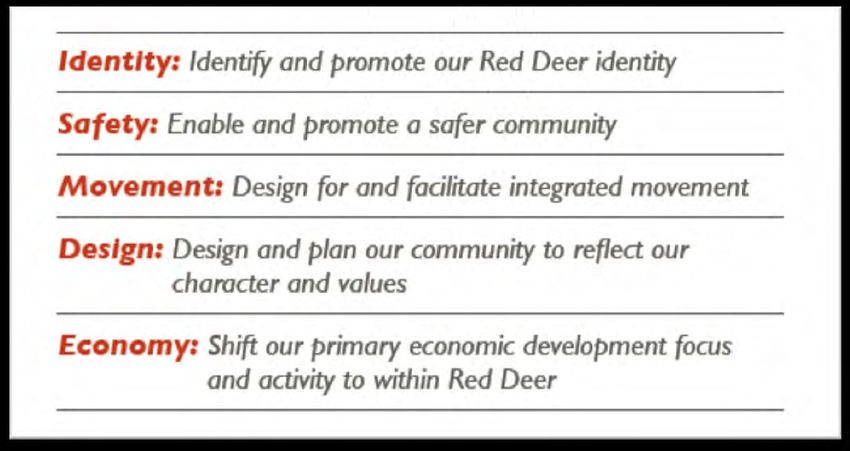
Dialogue
Engage our Community and Enhance our Relationships
8
2014 / 2015 Actions
Dialogue Charter was developed under the former
Strategic Direction 2009/14 and is now being updated.
The majority of strategies outlined in the Charter have
been completed including the research and development
of a Public Participation Framework.
The “Public Participation Toolbox” was adopted by
Council in January and has been tested on a number of
scenarios and projects. Full implementation in 2016.
Advisory Committees are a tool for dialogue and
engagement. Council is in the process of reviewing the
current committee structure.
The City is placing a high priority on advocacy and
Council’s advocacy priorities have been communicated
with the new Provincial Government.
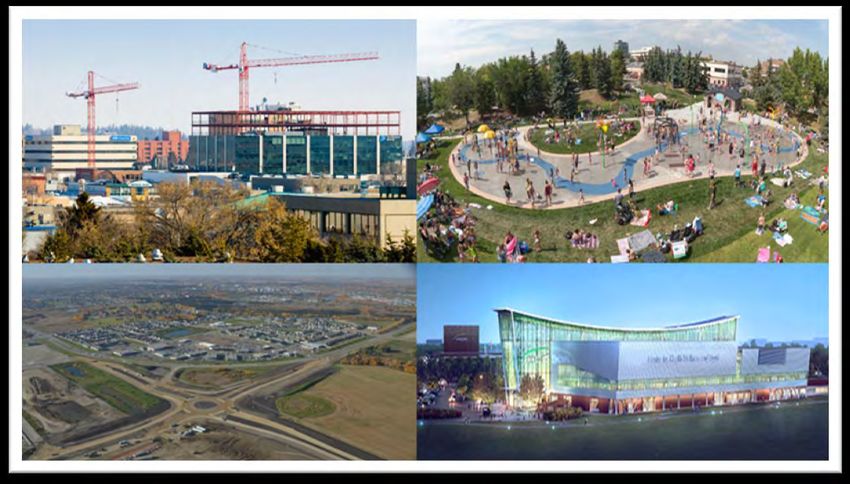
Community Amenities
Planning Great Spaces and Places for Community Living
                                           9
                                              2014 / 15 Actions
                    •   Major community consultation on community amenities to assist
                        Council’s decision making regarding the 10 year Capital Budget
                    •   Consultation included three phases: Development, Prioritization
                        and Confirmation. Based on a series of criteria, a prioritized list
                        of community amenities was established.
                    •   During the consultation process, a Multi-use Aquatic Centre
                        review committee was established to advise Council on the size,
                        location, cost and phasing of the centre.
                    •   In the 2015-2025 Capital Plan, Administration included 15 of the
                        top 20 ranked amenities. The Aquatic Centre is currently
                        scheduled for 2020-2022.
                    •   City Council only approved the 2015 Capital Budget items which
                        included funding for the replacement of the Red Deer Arena and
                        the development of the North Red Deer Regional Community
                        Centre. Capital projects related to the 2019 Canada Winter
                        Games were previously approved.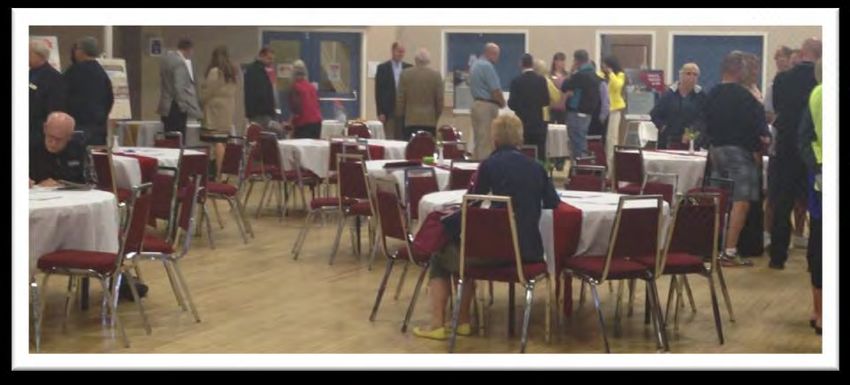
Financial Leadership
Creating a Sustainable Financial Foundation
10
2014 / 2015 Actions
Conducted financial workshops to develop budget guidelines with
a focus on long term financial planning.
Detailed Budget Guidelines adopted by Council on April 27th with
clear direction for both Operating and Capital Budgets.
Initial financial metrics were endorsed by the Audit Committee in
June.
Value for Money Audit Terms of Reference were presented to the
Audit Committee in June. Updated Terms of Reference were
approved by the Audit Committee in August and the project is
underway.
Modified Capital and Operating Budget format to show projects
and initiatives by function and not by Divisions and Departments.
Convened an initial Financial Workshop for the development of
the Charter for Financial Leadership.Sustainability Plan
11
2016 Sustainability Pillars
Environment Governance Social Economic Culture
Economic
Environmental Governance Social Policy Culture Vision
Development
Master Plan Framework Framework Strategy
Implementation Ongoing Review Implementation Implementation Revise and Update in 2017Budget Process
12Budget Process
13
Budget Public Meeting May 20, 2015
Budgets Submitted by Departments July 2015
Mid Year Budget Review August 18, 2015
City Manager Review of
September / October 2015
Departmental Budget Submissions
Council Considers Capital Budget November 25, 2015
Council Considers Operating Budget January 6, 2016Dialogue
14
Budget Public Meeting
o Amenity Survey
o Budget Survey
Let’s Talk
Ipsos Survey (Statistically Accurate)
Banister Survey
Public Market
o Displays, discussions, surveys
Upgraded Website
Budget Open House May 11, 2015:
Ad Hoc Committees 105 in Attendance
Open Houses2015 Citizen Satisfaction Survey
Base slides from the June 2015 survey, percentages noted with an
* from the December 2015 survey.
15 © 2015 Ipsos. All rights reserved. Contains Ipsos' Confidential and Proprietary information and
may not be disclosed or reproduced without the prior written consent of Ipsos.Overall Quality of Life
*40%
*97%
64%
*57%
*3%
*97%
*40%
16Change in Quality of Life Past Three Years
*28%
55%
*48%
*20%
*5%
16Overall Satisfaction with City Services
*38%
*95%
60%
*57%
*5%
*95%
*38%
17Value for Taxes
*28%
*88%
67%
*60%
*88%
*28%
18Balancing Taxation and Service Delivery Levels
34%
*32%
*56%
29%
*25%
19%
*24%
*36%
11%
*11%
*56%
*36%
19Satisfaction with Municipal Operations
*91%
*20% *71%
*89%
*20% *69%
*89%
*19% *70%
*91%
*89%
*89%
20Top Three Priorities for the Next 12 Months
(Unprompted)
*37%
*33%
*32%
*15%
*21%
*3%
*9%
*7%
*9%
*2%
*2%
*17%
*12%
*4%
21Budget Public Open House
23
Fact Sheet
Dialogue in Action: Pilot Project
Attendees: 105
Surveys (Budget): 25
Online: 360Budget Public Open House
Survey Results
24
Overall Satisfaction with City Services: Ipsos
Results:
Good Value 67.70% 92% *95%
Poor Value 32.30% 7% *5%Budget Public Open House
Survey Results
25
Ipsos
Top Five Priorities: Next 12 Months: Results:
Road Construction & Snow Removal 68.00%
Safety 44.70% 28% *24%
(Crime)
Emergency Services 38.80%
Waste, Water & Air 31.70%
Neighbourhoods 30.90%Budget Public Open House
Survey Results 26
Top Five Priorities: Next Four Years
Road Construction & Snow
51.00%
Removal
Neighbourhoods 40.90%
Recreation & Culture 34.90%
Emergency Services 33.70%
Safety 32.50%Budget Public Open House
Survey Results
27
Balancing Taxation and Service Delivery: Ipsos
Results:
Increase Taxes to Enhance
or Expand Services: 34%
62.3% 62% *56%
Increase Taxes to
Maintain Services: 27%
Cut Services to
Maintain Current Tax Level: 26.3% 19% *24%
Cut Services to
Reduce Taxes: 11.4% 11% *11%Budget Public Open House
Survey Results
28
How Would You Spend Your Tax Dollars
Road Construction & Snow Removal 20.40%
Safety 19.40%
Emergency Services 15.80%
Recreation & Culture 13.20%
Waste, Water & Air 11.80%
Parks 10.10%
Neighbourhoods 10.00%
Transit 8.80%
Electricity 8.30%Community Check-Up
American Cities of the Future
29
2015/2016 Winners
Top 10 Micro Cities – Cost EffectivenessCommunity Check-Up
American Cities of the Future
30
2015/2016 Winners
Cost Effectiveness Judging Criteria (Summary)
• Average annual salary for an unskilled • Petrol prices ($ per litre)
worker ($) • Minimum wage ($ per hour)
• Average annual salary for a semi-skilled • Cost to export ($ per container)
worker ($)
• Cost to import ($ per container)
• Average annual salary for a skilled
worker ($) • Cost of establishing a business (absolute
value using gross national income from
• Annual rent for a prime grade A office World Doing Business guide)
space ($/m2)
• Corporation tax rate
• Annual rent for prime grade A industrial
space ($/m2) • Common indirect tax
• Electricity ($ per kilowatt hour) • Country purchasing power parity /
exchange rate
• Four-star hotels in city centre locationCommunity Check-Up
American Cities of the Future
31
2015/2016 Winners
Top 10 Micro Cities – FDI StrategyCommunity Check-Up
American Cities of the Future
32
2015/2016 Winners
FDI Strategy Judging Criteria (Summary)
• Economic Development
• Attraction
• Retention
• Plans, Strategies, PoliciesCommunity Check-Up
Communities in BOOM
33
Canada’s Top Entrepreneurial Cities 2015
Ranked # 23 out
of 121 CitiesCommunity Check-Up
Communities in BOOM
34
Canada’s Top Entrepreneurial Cities 2014
• CFIB’s 7th annual look at what entrepreneurial characteristic’s Canada’s largest
cities possess.
• A wide range of data is collected to capture the level of dynamism of each
community and then place it on a measurable scale.
• One often sees higher entrepreneurial activity in resource regions as well,
although economies there can suffer from wider boom and bust business cycles.
• Favourable resource development conditions will attract businesses seeking to
service increased activity—and, when conditions deteriorate, a strong base of
experienced business owners often becomes the primary pillar of community
support.Community Check-Up
Communities in BOOM
34
Canada’s Top Entrepreneurial Cities 2014
Policy Ranking: Supportive Local Government Policy
• Local Government Tax Balance
• Cost of Local Government
• Local Government Sensitivity to Local Businesses
• Local Government Regulations
• Participation in BizPalAlberta Venture Magazine: 25 Best Communities for
Business in Western Canada November 2013
36Budget Timing – Operating Budget
37
Operating Budget: January 6th through 16th, 2016
Council will consider:
Operating Budget 2016 Approval (including future year impacts).
Operating Plan 2017-2018 Approval in principle.Budget Guidelines: Financial Parameters
38
1. A 1% capital contribution (amenities and growth) amount in the 2016 and
2017 Operating Budgets as prior approved items approved by Council in
the 2015 Operating Budget.
2. A property tax revenue requirement not to exceed 5.0% for the 2016
Operating Budget.
3. A property tax revenue requirement not to exceed 5.0% for the 2017 and
2018 Operating Plan.
4. The 2016 Capital Budget to be within a debt limit not to exceed 67%.
5. The 2017-2025 Capital Plan to be within a debt limit not to exceed 67%.
6. Reserves will be in a positive balance.
7. Departments will continue to identify areas for cost savings, efficiencies,
revenue strategies and innovations with quantification in dollars where
possible. These will also include items identified by Council.Operating Budget
39Mid Sized Cities Outlook 2015 / 2016
40
• Red Deer’s economy is forecasted to drop 1.2% in 2015 following a rise of 3.4% in
2016. This is projected to cut employment 3.6% and raise unemployment to 6.7%
(5.8% projected last year).
• The decrease in oil prices will result in Red Deer’s economic output shrinking
with primary and utilities output falling 2.5%.
• Manufacturing output is expected to rise only 0.1% due to ongoing weakness in
the Canadian dollar.
• Red Deer’s service sector is expected to expand at a rate of 0.4%, the slowest
since 2009. A 1.9% expansion was previously projected.
• The Conference Board of Canada projects 2016 as a recovery year
with 1.5% growth. Employment growth is only projected at 0.6%.2016 Budget Financial Perspectives
41
• Projected revenue from new growth (assessment) has reduced by $500,000.
• Base Provincial MSI grant has been reduced by 20% - offset in 2015 with
one-time funding. (This follows the direction in the “Prentice” budget).
• Preliminary projections in the Provincial budget shows the MSI grant
increasing in 2016 to make up for the one-time funding.
• The Province has announced a review of municipal funding and the big cities
are indicating their needs as metropolitan areas are greatest.
• Increases in FCSS funding have been announced which will require the
provision of additional matching dollars of approximately $150,000.
• The Province has eliminated the long standing Payments in Lieu of taxes for
social housing. This results in a loss of revenue to The City of $455,000.
The Prentice budget only eliminated some of the payments in lieu which
would have resulted in a loss of revenue of $190,000.Overall Goal for the 2016 Operating Budget
41
“Balancing Vision and Economic Reality.”Operating Budget Key Drivers
42
The key drivers of the Operating Budget are:
• The need to be responsive to the community’s desire
to keep tax increases to a minimum.
• The need to align all new service plan initiatives with
the Strategic Direction and the priorities established
by Council.
• The need to accommodate the cost of initiatives
approved in 2015 but not fully funded in the 2015
budget.Operating Budget Key Drivers
43
The key drivers of the Operating Budget (cont’d.):
• The need to maintain an “acceptable” level of
maintenance without significant cost increases.
• The need to fund the increased operating costs of
newly completed community amenities.
• The need to adhere to the Budget Guidelines
approved by Council.2016 Capital Budget
44
• The 2016 Capital Budget was adopted by Council in
November 2015.
• The approved 2016 Capital Budget is $160,589,000,
compared to $173,356,000 in 2015 and $199,542,000
in 2014.
• The 2016 direct tax supported impact of the Capital
Budget on the Operating Budget is $1,798,750 or the
equivalent of a 1.48% tax increase.2016 Operating Budget Recommendations
45
The 2015 Operating Budget was prepared based on the
following:
• The Budget Guidelines adopted by Council on April 27,
2015.
• The overall direction outlined in the 2015 - 2018
Strategic Plan adopted by Council on September 15,
2014.2016 Operating Budget Recommendations
46
The Operating and Capital Budgets include the implementation of
key initiatives and strategies in the following approved plans:
• Environmental Master Plan
Waste Management Master Plan
Greenhouse Gas (GHG) Inventory
Greening the Fleet Study
• Greater Downtown Action Plan
Riverlands Area Redevelopment Plan2016 Operating Budget Recommendations
47
Approved plans continued:
River Valley and Tributaries Park Concept Plan
Community Culture Vision
Economic Development Strategy
Neighbourhood Design Standards
Mobility Playbook
Major Area Structure Plans
Neighbourhood Area Structure PlansCost Savings / Revenue Generation Initiatives
48
• The Budget Guidelines require each department to
identify their operating budget needs as well as potential
cost savings and revenue generating opportunities.
• As the budgets and plans for each department are
prepared, these requirements and opportunities are
discussed with senior City Administration. The options
and related impacts are then discussed as part of the
City Manager review process.Corporate Efficiencies
49
Administration analyzes the base budget on an ongoing basis
and identifies cost savings. The cost savings and FAR’s
include a number of corporate efficiencies identified through
a historical review of variances.
Examples include:
• Revise sanding material specification: $100,000
• Reduce overtime commissionaire coverage: $ 25,000
• Expand internal waste diversion program: $ 14,788Investment Priorities
50
The recommended budget includes investments in the
following priority areas:
Base Budget Items
Maintenance and Modifications
Accommodating Growth
Strategic PrioritiesBase Budget Items
51
Revenue: Emergency Services Dispatch Net: ($255,000)
Building Leases: $321,440
RCMP: Fine Revenue Shortfall: $900,000
Cancellation of payments in lieu of taxes: $455,000
FCSS Cost Sharing (20%) due to Provincial Increase: $150,000
Construction Growth Revenue: ($2,265,000)
Gas Franchise Fee: ($792,056)Maintenance and Modifications
52
GIS Ortho-photography: $50,000 (one-time)
Operationalizing Land Information Systems: $138,951
Preventative Road Maintenance: $309,114
Increased Corporate Fleet Costs: $646,500
Salary Vacancy Factor: ($250,000)Accommodating Growth
53
Future Growth Strategy: $150,000 (one-time)
Roads Maintenance: $183,640 (growth related)
New Neighbourhood Parks Maintenance: $229,087Strategic Priorities
54
Value for Money Audit: $50,000 (one-time)
Diversity and Inclusion Initiative: $40,000 (one-time)
Financial Leadership Charter: $50,000 (one-time)
Risk Management Scoping Study: $50,000 (one-time)
Enforcement Continuum Initiative: $80,860 (one-time)The Financial Bottom Line
55
The Operating Budget consists of the following five
components:
• Prior Year Carry Forwards
• Impact of Prior Year Budgets
• Funding Adjustment Recommendations
• Cost Savings2016 Operating Budget
56
Prior to including the FARs, the impact on property
taxes is as follows:
Prior Year Carry Forwards 0%
Impact of Prior Year Budgets + 2.90%
Net Increase + 2.90%2016 Operating Budget
57
• The value of the FAR’s as originally submitted in July
was $6,250,025.
• The FAR’s in combination with the Base Budget and
the Impact of Prior Years would have resulted in a tax
increase of 8.04%.
• The City Manager and the Corporate Leadership
Team jointly reduced these requests to a potential
tax impact of 3.78%.2016 Operating Budget As Recommended
58
The 2016 Operating Budget as recommended to
Council has an increase of $4,589,507 or the equivalent
of a 3.78% tax increase (2.41% + 1% for Capital for
Amenities and Growth + 0.37% tax download from The
Province).59 There is a tendency to view City budget documents as being where the VISION meets REALITY. City budget documents must be considered as the means of implementing Council and community vision.
Thank You
            60
You can also read