The China Consumer E-Commerce Opportunity - An Overview of the KraneShares CSI China Internet ETF (Ticker: KWEB)

Page created by Adam Hartman
 
CONTINUE READING
The China Consumer E-Commerce Opportunity - An Overview of the KraneShares CSI China Internet ETF (Ticker: KWEB)
KWEB
                                        6/30/2018

The China Consumer
E-Commerce Opportunity
An Overview of the KraneShares
CSI China Internet ETF (Ticker: KWEB)

Info@kraneshares.com                                1
The China Consumer E-Commerce Opportunity - An Overview of the KraneShares CSI China Internet ETF (Ticker: KWEB)
Introduction to KraneShares

About KraneShares
Krane Funds Advisors, LLC is the investment manager for
KraneShares ETFs. The firm is focused on providing
investors with strategies to capture China’s importance as
an essential element of a well-designed investment
portfolio. KraneShares ETFs represent innovative, first to
market strategies that have been developed based on the
firm and its partners’ deep knowledge of investing. These
strategies allow investors to stay up to date on global
market trends and provide meaningful diversification.

                                                             2
The China Consumer E-Commerce Opportunity - An Overview of the KraneShares CSI China Internet ETF (Ticker: KWEB)
Investment Strategy:
    KWEB                                KWEB seeks to measure the performance of the investable universe of publicly traded China-based companies whose
                                        primary business or businesses are in the Internet and Internet-related sectors.
KraneShares CSI                         KWEB features:
China Internet ETF
                                        • Access to Chinese internet companies that provide similar services as Google, Facebook, Twitter, eBay, Amazon, etc.
                                        • Exposure to companies benefitting from increasing domestic consumption by China's growing middle class
                                        • Exposure to Chinese internet companies listed in both the United States and Hong Kong
                                        China Internet Sector Highlights:
                                        • Chinese retail web sales totaled US$1.14 trillion1 in 2017 (compared to US$453.5 billion3 in the United States).
                                        • China's internet population reached 721 million people, a penetration of only 52.2%2. The U.S. internet population
                                          reached 287 million people, a penetration rate of 88.5%2.
                                        • Total Chinese retail sales reached US$5.8 trillion in 20171
                                        • Online shopping accounted for 19.6% of retail purchases in China in 20171

1. National Bureau of Statistics in China, “Total Retail Sales of Consumer Goods in December 2017”. Retrieved on 6/30/2018. Note: Figures converted from Renminbi to USD
2. Data from internetlivestats.com as of 31 December 2016. Retrieved on 6/30/2018.
3. U.S. Department of Commerce, “Quarterly Retail E-commerce Sales 4th Quarter 2017”. Retrieved on 6/30/2018.
                                                                                                                                                                           3
The China Consumer E-Commerce Opportunity - An Overview of the KraneShares CSI China Internet ETF (Ticker: KWEB)
As China’s population moves into cities, they gain access to better jobs and wages, which in turn has a positive
impact on GDP per capita.

                       China Population Urbanization Rate & IMF China GDP Per Capita Current Prices
         9,000                                                                                                   70

         8,000
                                                                                                                 60
         7,000
                                                                                                                 50
         6,000

         5,000                                                                                                   40
   USD

                                                                                                                      %
         4,000                                                                                                   30

         3,000
                                                                                                                 20
         2,000
                                                                                                                 10
         1,000

            0                                                                                                    0

                                  IMF China GDP Per Capita Current Prices   China Population Urbanization Rate

Source: Bloomberg as of 12/31/2016. Retrieved on 6/30/2018.
                                                                                                                          4
The China Consumer E-Commerce Opportunity - An Overview of the KraneShares CSI China Internet ETF (Ticker: KWEB)
China’s urban population has three times more disposable income than their rural counterparts.

                   China Household Per Capita Annual Disposable Income of Urban & Rural Household
       40000

       35000

       30000

       25000

       20000
 USD

       15000

       10000

        5000

           0

                                     China Household -- Per capita annual disposable income of urban households
                                     China Household - Per capita annual net income of rural households

Source: Bloomberg as of 12/31/2016. Retrieved on 6/30/2018.
                                                                                                                  5
The China Consumer E-Commerce Opportunity - An Overview of the KraneShares CSI China Internet ETF (Ticker: KWEB)
The China Internet Evolution
• In 2014, China’s E-Commerce market size surpassed the U.S.
  for the first time.
• In 2017, China’s total retail sales surpassed total retails sales of the U.S. for the first
  time
• As of 12/31/2016, only 52.2% of China’s population had internet access compared to
  88.5% in the U.S.
• There is potential for substantial continued growth in the Chinese internet sector.

 China / US Internet Statistics                                     China               US
 Total internet population                                        721mm1            287mm1
 % of population with internet access                              52.2%1            88.5%1
 Country’s share of world internet users                           21.1%1             8.4%1
 E-Commerce market size 2017                                       $1.14T2          $453.5B3
 Total retail sales 2017                                            $5.8T2            $5.1T3
 % of online retail sales 2017                                     19.6%2             8.9%3
 2016-2017 growth online sales                                     32.2%2            16.0%3

  1.Data from internetlivestats.com as of 12/31/2016. Retrieved 6/30/2018.
  2.National Bureau of Statistics in China, “Total Retail Sales of Consumer Goods in December 2017” 1/25/2018. Note: Figures converted from Chinese Renminbi to USD
  3.U.S. Department of Commerce, “Quarterly Retail E-commerce Sales 4th Quarter 2017” 2/16/2018.
                                                                                                                                                                      6
The China Consumer E-Commerce Opportunity - An Overview of the KraneShares CSI China Internet ETF (Ticker: KWEB)
A Tale of Two Chinas
In 2013, the services sector surpassed the industrial sector as the largest contributor to China’s GDP for the first time.
While traditional manufacturing is slowing the service sector Purchasing Managers’ Index (PMI) indicates healthy growth in domestic consumption.

                                    China GDP Breakdown                                                                                                    China Manufacturing PMI vs. Non-manufacturing PMI*
                                        (2010 - 2017)                                                                                                                     (6/30/2010-6/30/2018)
       60%                                                                                                        60

       50%
                                                                                                                  55
       40%

                                                                                                    Index Value
       30%                                                                                                        50

       20%
                                                                                                                  45
       10%

        0%
                                                                                                                  40

                                                                                                                                Sep-10
                                                                                                                                         Dec-10

                                                                                                                                                                    Sep-11
                                                                                                                                                                             Dec-11

                                                                                                                                                                                                        Sep-12
                                                                                                                                                                                                                 Dec-12

                                                                                                                                                                                                                                            Sep-13
                                                                                                                                                                                                                                                     Dec-13

                                                                                                                                                                                                                                                                                Sep-14
                                                                                                                                                                                                                                                                                         Dec-14

                                                                                                                                                                                                                                                                                                                    Sep-15
                                                                                                                                                                                                                                                                                                                             Dec-15

                                                                                                                                                                                                                                                                                                                                                        Sep-16
                                                                                                                                                                                                                                                                                                                                                                 Dec-16

                                                                                                                                                                                                                                                                                                                                                                                            Sep-17
                                                                                                                                                                                                                                                                                                                                                                                                     Dec-17
                                                                                                                       Jun-10

                                                                                                                                                  Mar-11
                                                                                                                                                           Jun-11

                                                                                                                                                                                      Mar-12
                                                                                                                                                                                               Jun-12

                                                                                                                                                                                                                          Mar-13
                                                                                                                                                                                                                                   Jun-13

                                                                                                                                                                                                                                                              Mar-14
                                                                                                                                                                                                                                                                       Jun-14

                                                                                                                                                                                                                                                                                                  Mar-15
                                                                                                                                                                                                                                                                                                           Jun-15

                                                                                                                                                                                                                                                                                                                                      Mar-16
                                                                                                                                                                                                                                                                                                                                               Jun-16

                                                                                                                                                                                                                                                                                                                                                                          Mar-17
                                                                                                                                                                                                                                                                                                                                                                                   Jun-17

                                                                                                                                                                                                                                                                                                                                                                                                              Mar-18
                                                                                                                                                                                                                                                                                                                                                                                                                       Jun-18
                Agricutural Industry      Industrial Industry      Service Industry                                      China Non-Manufacturing PMI SA                                                                                                                                                                                        China Manufacturing PMI

Data from Bloomberg as of 12/31/2017, retrieved 6/30/2018                                                         Data from Bloomberg as of 6/30/2018

*The Purchasing Managers' Index (PMI) is an indicator of the economic health of the manufacturing sector. The PMI is based on five major indicators: new orders, inventory levels, production, supplier
deliveries and the employment environment. A PMI of more than 50 represents expansion of the manufacturing sector when compared to the previous month. A PMI reading under 50 represents a
contraction, and a reading at 50 indicates no change. The Non-Manufacturing Purchasing Managers' Index (PMI) is a composite index calculated as an indicator of the overall economic condition for the
non-manufacturing sector. The index is a composite based on four indicators with equal weights: Business Activity (seasonally adjusted), New Orders (seasonally adjusted), Employment (seasonally
adjusted) and Supplier Deliveries.                                                                                                                                                                                                                                                                                                                                                                                              7
The China Consumer E-Commerce Opportunity - An Overview of the KraneShares CSI China Internet ETF (Ticker: KWEB)
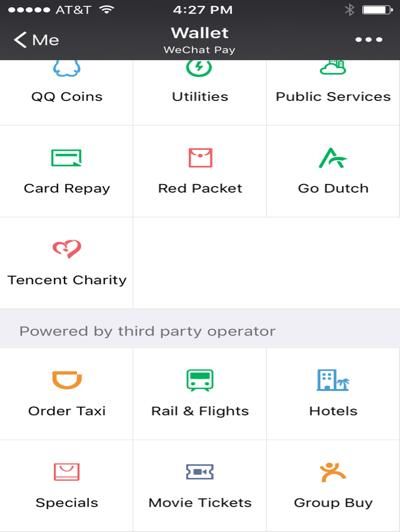
Retail sales have expanded steadily in China

                                    Value of Monthly China Retail Sales Index
                                             (11/30/2008 - 5/31/2018)
                             4000
                                                                                                                   • Total Chinese retail sales reached
                             3500                                                                                    $5.8 trillion in 2017
                             3000
                                                                                                                   • Chinese retail websites sold $1.14 trillion
Index Value (CNY Billions)

                             2500                                                                                    worth of goods in 2017, a 32.2% year-on-year
                             2000
                                                                                                                     increase.

                             1500                                                                                  • Online shopping accounted for 15% of total
                                                                                                                     retail sales in 2017.
                             1000

                              500                                                                                   Source: National Bureau of Statistics in China, “Total Retail Sales of
                                                                                                                    Consumer Goods in December 2017”. Retrieved on 6/30/2018. Note:
                                                                                                                    Figures converted from Renminbi to USD

Chart data from Bloomberg as of 5/31/2018, retrieved 6/30/2018.
China Retail Sales Index: Retail sales (also referred to as retail trade) tracks the resale of new and used goods to the general
public, for personal or household consumption. This concept is based on the value of goods sold.                                                                                             8
The China Consumer E-Commerce Opportunity - An Overview of the KraneShares CSI China Internet ETF (Ticker: KWEB)
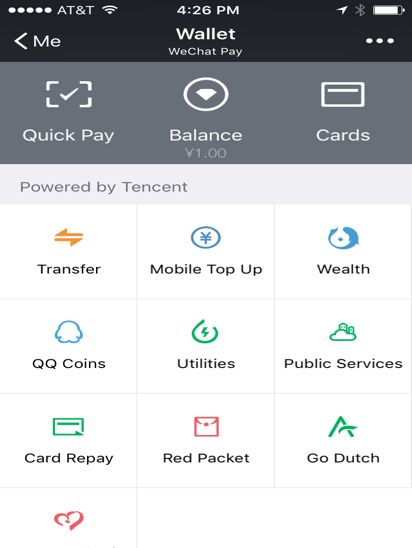
The 1 year and 5 year average revenue growth rates for China internet companies is higher than that of many
U.S. internet companies
Top 10 KWEB holdings vs. their U.S. equivalents

       Top 10 KWEB Holdings      KWEB Weight             China Internet Companies
                                                                                                                                                 U.S. Internet Companies
                                                                                                                      Comparable U.S.
                                                                                             Primary Business
                                                1 Year Average Revenue    5 Year Average                                 Business           1 Year Average    5 Year Average
            as of 06/30/2018   as of 06/30/2018
                                                      Growth Rate      Revenue Growth Rate                                                  Revenue Growth    Revenue Growth
                                                                                                                                                 Rate              Rate

TENCENT HOLDINGS                     10%                55%                    41%               Social Media             Facebook               47%                52%

ALIBABA GROUP HOLDING                9%                 58%                    49%               E-commerce                Amazon                35%                25%

NETEASE INC-ADR                      8%                 27%                    50%              Online Gaming         Activision Blizzard        6%                 10%

BAIDU INC - SPON ADR                 8%                 24%                    31%                  Search                 Google                24%                18%

JD.COM INC-ADR                       7%                 38%                    45%               E-commerce                Amazon                35%                25%

IQIYI INC-ADR                        5%                 55%                    83%             Video Streaming              Netflix              34%                28%

CTRIP.COM INTERNATIONAL              4%                 31%                    45%           Online Travel Services     Booking.com              0%                  3%

AUTOHOME INC-ADR                     4%                 0%                     47%             Online Auto Trade          Cars.com               6%                 10%

SINA CORP                            4%                 57%                    27%               Social Media              Twitter               4%                 55%

MOMO INC-SPON ADR                    4%                 116%                  215%               Social Media                IAC                 15%                 4%

                                  Total: 62%        Average: 46%          Average: 63%                                                       Average: 20%       Average: 23%

The Fund’s holdings are subject to change. Data from Bloomberg as of 6/30/2018                                                                                                 9
The China Consumer E-Commerce Opportunity - An Overview of the KraneShares CSI China Internet ETF (Ticker: KWEB)
Apps like Tencent’s WeChat integrate an ecosystem of services including messaging, social media, mobile
payments, wealth management, & taxi hailing.
                                                                In 2016, the US taxi hailing service Uber sold its Chinese business
                                                                to local competitor Didi (logo below). Unlike Uber, which relies on a
WeChat users can invest in mutual funds through the same app    stand alone app, Didi integrates into the most popular Chinese
they use for social media.                                      social media platforms.

                                                                                                                                        10
The proliferation of E-Commerce in China also benefits Chinese logistics and delivery companies
Over 40 billion packages were delivered in China in 2017, an increase of 28% from the previous year1.

 JD.com warehouse employees prepare same-day delivery                                    Unlike competitor Alibaba, JD.com owns its own logistics network and has
                                                                                         a fleet of delivery vehicles around China

1www.xinhua.net   “China's express delivery firms see rapid growth in 2017”, 1/13/2018                                                                          11
Top Ten Holdings as of 6/30/2018                              % of Fund
KraneShares CSI China Internet ETF (Nasdaq: KWEB)                                                                             The Fund’s Holdings Are Subject to Change.
                                                                                                                              TENCENT HOLDINGS LTD                                                   9.89
Investment Strategy:                                                Key Fund Information                                      ALIBABA GROUP HOLDING-SP                                               8.95
KWEB (the Fund) tracks the CSI Overseas China Internet Index                                                                  NETEASE INC-ADR                                                        8.05
(the Index) and invests in China based companies whose             Ticker                            KWEB                     BAIDU INC - SPON ADR                                                   8.00
primary business or businesses are focused on internet and
                                                                   Index Name                        CSI Overseas China
internet-related technology. These companies are publicly                                                                     JD.COM INC-ADR                                                         6.61
                                                                                                     Internet Index
traded on either the Hong Kong Stock Exchange, NASDAQ                                                                         IQIYI INC-ADR                                                          4.61
Stock Market, or New York Stock Exchange.                          Primary Exchange                  NYSE
                                                                   Total Annual Fund Operating       0.72%                    CTRIP.COM INTERNATIONAL-A                                              4.49
                                                                   Expense                                                    AUTOHOME INC-ADR                                                       4.08
                                                                   Inception Date                    7/31/2013                SINA CORP                                                              3.93
                                                                   Distribution Frequency            Semiannually             MOMO INC-SPON ADR                                                      3.74

KWEB Performance History as of 6/30/2018

                                                               Cumulative %                                                                       Average Annualized %

                                   3 Mo                           6 Mo                      Since Inception                 1 Yr                          3 Yr                    Since Inception
                                                                                               7/31/2013                                                                             7/31/2013
 Fund NAV                                    -2.86%                           1.37%                       144.78%                    24.83%                        14.05%                           19.97%
 Closing Price                               -2.89%                           1.36%                       145.06%                    24.76%                        14.18%                           20.00%
 Index                                       -2.65%                           1.84%                       144.25%                    25.91%                        14.43%                           19.92%

The performance data quoted represents past performance. Past performance does not guarantee future results. The investment return and principal value of an investment will fluctuate so that an
investor's shares, when sold or redeemed, may be worth more or less than their original cost and current performance may be lower or higher than the performance quoted. For performance data
current to the most recent month end, please visit www.kraneshares.com
Index returns are for illustrative purposes only. Index performance returns do not reflect any management fees, transaction costs or expenses. Indexes are unmanaged and one cannot invest directly in
an index.

                                                                                                                                                                                                        12
KWEB’s investment strategy provides a basket approach to China Internet sector which is aimed at potentially reducing volatility compared to individually held China
Internet stocks.
                                                      Historical Return / Volatility of KWEB & Its Top Holdings Since KWEB Inception (7/31/2013) & The Year 2016 and 2017

                      Since Inception (7/31/2013 - 6/30/2018)                                                               12/31/2015 - 12/31/2016                                                          12/31/2016 - 12/31/2017
 500                                                                                   60                                                                                    200

                                                                                                                                                                                    RETURN (%)
                          TENCENT                                                                                                               TAL

                                                                                               Return (%)
                                                                                                                                                                                                                        JD
        RETURN (%)

 400                                                                                   40                                                                                    180
                                                                                                                                        SINA                                 160
                                                                                                                   700 HK                                                                                                         Kingsoft
 300
                                       NETEASE                                         20                                           NTES
                                                                                                                                                                             140
                                                                                                            KWEB        BABA
                                                                                         0                                                                                   120
 200                                 51JOB                          VIPSHOP
                                                                                                               CTRP BIDU                                                     100
                                                     CTRIP                            -20                                      JD
                          KWEB                                                                                                                             VIPS               80        TENCENT BABA                            58.com
 100                                BAIDU                                                                                                                                                                                                          Autohome
                                                          KINGSOFT                    -40                                                                                     60
                                                          SINA                                                                           WUBA
    0                                                                                                                                                                                                 BIDU        NetEase
                                       RENREN                                         -60                                                                                     40                                                          YY
                                                                     FANG
                                                                                                                                                                              20    KWEB               VIPshop
-100                                                                                  -80                                                                                      0
        20           25       30     35        40        45         50         55            20                    30               40                50              60           20            25      30        35        40          45        50         55
                                                          VOLATILITY† (%)                                                                        VOLATILITY† (%)                                                                              VOLATILITY† (%)

   Top Ten Holdings as of 7/31/2013                  Ticker                %                  Top Ten Holdings as of 12/31/2015                  Ticker              %                      Top Ten Holdings as of 12/31/2016             Ticker              %
   Subject to Change.                                                                         Subject to Change.                                                                            Subject to Change.
   BAIDU INC - SPON ADR                              BIDU                  10.37             TENCENT HOLDINGS LTD                               700 HK               10.61              TENCENT HOLDINGS LTD                             700 HK                10.91
   TENCENT HOLDINGS LTD                              700 HK                 9.62             ALIBABA GROUP HOLDING-SP ADR                       BABA US               8.93              ALIBABA GROUP HOLDING-SP                         BABA                   8.94
   CTRIP.COM INTERNATIONAL-ADR                       CTRP                   6.77             BAIDU INC - SPON ADR                               BIDU US               7.68              BAIDU INC - SPON ADR                             BIDU                   8.17
   NETEASE INC-ADR                                   NTES                   6.61             CTRIP.COM INTERNATIONAL-ADR                        CTRP US               6.39              JD.COM INC-ADR                                   JD                     7.09
   SINA CORP                                         SINA                   4.83             JD.COM INC-ADR                                     JD US                 6.28              CTRIP.COM INTERNATIONAL-A                        CTRP                   6.26
   VIPSHOP HOLDINGS LTD - ADR                        VIPS                   4.80             NETEASE INC-ADR                                    NTES US               4.33              TAL EDUCATION GROUP- ADR                         TAL                    4.19
   FANG HOLDINGS LTD - ADR                           SFUN                   4.28             58.COM INC-ADR                                     WUBA US               4.21              KINGSOFT CORP LTD                                3888 HK                4.15
   KINGSOFT CORP LTD                                 3888 HK                3.97             QIHOO 360 TECHNOLOGY CO-ADR                        QIHU US               4.21              NETEASE INC-ADR                                  NTES                   4.14
   RENREN INC-ADR                                    RENN                   3.53             YOUKU TUDOU INC-ADR                                YOKU US               4.14              VIPSHOP HOLDINGS LTD ADR                         VIPS                   3.97
   51JOB INC-ADR                                     JOBS                   3.41             SINA CORP                                          SINA US               3.99              SINA CORP                                        SINA                   3.61

 Data from Bloomberg as of 6/30/2018.
 †Volatility: is the degree of variation of a trading price series over time as measured by the standard deviation of returns. Standard deviation: is a quantity calculated to indicate the extent of deviation for a group as a whole. A low standard deviation
 indicates that the data points tend to be close to the mean (also called the expected value) of the set, while a high standard deviation indicates that the data points are spread out over a wider range of values.
 The performance data quoted represents past performance. Past performance does not guarantee future results. The investment return and principal value of an investment will fluctuate so that an investor's shares, when
 sold or redeemed, may be worth more or less than their original cost and current performance may be lower or higher than the performance quoted.
 For performance data current to the most recent month end, please call +(1)855 8KRANE8 or visit our website at www.kraneshares.com/kweb/.                                                                                                                         13
KWEB Performance

KWEB’s performance compared to the U.S., Emerging Markets, & Other China Indexes

                 Since KWEB Inception (7/31/2013) as of 03/31/2018*                                                                      Past Year as of 06/30/2018*
   200%                                                                                                      30%
                                                                                                                      25.91%

              144.25%                                                                                                                22.00%
   150%                                                                                                                                           20.52%
                                                                                                             20%

                                                                                                                                                                             14.09%        14.36%
   100%
                                78.54%                           73.71%
                                                72.08%
                                                                                                             10%                                                8.53%
                                                                                  51.05%
    50%
                                                                                                  28.65%

                                                                                                             0%
     0%
                                                                                                                     CSI China      MSCI China   S&P China      MSCI       FTSE China 50 S&P 500 Index
              CSI China      S&P 500 Index     S&P China       MSCI China     FTSE China 50 MSCI Emerging
                                                                                                                     Overseas         Index      Index BMI    Emerging        Index
              Overseas                         Index BMI         Index           Index      Markets Index
                                                                                                                   Internet Index                            Markets Index
            Internet Index

Total return gross dividend tax data from Bloomberg as of 6/30/2018. See page 12 for standard performance.

*Cumulative return is the aggregate amount that an investment has gained or lost over time.
The performance data quoted represents past performance. Past performance does not guarantee future results. The investment return and principal value of an investment will fluctuate so that an
investor's shares, when sold or redeemed, may be worth more or less than their original cost and current performance may be lower or higher than the performance quoted. For performance data
current to the most recent month end, please visit www.kraneshares.com
See page 16 for index definitions.
Index returns are for illustrative purposes only. Index performance returns do not reflect any management fees, transaction costs or expenses. Indexes are unmanaged and one cannot invest directly
in an index.
The S&P 500 and MSCI Emerging Markets Indexes were chosen to represent the U.S. and broader emerging markets respectively because they are considered to be the industry standard bearers for
representing these markets.The S&P China BMI, MSCI China and FTSE China 50 indexes were chosen because they are popular measures of the broad Chinese market and are helpful for illustrating how the
Chinese technology sector performs relative to the Chinese markets as a whole.
                                                                                                                                                                                                         14
Important Notes
Carefully consider the Funds’ investment objectives, risk factors, charges and expenses before investing. This and additional information can be found in the Funds' full and
summary prospectus, which may be obtained by visiting www.kraneshares.com. Read the prospectus carefully before investing.
ETF shares are not redeemable with the issuing fund other than in large Creation Unit aggregations. Instead, investors must buy or sell ETF Shares in the secondary market with
the assistance of a stockbroker. In doing so, the investor may incur brokerage commissions and may pay more than net asset value (NAV) when buying and receive less than net
asset value when selling. The NAV of the Fund’s shares is calculated each day the national securities exchanges are open for trading as of the close of regular trading on the
New York Stock Exchange (“NYSE”), normally 4:00 P.M. Eastern time (the “NAV Calculation Time”). Shares are bought and sold at market price not NAV. Closing price returns are
based on the midpoint of the bid/ask spread at 4:00 P.M. Eastern Time (when NAV is normally determined).
Investing involves risk, including possible loss of principal. There can be no assurance that a Fund will achieve its stated objectives. The Funds are subject to political, social or
economic instability within China which may cause decline in value. Fluctuations in currency of foreign countries may have an adverse effect to domestic currency values.
Emerging markets involve heightened risk related to the same factors as well as increase volatility and lower trading volume.
Narrowly focused investments typically exhibit higher volatility. Internet companies are subject to rapid changes in technology, worldwide competition, rapid obsolescence of
products and services, loss of patent protections, evolving industry standards and frequent new product productions. Such changes may have an adverse impact on
performance. The fund is non-diversified.
Although the information provided in this document has been obtained from sources which Krane Funds Advisors, LLC believes to be reliable, it does not guarantee accuracy of
such information and such information may be incomplete or condensed.
The KraneShares ETFs are distributed by SEI Investments Distribution Company (SIDCO), which is not affiliated with Krane Funds Advisors, LLC, the Investment Adviser for the
Fund.

                                                                                                                                                                                     15
Important Notes (continued)
The S&P 500 Index: is an American stock market index based on the market capitalizations of 500 large companies having common stock listed on the NYSE or NASDAQ. The
MSCI Emerging Markets Index: captures large and mid cap representation across 23 Emerging Markets (EM) countries. With 834 constituents, the index covers approximately
85% of the free float-adjusted market capitalization in each country. FTSE China 50 Index: is a real-time tradable index comprising 50 of the largest and most liquid Chinese
stocks (H Shares, Red Chips and P Chips) listed and trading on the Stock Exchange of Hong Kong (SEHK). MSCI China Index: The MSCI China Index captures large and mid cap
representation across China H shares, B shares, Red chips and P chips. With 157 constituents, the index covers about 84% of this China equity universe. S&P China BMI Index:
is a comprehensive benchmark that defines and measures the investable universe of publicly traded companies domiciled in China, but are legally available to foreign investors.
Index returns are for illustrative purposes only. Index performance returns do not reflect any management fees, transaction costs or expenses. Indexes are unmanaged
and one cannot invest directly in an index.
Although Krane Funds Advisors LLC and its affiliates (“Krane”) shall obtain data from sources that Krane considers reliable, all data contained herein is provided “as is” and
Krane makes no representation or warranty of any kind, either express or implied, with respect to such data, the timeliness thereof, the results to be obtained by the use
thereof or any other matter. Krane expressly disclaims any and all implied warranties, including without limitation, warranties of originality, accuracy, completeness,
timeliness, non-infringement, merchantability and fitness for a particular purpose.
Forward-looking statements (including Krane’s opinions, expectations, beliefs, plans, objectives, assumptions, or projections regarding future events or future results)
contained in this presentation are based on a variety of estimates and assumptions by Krane. These statements generally are identified by words such as “believes,” “expects,”
“predicts,” “intends,” “projects,” “plans,” “estimates,” “aims,” “foresees,” “anticipates,” “targets,” “should,” “likely,” and similar expressions. These also include statements
about the future, including what “will” happen, which reflect Krane’s current beliefs. These estimates and assumptions are inherently uncertain and are subject to numerous
business, industry, market, regulatory, geo-political, competitive, and financial risks that are outside of Krane’s control. The inclusion of forward-looking statements herein
should not be regarded as an indication that Krane considers forward-looking statements to be a reliable prediction of future events and forward-looking statements should not
be relied upon as such. Neither Krane nor any of its representatives has made or makes any representation to any person regarding forward-looking statements and neither of
them intends to update or otherwise revise such forward-looking statements to reflect circumstances existing after the date when made or to reflect the occurrence of future
events, even in the event that any or all of the assumptions underlying such forward-looking statements are later shown to be in error. Any investment strategies discussed
herein are as of the date of the writing of this presentation and may be changed, modified, or exited at any time without notice.
This material represents an assessment of the market environment at a specific point in time and is not intended to be a forecast of future events, or a guarantee of future
results. This information should not be relied upon by the reader as research or investment advice regarding the funds or any stock in particular.

                                                                                                                                                                                 16
You can also read