Symrise AG Investor Presentation
←
→
Page content transcription
If your browser does not render page correctly, please read the page content below
DISCLAIMER: ”The following document contains protected and confidential information from Symrise and must be kept in confidence. This information may not be used by anyone who obtains it if Symrise has not granted written permission to do so.”

       Symrise AG
       Investor Presentation

Olaf Klinger (CFO) – August-September, 2019
Symrise
Overview

                                                               Based on                           Symrise’s products provide exciting flavor and

  Sales: €              3.2bn*                       ~10,000
                                                                                                   fragrance experiences and contribute to the
                                                                                                      health and well-being of consumers in

    EBITDA-margin:             20        %*
                                                        mostly natural raw
                                                            materials                                  ~160
                                                                                                        countries around
                                              including vanilla, citrus products, onions, fish,            the world.
                                                meat and flower and plant materials, these
                                               products are custom-tailored for every region
               Symrise offers                                  of the world.
                                                                                                  ~10,000
         ~30,000
        innovative fragrances and flavors,
                                                                                                      employees
                                                                                                    around the world make up the company.
           cosmetic ingredients and pet                                                            Their hard work, passion and diversity are
                food ingredients.                                                                        key to the company’s success.

*2018
                                                                                                                                                   2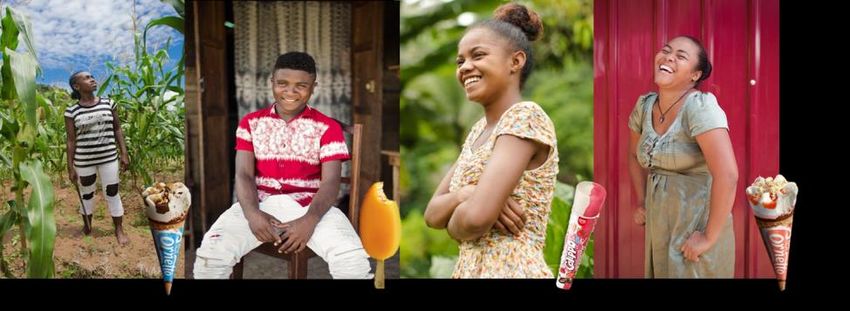
Our Mission & Vision
How we measure up & what drives us forward

 We are a global supplier of fra-         We strive to ensure long-term-           We combine our knowledge of
 grances, flavors, food and cosmetic      oriented value creation and allow        consumers’ everchanging needs
 ingredients. Its clients include manu-   all of our stakeholders to participate   with creativity and groundbreaking
 facturers of perfumes, cosmetics, food   in the company’s success. We take        technologies. At the same time, we
 and beverages, pharmaceuticals and       responsibility by fulfilling our motto   concentrate on developing custo-
 producers of nutritional supplements     of “always inspiring more ...” day       mized product solutions, which
 and pet food.                            after day.                               often contain healthpromoting
                                                                                   or nurturing properties.

 We take our responsibilities seriously letting our creativity unfurl with a focus on the highest quality along with
     sustainable processes and products. This makes even the most everyday items a special experience for
  consumers and their loved ones. In this way we fulfill our motto of “always inspiring more ...” day after day.

                                                                                                                        3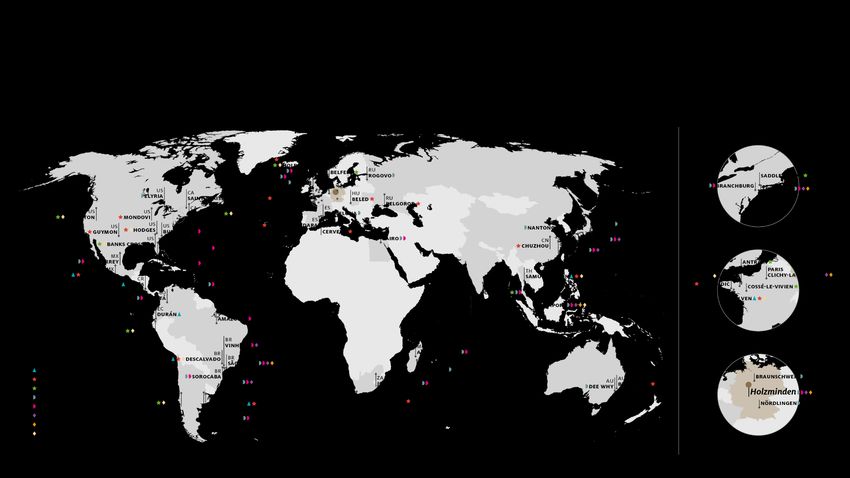
Our Industry
An attractive niche

Megatrends support organic growth:                                            Industry tied to population growth and
…health & wellness … middle class boom & urbanization … naturalness &         disposable income; little dependence on cyclical,
sustainability … traceability … vegetarian/vegan/halal/kosher food …          economic trends.

High market concentration
                                                                Global footprint key to meet local tastes & preferences.
top 4 (Givaudan, IFF, Firmenich and Symrise) with ~47%.

‘Sweet spot’ in value chain: only a small fraction of product costs (1-5%), but a key buying criteria.

                                                                        High barriers to entry e.g. core list system and
Sustainability & supply chain management increasingly important.
                                                                        increasing regulatory pressure.

Tailor-made products with generally small volumes and decreasing product life cycles.

Handling complexity for our clients.
Managing ~10,000 raw materials for ~30,000 products.
                                                          Short-term visibility requires flexibility, mobility and agility.

                                                                                                                                  4
Our Global Footprint
>100 sites around the World

                              5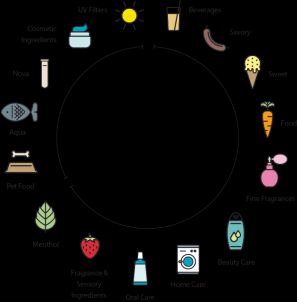
Our Organizational Structure
We operate our business through three segments

                                                                                                          Sales development
                                                                                                          In €m

              FLAVOR                          NUTRITION                                            SCENT & CARE

               Flavor                             Diana                        Fragrances         Cosmetic Ingredients           Aroma Molecules
              Beverages                           Food                        Fine fragrances       Cosmetic actives              Scent componentsMargin
               Savory                            Pet food                   Consumer fragrances          EBITDA* development
                                                                                                     Sun protection                    Menthol
                Sweet                             Aqua                           Oral care               In €m219/ in % of sales
                                                                                                                            234     243
                                                                                                                                 Cooling         244
                                                                                                                                          substances
                                                 Probi 1

                                                                                                              22.3%      23.0%       22.0%      20.5%

                                                                                                             FY 2015     FY 2016    FY 2017    FY 2018

1 Probi   AB is listed in Sweden; Symrise owns 57.65% as per December 31, 2018                                                                             6
Our Corporate strategy
Consequent strategy implementation pays off
Vision
Vision Strategic priorities
Growth
Growth Efficiency Portfolio Focus on organic growth by implementation
· Growth in Emerging · Specific efficiency · Portfolio expansion in of incremental growth projects and capacity
Markets programs Nutrition and expansion
Cosmetics
· Maximization of · Optimizing raw material
Efficiency
customer spectrum portfolio · Bolt-on M&A in the
core business Efficiency programs such as employing
· Targeted innovation artificial intelligence
Sustainability Portfolio
Further driving shift into high margin
Values applications going forward
7Driving growth through targeted investments …
especially in R&D, technology and capacity expansion
Selected growth initiatives 2018
Pet Food Pet Food Fragrances Cosmetic Ingredients
and capacity expansion Elven/France Cervera/Spain Shanghai/China Charleston/USA
In €m Production. €10m Production. €7m R&D. €8m Production. €20m
7.2% 5-6%
of group sales
2018
Flavors Food Ingredients Aroma Molecules
226 Branchburg/USA
Technology. €10m
Banks County/USA
Production. €50m
Holzminden/Germany
~200 Production. €10m
2019
Fragrances Menthol Fragrances/Flavors Logistic
Holzminden/Germany Charleston/USA Nantong/China Holzminden/Germany
Technology. €15m Production. €30m Production. €50m New Site. €10m
2018 2019 est.
8… and carefully selected acquisitions like ADF/IDF
A unique provider of meat- and egg-based protein
ADF/IDF
•
is operating 2 business segments… … serving a diversified client base
Key multinationals
$136m Long-standing relationship
Chicken 62 % Recurring and stable revenue
$84m
Egg 38 % Growing regional brands
Fostering product innovation
Providing further growth potential
Meat-based ingredients Egg-based ingredients
• Chicken-based ingredients for pet food and food • Egg-based ingredients for pet food
• Pet food: supporting trend of quality increase in ingredients • Leading provider of egg-based protein specialties … already fully refinanced
by providing protein specialties • Supporting premium and super-premium pet food brands
• Food: pioneer in clean label & natural taste solutions to develop non-extruded products that mirror human food
- 400m capital increase
- 250m Schuldschein (promissory note)
- 200m term loan
Protein Broth Bone Broth Fat Nutritional Binding Emulsifying egg
egg egg
9Backward integration
Serving the trend towards naturals & traceability
1. Strategic acquisitions that enable Industry-leading backward integration
us to move closer to the origin of the raw 4. Long-term contracts and
materials we process. sustainability partnerships with Naturals and synthetics, e.g. Vanilla,
commitment to purchase e.g. for d/l- Onion, Citrus and Menthol
menthol or bergamot.
No. 1 supplier of fragrance raw
3. Partnerships e.g. materials 1
onion field studies in
cooperation with the Sustainable partnership with farmers
HOL Onion Ring worldwide
Serving the trend towards naturals &
traceability
Securing access to key raw materials
2. Social engagement to improve the living conditions in regions Ambition
like Madagascar and Brazil by investing in local infrastructure, 100% traceability
education and social benefits such as health insurance. of strategic raw materials
by 2020
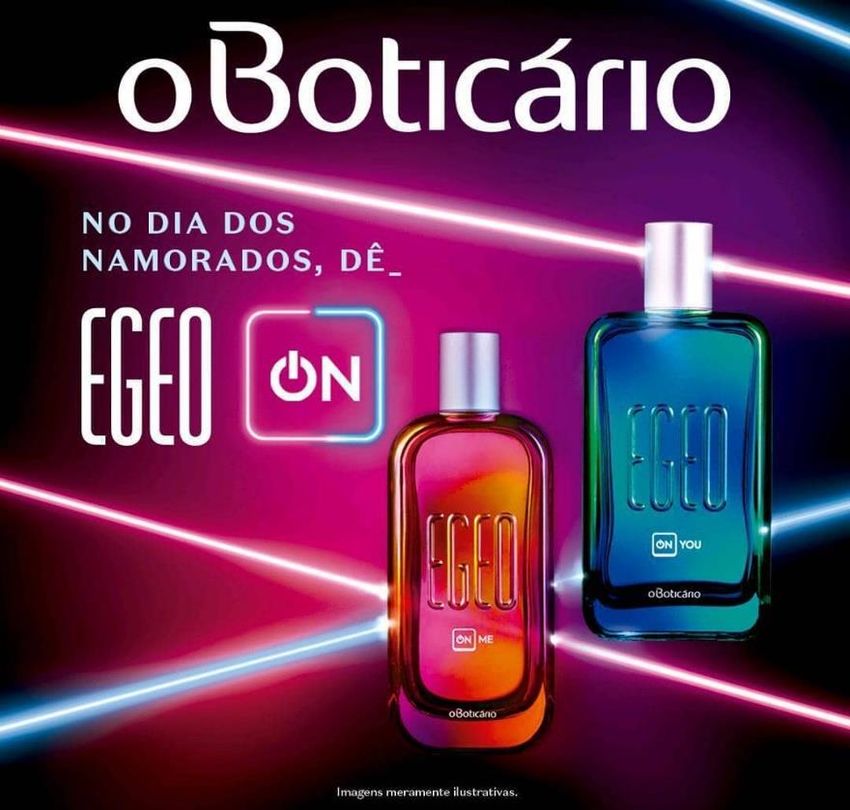
1 E.g. > 80% of oral care compounds are homemade (Menthol, Anethol, Carvone and Cooling compounds)Scent & Care using Artificial Intelligence
O Boticario Fragrances Egeo ON You and ON Me
June 2019 : The first PHILYRA
project launched with O Boticario, the
#1 Brazilian Fragrance Company
—
PHILYRA created two fine fragrances
for the youth-oriented EGEO brand
The AI fragrances scored higher than market
fragrances in consumer blind-tests for liking
11Well-balanced Business Portfolio
across segments, customers, regions and markets
Symrise’s 12 largest customers
Sales distribution by Segment Sales distribution by Region
Distribution by division / BU
Latin
1. Nutrition America
2.
3. Scent & Care
Asia/Pacific EAME
4.
5.
North
Legend Flavor
6. America
Flavor
7.
Diana Food Sales distribution by Customer Type Sales distribution by Markets
8.
Diana Pet Food
9. Fragrance
10. Regional
Oral Care Customers Global Key
11. Accounts Emerging
Cosmetic Ingredients Markets
12. Aroma Molecules
Developed
Markets
• Multiple touchpoints with clients
Local
• The largest customer constitutes only 5% of overall sales Customers
12Expansion beyond traditional Flavor & Fragrances
A unique portfolio with new growth areas
Our portfolio today Leading positions in key application areas
Scent Flavors
— —
Perfumes Nr.1 Nr.1 Natural vanilla
Oral care Savory
Personal care Beverages
Home care Nr.1 Sweet
Fragrance ingredients
Care Nutrition
— —
Cosmetic ingredients Nr.1 Pet food
Sun protection Nr.1 Food ingredients
Aqua cultures
Nr.1 Baby food
Probiotics
13“Vanilla for Change” initiative
Shaping the future of young people in Madagascar and the UK
“Vanilla for Change” initiative
383.0
− Joint initiative with Unilever, its brand Wall’s, Save the
+16.2%
Children, ME to WE and Symrise, launched on May 17, 2019
− Goal is to reinforce
682.0 1,378.5
the support for vanilla farmers and young
people within the vanilla communities +6.4%
+12.4% in Madagascar and
young people in the UK EAME
Northern America
− UK consumers find a ‘Track Your Impact’ QR code on each
Asia/Pacific
Wall’s vanilla ice710.6
cream and can learn about their specific
Latin America
contribution +6.1%
− Benefits provided include health insurance, financial seminars
and training for farmers, and resources and learning
opportunities for teachers and students
− Promoting multiple UN SDGs
14Financial Performance
Profitable growth since IPO
EBITDA
Development of Sales / EBITDA margin-target
Sales and EBITDA in €m, margin in % since 2012
22%
EBITDA
margin
↕
19.8 21.3 19.9 18.0 21.1 20.0 19.5 20.4 21.9 22.0 21.5 21.0 20.0 19%
CAGR
06-18
8.2 %
Sales 1,229 1,275 1,320 1,362 1,572 1,584 1,735 1,830 2,120 2,602 2,903 2,996 3,154
EBITDA 243 272 263 246 331 316 340 373 465 572 625 630 631 8.3 %
2006* 2007 2008 2009 2010 2011 2012 2013 2014* 2015 2016* 2017 2018
* EBITDA adjusted for restructuring and integration expenses 15Financial Highlights H1 2019
Continued strong performance
Sales Business Free Net debt / EBITDA(N)1
Cash Flow
€ 1,692m
+7.4%
7.8% 1.8x
+6.2% vs. 7.3 % H1 2018 Incl. provisions for
Organic growth in Reporting
pensions 2.7x
currency
EBITDA(N)1 margin Net income¹ Outlook 2019:
Improved EBITDA(N)1 margin of
20.8% € 153m
EBITDA(N)1 Earnings per share1,2 ~21%
€ 351m € 1.14
¹ Adjusted for ADF/IDF transaction cost / including IFRS 16 effect 16
² Undiluted, attributable to shareholders of Symrise AGH1 2019
On track for strong growth
Symrise Group Sales by Region in € million
Sales in € million (Organic growth in %)
6.2% 1.2% 7.4% 205.6
+13.3%
18.7
98.2 724.0
375.9 +3.5%
1,575.5 1,692.3
+9.1%
EAME
Northern America
Asia/Pacific
H1 2018 Organic growth Portfolio FX H1 2019 386.8
+5.0% Latin America
6.3% 1.5%
7.8% 1.7%
3.7% 5.4%
41.6 10.0 11.0% -1.5 10.5%
22.4 10.2
34.2 -0.5%
660.1 711.7
604.7 637.4 343.3
310.6
Scent & Care Flavor Nutrition
Sales in € million Sales in € million Sales in € million
H1 2018 Organic Portfolio FX H1 2019 H1 2018 Organic Portfolio FX H1 2019 H1 2018 Organic Portfolio FX H1 2019
growth growth growth
17Sales by region H1 2019
Latin America and Asia/Pacific the strongest growth drivers
By region By Markets
In € m (organic growth in %) as % of Group sales
North
America
387
+5.0% EAME
724
56
Mature Markets
+3.5%
Asia/Pacific
Latin
376 44
Emerging Markets
America +13.3% +9.1%
206
+11.2 % organic growth in
Emerging Markets
18EBITDA(N) H1 2019
Profitability at a good level with a margin of 20.8 %
EBITDA(N)¹ Comments
In € m
Margin EBITDA(N) margin of 20.8% incl. IFRS 16 +€ 9.8m (+0.6 %)
—
20.1% 19.7% 22.6% 19.5% 20.8% Increase in EBITDA due to strong sales growth in comparison to
4.6 increase of raw materials and manufacturing costs
Values 12.4 17.3 —
S&C: EBITDA margin almost at prior year level despite raw material
price increases
—
Flavor: EBITDA margin back at a strong level, partly due to
351.3 decreasing costs of selected raw materials
317.1 —
Nutrition: Decline in EBITDA(N) margin mainly due to delay of
production of the new factory in Georgia and certain higher raw
material costs for Pet Food
—
Group H1 S&C Flavor Nutrition Group H1 ADF/IDF transaction cost normalized; € 9.6m spent in H1 for
2018 2019 transaction and integration preparation; normalized in segment Nutrition
¹ 2019 values include impact of IFRS 16 19Operational Highlights H1
Strategy execution to achieve objectives 2019
Growth Efficiency Portfolio
Menthol: ramp up of new plant in the Cosmetic Ingredients: opening of Acquisition ADF/IDF:
US, start of production in Q3 new development center in Holzminden US-based provider of natural protein
— — solutions (Closing in H2 expected)
Flavor: opening of liquid plant in Russia Vanilla for Change: Unilever, Save —
— the Children, ME to WE initiative Acquisition Cutech: Italian-based
Fragrances: expansion of production in dedicated to purpose-driven ice cream expert in bio-analytical screening
Holzminden brands with society benefits methods
20Outlook specified for 2019
Normalized EBITDA margin of around 21 %
Targets 2019 Growth dynamics
—
Organic growth
Strategically well-positioned, sustainable growth
opportunities through differentiated portfolio
5-7% —
Added competencies through integration of ADF/IDF
CAGR
—
Industry-leading backward integration with focus
on renewable raw materials
Increased Profitability New KPI: Cash flow —
Growth dynamics will lead to higher profitability in 2019
~21% >10% —
Business Free Cash Flow expected to reach double-digit
percentage range of sales for fiscal year
EBITDA(N)1 margin Business Free Cash Flow
1 Excluding ADF/IDF, including IFRS 16 effect 21Objectives 2025
supported by our proven strategy
Financial goals until 2020 until 2025
Sales growth 5 – 7 % pa (CAGR) 5 – 7 % pa (CAGR)
Sales in Emerging Markets > 50 % > 50 %
Customer mix 1/3 global, regional, local 1/3 global, regional, local
EBITDA margin 19 – 22 % 20 – 23 % due to more favorable product mix
CAPEX 5–6% 4 – 5 % by 2022 most of the major invests completed
Dividend 30 – 50 % 30 – 50 % planned to be continued
Sustainability goal
Sustainability goal
33 % improvement of
Environment 50 %1 improvement of footprint
footprint
1 Science-based target (SBT) 2016-2025 22Long-term growth objective confirmed
Doubling sales by 2025
Long-term objectives 2025 Efficient set up, global
In € bn presence and strong portfolio
support business performance in
mid-term until 2022 as well as in
long-term 2025
€ 5.5 – 6.0 bn
€ 4.0 – 4.5 bn
€ 3.0 bn
Organic growth
€ 1.3 bn
Incremental growth
Bolt-on M&A
2009 2017 2022 2025
23Investment Highlights
Diversified, stable and profitable growth
Broadest product portfolio in the industry Highest growth rates in the industry,
…pet food… probiotics… cosmetics… flavors … fragrances… aroma further expansion in adjacent areas
molecules … aqua …
Leading supplier of consumer ingredients Strong focus on new technologies and R&D
‘ always inspiring more ’
German Sustainability Award 2012 and 2019 Benefiting from Mega Trends
Attractive and robust growth market Backward integration secures access to key raw materials
Well balanced client, product and regional mix Investment grade profile
24Symrise AG
Financial calendar & contact
Financial Calendar Contact
Symrise AG
October 29, 2019 Mühlenfeldstraße 1
9M 2019 trading statement 37603 Holzminden, Germany
Tobias Erfurth
Investor Relations
tobias.erfurth@symrise.com
Bernhard Kott
Corporate Communications
bernhard.kott@symrise.com
This document contains forward-looking statements, which are based on the current estimates and assumptions by the corporate management of Symrise AG. Future
performance and the results actually achieved by Symrise AG and its affiliated companies depend on a number of risks and uncertainties and may therefore differ materially
from the forward-looking statements. Many of these factors are outside Symrise’s control and cannot be accurately estimated in advance, such as the future economic
environment and the actions of competitors and others involved in the marketplace. Symrise neither plans nor undertakes to update any forward-looking statements.
25You can also read