PHE Sugar reduction programme - Tazeem Bhatia Consultant in Public Health - Global Non-Communicable Diseases and Obesity
←
→
Page content transcription
If your browser does not render page correctly, please read the page content below
PHE Sugar reduction programme

Tazeem Bhatia
Consultant in Public Health – Global Non-Communicable Diseases and
Obesity

Best Practice Market Place - 20th June 2019
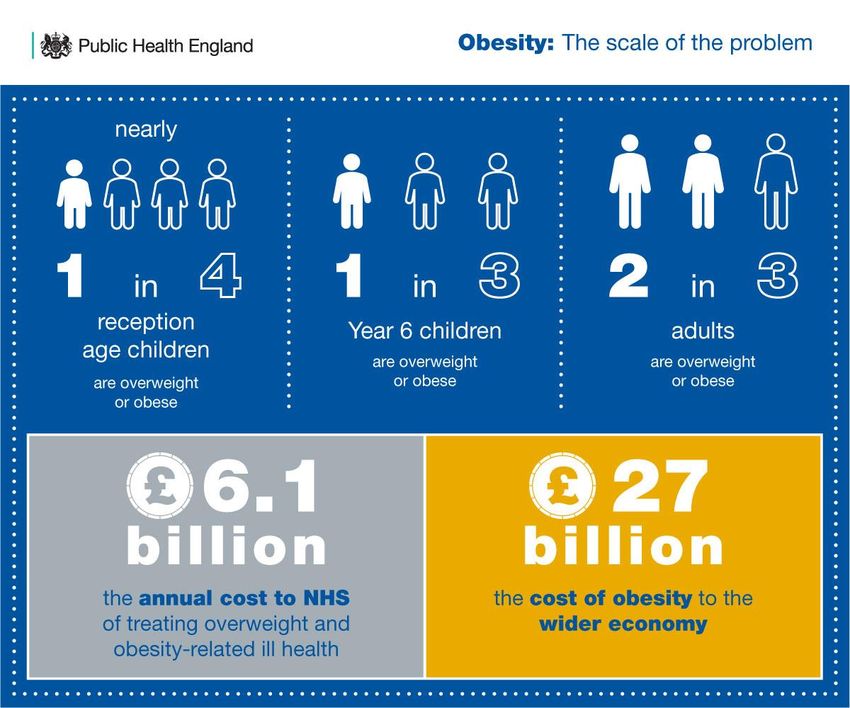
Child overweight and obesity

 2   Tazeem Bhatia - Sugar Reduction.
UK diet compared with recommendations
         Nutrient                                               Children                 Teenagers                      Adults
     (% food energy)                       Target               4-10 yrs                  11-18 yrs                    19-64 yrs
Total fat                                    ≤35%                     33.4                       33.6                        34.2

                    Saturated fat            ≤11%                     13.3                       12.6                        12.7
                         Trans fat            ≤2%                      0.5                        0.5                         0.5
Total carbohydrate                           ≥50%                     51.7                       51.2                        48.5
         Sugars (free sugars)                 ≤5%               13.4 (NMES)                15.2 (NMES)                 12.3 (NMES)
      Fibre (AOAC) (g/day) *                               ≈ 14
                                         ≥15-20g                                                ≈ 16
                                                    (Est. from NSP)                                                        ≈ 18
                                       ≥25-30g ≥30g                                      (Est. from NSP)
                                                                                                                    (Est. from NSP)
Salt (g/day)
                                             ≤3-5g                     4.6
                                              ≤6g                                                 6.6                          8

      ≥ = more than or equal to; ≤ = less than or equal to
      Non milk extrinsic sugars including added sugars and sugars released from cell structures eg. fruit juice
      • AOAC equivalent estimated from NSP
      Sources: National Diet and Nutrition Survey (NDNS) years 5 & 6 (2012/13-2013/14)
      Salt intakes: adults: NDNS: salt intakes in adults 19-64 years in England 2014; children: NDNS: years 1-4 (2008/09-2011/12)

 3     Tazeem Bhatia - Sugar Reduction.
Trends in Children’s Sugar Intake
Sugar intake in children and young people
18
16
14
NMES % Food Energy
12
10 * sig diff
8
6
4
2
Recommendation
0
1.5 - 3 years 4 -10 years 11 - 18 years
Age group
Years 1-2 (2008/09 -2009/10) Years 3-4 (2010/11 - 2011/12) Years 5-6 (2012/13 - 2013/14)
Sugar intakes are for non milk extrinsic sugars including added sugars and sugars released from cell structure e.g. fruit juice. These
figures will be similar to free sugars.
Source: National Diet and Nutrition Survey (NDNS) years 5 & 6 (2012/13-
2013/14)
4 Tazeem Bhatia - Sugar Reduction.Which products?
Contributors to sugar intake in the UK (children aged 4-18 years)
other* breakfast cereals
yoghurt, fromage frais, ice cream
and other dairy desserts biscuits, buns, cakes,
pastries and puddings
table sugar
preserves and sweet
soft drinks spreads
sugar and chocolate
confectionery
fruit juice
This programme is about foods consumed by all children under 18 years including the very young- it encompasses
family foods and those foods specifically marketed at these age groups
5 Tazeem Bhatia - Sugar Reduction.Scientific Advisory Committee on Nutrition’s
Carbohydrate and Health report
Published July 2015
Key findings:
• Sugar consumption increases energy intake
• Sugar consumption is associated with increased risk of
tooth decay
• Sugar sweetened beverages associated with increased risk
of type 2 diabetes and linked to higher BMI
Recommendations:
• A definition for ‘free sugars’ should be adopted in the UK.
• The Dietary Reference Value for free sugars should be set
at a population average of around 5% dietary energy for
age groups from 2 years upwards.
https://www.gov.uk/government/
• Consumption of sugar-sweetened beverages, by children publications/sacn-
and adults, should be minimised. carbohydrates-and-health-report
6 Tazeem Bhatia - Sugar Reduction.Sugar Reduction: The evidence for
action (October 2015)
It is unlikely that a single action alone would
be effective in reducing sugar intakes
• The evidence suggests a broad, structured
approach, involving restrictions on price promotions
and marketing, product reformulation, portion size
reduction and price increase on unhealthy products,
implemented in parallel, is likely to have a more
universal effect.
• Positive changes to the food environment (e.g.
public sector food procurement, provision and sales
of healthier foods) as well as information and
education are also needed to help support people in
making healthier choices. https://www.gov.uk/government/publications
/sugar-reduction-from-evidence-into-action
7 Tazeem Bhatia - Sugar Reduction.Soft drinks industry levy (SDIL) – HM Treasury lead Announced March 2016 • Finance Bill received Royal Assent in April 2017, came in to law April 2018 • Applies to manufacturers and importers of added sugar soft drinks and across the whole of the UK • Two rates based on total sugar content which created an incentive for businesses to reformulate: - 18p per litre for the lower sugar products (5g/100ml and above) - 24p per litre for the higher sugar products (8g/100ml and above) • Juices and milk-based drinks are exempt from the levy so become part of PHE’s wider reformulation programme (guidelines published May 2018) • The exemption for milk drinks will be reviewed in 2020, taking into account the progress made through voluntary reformulation • Revenue to be used to support schools including funding for programmes that promote physical activity and balanced diets in school-age children. • PHE is including all drinks in its sugar reduction monitoring programme, as requested by HM Treasury 8 Tazeem Bhatia - Sugar Reduction.
HM Government Childhood Obesity
A Plan for Action
Published August 2016
PHE-led deliverables include
Taking out 20% of sugar in products, achieving
salt targets (calories from 2017, & saturated fat
considered post SACN)
Supporting early years settings
Supporting primary schools to delivery 30 mins
of physical activity daily
Building the knowledge & competencies of the
wider public health workforce to address
childhood obesity with children & their families
                                                    https://www.gov.uk/government/publications/child
Harnessing the best new technology                  hood-obesity-a-plan-for-action

  99 Tazeem
         Tazeem
            Bhatia – Sugar
                 Bhatia - Sugar
                            reduction
                                Reduction.
Food industry and NGO’s engagement
November /
December
2016
September
2016 Early 2017
May / June PHE category December
2016 specific 2016 to
PHE March 2017 Three sector
meetings
stakeholder meetings (retail,
(manufacturers,
40 individual briefing on manufacturers
retailers, Individual
meetings sugar reduction and eating out of
businesses meetings
(manufacturers, programme home*, trade
from the eating with a wide
major retailers (~100 bodies, NGOs
out of home range of
and trade businesses and devolved
sector, NGOs, businesses
bodies and across all food administrations)
other key to discuss
NGOs) industry sectors, to discuss data /
government proposals
trade bodies metrics
departments
and NGOs)
and the
devolved
administrations)
*An additional programme of
engagement with the eating out of
home sector has been undertaken.
10 Tazeem Bhatia - Sugar Reduction.Sugar reduction and reformulation programme
• Overall ambition is for all sectors of industry
to reduce sugar by 20% by 2020 (5%
reduction in year 1 by August 2017) in
products that contribute most to intakes of
children up to 18 years old
• In March 2017 PHE published guidelines for
the total sugar levels per 100g and calorie
content of products likely to be consumed in
a single occasion.
https://www.gov.uk/government/publications
/sugar-reduction-achieving-the-20
11 Tazeem Bhatia - Sugar Reduction.Guidelines for industry: principles
Overall target is to reduce sugar by 20% by 2020 (5% reduction in year 1)
through :
A voluntary programme of work giving businesses three methods to reduce the
sugar in their products:
1. product reformulation to lower sugar levels present per 100g/ml
2. reduction in the portion size of, and/or the number of calories in, products that
are likely to be consumed by an individual at one time. This means less sugar
as well as calories and/or fat
3. a shift in consumer purchasing towards lower/no added sugar products
• The reductions should be accompanied by reductions in calories, where
possible, and should not be compensated for by increases in saturated fat.
• Work to achieve the 2017 salt targets should continue alongside the sugar
reduction programme
12 Tazeem Bhatia - Sugar Reduction.Taking out 20% of sugar in products
• It applies to all sectors of the food industry i.e. supermarkets, manufacturers and
eating out of home sector eg restaurants, cafes, fast food outlets/takeaways
• Category specific sales weighted average targets/100g of product were set for
achievement by 2020
• In addition calorie or portion size caps were set for single serve products
• The programme focuses predominantly on reducing the levels of total sugars as
they are declared on the nutrition panel of food labels
• The guidelines have been developed for the top 9 broad food categories
contributing to children’s (aged up to 18 years) sugar intake:
Breakfast cereals Puddings
Yogurt and fromage frais Ice cream, lollies and sorbets
Biscuits Chocolate confectionery
Cakes Sweet confectionery
Morning goods (buns, pastries etc) Sweet spreads and sauces (chocolate spread,
peanut butter, dessert toppings/sauces & fruit spreads)
13 Tazeem Bhatia - Sugar Reduction.Sugar reduction and calorie or portion size
guidelines
Category description Baseline 5% reduction 20% Portion guideline – Mechanism of most relevance to
sales guideline reduction kcals per serve category
weighted (g sugar per guideline (per portion of a
average for 100g) (g sugar per product likely to be Reformulation Portion Shift
total sugar 100g) consumed by an size portfolio
(g sugar per individual at one time)a of sales
100g)
Breakfast cereals: Includes all breakfast cereals, eg 15.3g 14.6g 12.3g 400 kcals (maximum) √ √
ready to eat cereals, granola, muesli, porridge oats.b
Yogurts: Includes all sweetened dairy yogurt, fromage 12.8g 12.3g 11.0g 120kcal 175kcal √ √ √
frais products including non-dairy alternatives (such as sales maximum
soya, goat, sheep products): Excludes natural yogurt and weighted
unsweetened yogurt and fromage frais.c average
Biscuits: Includes all types of sweet biscuits including 32.8g 31.2g 26.2g 100kcal 325kcal √ √ √
cereal bars and toaster pastries (Pop Tarts); gluten free sales maximum
biscuits; two-finger Kit Kats (but all other sizes are weighted
excluded) average
Cakes: Includes all types of cakes, ambient and chilled, 34.9g 33.1g 27.9g 220kcal 325kcal √ √
including cake bars and slices, American muffins, sales maximum
flapjacks, Swiss rolls. weighted
average
Morning goods: Includes morning goods such as 12.5g 11.9g 10.0g 220kcal 325kcal √ √
croissants, crumpets, English muffins, pancakes, buns, sales maximum
teacakes, scones, waffles, Danish pastries, fruit loaves, weighted
bagels. average
Puddings: Includes all types of ambient (including 18.8g 17.9g 15.1g 220kcal 450kcal max √ √
canned), chilled and frozen puddings. sales 550kcal max
weighted for OOH with
average additionsd
14 Tazeem Bhatia - Sugar Reduction.Sugar reduction and calorie or portion size guidelines continued
Category description Baseline 5% reduction 20% Portion guideline – kcals per Mechanism of most relevance to
sales guideline reduction serve category
weighted (g sugar per guideline (per portion of a product likely Reformulation Portion Shift
average for 100g) (g sugar to be consumed by an size portfolio of
total sugar per 100g) individual at one time)a sales
(g sugar per
100g)
Ice cream, lollies and sorbets: Includes all types of 23.2g 22.1g 18.6g 220kcal sales 325kcal √ √
ice cream, dairy and non-dairy, choc ices, ice cream (13.7g) (12.8g) (10.8g) weighted maximum
desserts eg Arctic roll, lollies and sorbets. average
Average conversion factors have been applied to ice
cream products to convert volumes sales in litres to
kilograms, and nutrition information provided per
100ml to per 100g. Sugar content in g per 100ml is
provided in brackets.
Chocolate confectionery: Includes chocolate bars, 54.6g 51.9g 43.7g 200kcal sales 250kcal max √
filled bars, assortments, carob, diabetic, low calorie weighted
and seasonal chocolate. average
Sweet confectionery: Includes all sweets. Excludes 60.6g 57.5g 48.4g 125kcal sales 150kcal max √
sugar free sweets and chewing gum. weighted
average
Sweet spreads and sauces: Includes chocolate Portion
spread, peanut butter, ice cream and dessert size guideline
sauces/toppings and compotes, jam type spreads (grams per portion of a product
that are out of scope of the legislation. likely to be consumed by an
individual at one time)
Chocolate spread: Includes chocolate hazelnut 54.8g 52.0g 43.8g 15g sales weighted average √
spreads, milk chocolate spreads, confectionery
branded chocolate spreads.
Peanut butter: Includes peanut butter with added 4.9g 4.7g 3.9g 15g sales weighted average √
and no added sugar and flavoured peanut butter
(including chocolate where peanuts are the main
ingredient) as well as all other nut butters (eg
almond, cashew).
Dessert toppings/sauces: Includes dessert syrups 48.3g 45.9g 38.7g 15g sales weighted average √
with added sugar, coulis, compotes, cream based
toppings, brandy sauce.
Fruit spreads: Includes fruit-based spreads that do 43.2g 41.1g 34.6g 15g sales weighted average √
not fall under the EU jam definition and legislation.
15 Tazeem Bhatia - Sugar Reduction.Sugar progress report – Spring 2018
• PHE has now published (May 22nd) a detailed
assessment of progress towards the 5% reduction
expected in the first year of the programme
• Report looks at progress across categories, by
businesses and in top selling products based on
analysis of data for the year ending August/September
2017 compared to the baseline year of 2015.
• There is also an assessment of changes in sugar
levels in drinks covered by the soft drinks industry
levy (SDIL) during the same period.
• Data used comes from commercial datasets:
• Kantar Worldpanel for retailers and manufacturers
including volume sales and nutrition data
• MCA for food and drink purchased and consumed
https://www.gov.uk/government/publications
outside of the home for volume sales; nutrition data /sugar-reduction-report-on-first-year-
has been collected from information given online, progress
on menus and some data supplied by businesses
8 Tazeem
. Bhatia – Sugar reduction.Data limitations
• Data used for analysis is based on “shopping basket” data i.e. what people buy.
The datasets used may therefore not yet reflect all the sugar reduction and
product reformulation activity in progress or that has taken place to date
• PHE changed the out of home sector data supplier to one that could deliver a
more comprehensive dataset for future monitoring. This means it is not yet
possible to measure progress for this sector
• Coverage of discount retailers has been improved between baseline and year
1. In particular, Aldi and Lidl are now included but were not included in the
baseline so it has not been possible to report on progress for these two retailers
• There are complexities around the data for SDIL products purchased through
businesses in the out of home sector so this is also not presented in this report
• It is the intention that the above limitations will be addressed and included in the
report due in 2019.
17 Tazeem Bhatia - Sugar Reduction.Sugar reduction headline results
• Reductions in sugar levels in 5 out of the 8 food categories where progress
measured.
• 2% reduction in total sugar per 100g for retailers own brand and manufacturer
branded products
• Reductions in the calorie content of products likely to be consumed in a single
occasion in 4 out of the 6 categories
• 2% reduction in calories in products likely to be consumed in a single occasion for
retailers own brand and manufacturer branded products
• For out of home, the average sugar content is generally the same and calories in
products to be consumed in a single occasion are substantially larger.
• Due to data limitations, it has not been possible to report on progress by the out
of home sector in the same way as for retailers and manufacturers.
• It is recognised that reformulated products take time to appear in cafes,
restaurants, stores and in shopping baskets and that there are limitations in the
data used to make the assessment.
• A clearer indication of progress across the whole industry will be available in
2019.
18 Tazeem Bhatia - Sugar Reduction.Results for retailers own label and manufacturers
Across eight of the ten food categories (excluding cakes and morning goods), retailers and
manufacturers have achieved a 2% reduction in total sugar and a 2% reduction in calories in
products consumed on a single occasion.
Calories
Sugar per 100g in products consumed
Product Category
(% change) on a single occasion
(% change)
Biscuits 0% -3%
Breakfast cereals -5% n/a*
Chocolate confectionery 0% -3%
Ice cream, lollies and sorbets (g) -2% -7%
Puddings 1% 4%
Sweet spreads and sauces -5% n/a*
Sweet confectionery -1% 0%
Yogurts and fromage frais -6% -6%
*n/a = not available as products generally not sold in single serve portions
19 Tazeem Bhatia - Sugar Reduction.Results for retailers and manufacturers
Analysis of retailers own brand and manufacturer branded products also shows
that:
Of the top 20 brands, ranked by total sugar sales in year 1 (does not add up to
100 due to rounding):
o 33% showed a decrease in the sugar content
o 56% showed no change in the sugar content and
o 12% showed an increase in the sugar content
Out of the top 20 brands which showed a reduction in sugar:
o 37% did not change calorie or saturated fat levels
o 13% showed a decrease in both calories and the saturated fat content
o 6% showed an increase in both calories and the saturated fat content
• Changes in calories and saturated fat which are not in the same direction
have not been included in these calculations which is why the figures given
above do not add up to 100.
20 Tazeem Bhatia - Sugar Reduction.Sales weighted average total sugar levels (g/100g)
for manufacturers and retailers compared to the out
of home sector
40
35
30
25
g /100g
20
15
10
5
0
Biscuits Breakfast cereals Ice cream Puddings Yogurts Cakes Morning goods All categories*
Manufacturers & retailers Out of home
*For manufacturers and retailers this excludes cakes, morning goods and breakfast cereals but
includes confectionery. For out of home, cakes, morning goods and breakfast cereals are
included but confectionery is excluded.
21 Tazeem Bhatia - Sugar Reduction.Sales weighted average calories in products
consumed on a single occasion for manufacturers
and retailers compared to the out of home sector
500
450
400
350
Calories per portion
300
250
200
150
100
50
0
Biscuits Ice cream Puddings Yogurts Cakes Morning goods All categories*
Manufacturers & retailers Out of home
*For manufacturers and retailers this excludes cakes, morning goods and breakfast cereals but
includes confectionery. For out of home, cakes, morning goods and breakfast cereals are
included but confectionery is excluded.
22 Tazeem Bhatia - Sugar Reduction.Soft drinks industry levy (SDIL)
Distribution of total sales volume of levy soft drinks (total sugar g per 100ml)
in 2015 and 2017 for retailer own brand and manufacturer branded drinks
For the drinks included in the SDIL, for retailers own brand and manufacturer
branded products only, and based on Kantar Worldpanel data:
•Sugar levels per 100ml fell by 11%, and average calories in products consumed on
a single occasion also fell by 6%, between 2015 and 2017
•There was a shift in volume sales towards products with sugar levels below 5g per
100ml (these are not subject to the levy)
Tazeem Bhatia - Sugar Reduction.
23Childhood obesity: A plan for action, chapter 2
Published in June 2018 Sugar reduction
- Consider extending the SDIL to milk-based drinks
if they fail to reduce sugar by 2020.
- Consider further use of tax system if sugar
reduction does not achieve the desired progress
- Consult on introducing a ban to end the sale of
Labelling energy drinks to children
Local communities
- Mandate calorie labelling on the - Develop a trialblazer programme
out of home sector (including with LAs to ensure those that want
online food delivery) to take action have the knowledge,
- Explore what additional Our national support and leadership to do so.
opportunities leaving the EU - Strengthening Government Buying
presents for food labelling ambition is to halve Standards for Food and Catering
childhood obesity Services
and significantly
reduce the gap in
obesity between Schools
Retail - Review how the least active children are
- Intend to ban price promotions of children from the being engaged in physical activity in
HFSS food and drink, such as buy schools to ensure that our investment
one get one free and multi-buy offers most and least helps all children lead active lives
or unlimited refills of sugary drinks.
- Intend to ban the promotion of HFSS deprived areas by - A national ambition for every primary school
to adopt an active mile initiative, such as
food and drink by location (at
checkouts, end of aisles and store
2030. The Daily Mile.
- Introduce secondary legislation to update
entrance) the standards for school food and take
Marketing steps to ensure compliance
https://www.gov.uk/government/pu - Consult on introducing a 9pm - Consult on use of healthy start vouchers
blications/childhood-obesity-a-plan- watershed for advertising HFSS to provide additional support for low income
for-action-chapter-2 products in broadcast media with families
similar action in the online space
24 Tazeem Bhatia - Sugar Reduction.Challenges encountered and going forward • Data, particularly for the eating out of home sector and some categories for supermarkets and manufacturers (cakes, morning goods, ice cream) • Stakeholder engagement • Amount of time taken and different stages • Engagement of the out of home sector • Publishing information on engagement in order to remain transparent • Technical issues with making reductions • Running a reduction and reformulation programme for sugar, calories, salt and baby foods at the same time, both from a PHE point of view and for businesses • Leaving the EU • Changing consumer demands • Value for money • Competition 25 Tazeem Bhatia - Sugar Reduction.
Stakeholder engagement – incentives for
participation
• Reporting mechanisms – individual products and businesses
• Intention to identify and name those not having taken much action
• Consideration of additional levers (second Childhood Obesity Plan,
  June 2018):
          “Consider further use of tax system if sugar reduction
          does not achieve the desired progress”
• Action by other stakeholders
• Continuation of work already done
• Internal business decisions on Corporate Social Responsibility

26   Tazeem Bhatia - Sugar Reduction.
What could industry leadership look like? • Meet PHE guidance on sugar and salt reduction ambitions • Commit to the calorie reduction programme • Support PHE data requests • Calorie labelling to be consistent, visible, clear • Reformulate the standard product to become the healthier option as the default • Encourage other businesses to show leadership • Trade bodies galvanising members 27 Tazeem Bhatia - Sugar Reduction.
Next steps for the reformulation programme
PHE will discuss and engage extensively with stakeholders on all these areas:
•    Working towards the year two sugar reduction progress report – planning
     to publish towards end summer 2019
•    Working towards calorie reduction guidelines
•    Following publication of the report detailing progress towards the 2017
     salt targets we are now considering the next steps for the salt reduction
     programme
•    Following a programme of initial discussions with stakeholders we are now
     considering the scope and ambition for action on product ranges targeted
     explicitly at babies and young children
•    The next phase of engagement with specific parts of the out of home
     sector is underway to move forward participation in the reformulation
     programmes

28    Tazeem Bhatia - Sugar Reduction.
Tazeem Bhatia Public Health England June 2019
You can also read