Zur Lage der Weltwirtschaft - VDF/BVDF Jahrestagung 2016 | Hamburg, 29. April 2016 - Stefan Kooths
←
→
Page content transcription
If your browser does not render page correctly, please read the page content below

VDF/BVDF Jahrestagung 2016 | Hamburg, 29. April 2016

Zur Lage der Weltwirtschaft

 Prof. Dr. Stefan Kooths
 Institut für Weltwirtschaft an der Universität Kiel, Prognosezentrum
Agenda
Weltwirtschaft
» Entgleiste Geldpolitik (I)
» Rohstoffpreisverfall
» Schwellenländerschwäche
Europäische Union/Euroraum
» Entgleiste Geldpolitik (II)
» Quo-vadis European Governance?
Deutschland
» Gefahr der konjunkturellen Überhitzung/Blasenbildung
» Politik der Gegenwartsgeschenke (Infrastrukturerosion)
» Trügerisches demografisches Zwischenhoch
» Flüchtlingsmigration und Arbeitsmarktregulierung
2 | KOOTHS: Zur Lage der Weltwirtschaft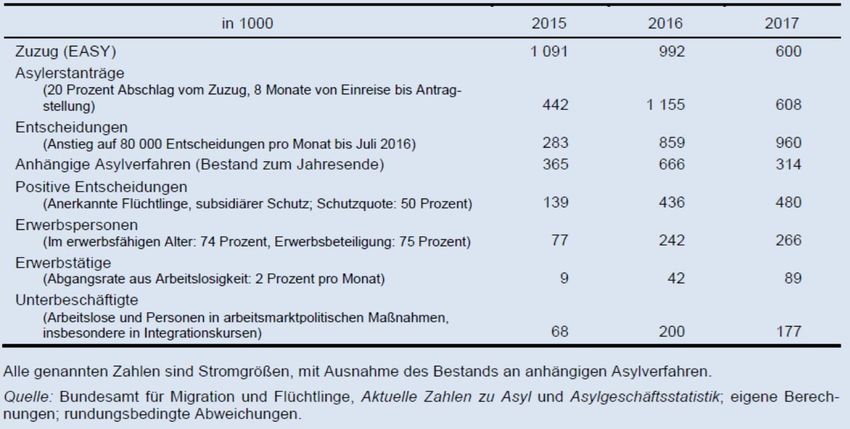
Agenda
Weltwirtschaft
» Entgleiste Geldpolitik (I)
» Rohstoffpreisverfall
» Schwellenländerschwäche
Europäische Union/Euroraum
» Entgleiste Geldpolitik (II)
» Quo-vadis European Governance?
Deutschland
» Gefahr der konjunkturellen Überhitzung/Blasenbildung
» Politik der Gegenwartsgeschenke (Infrastrukturerosion)
» Trügerisches demografisches Zwischenhoch
» Flüchtlingsmigration und Arbeitsmarktregulierung
3 | KOOTHS: Zur Lage der Weltwirtschaft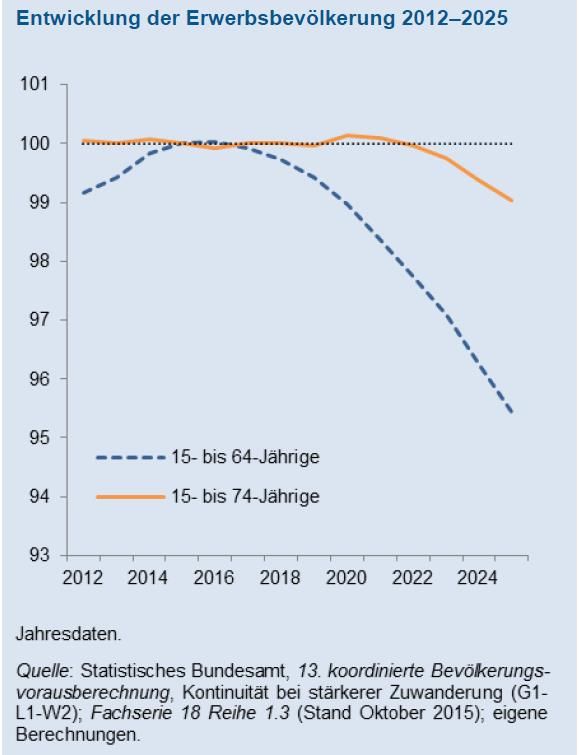
Global economic activity and business climate

   World Economic Activity                                                     Business expectations by groups of countries
                    World output                     IfW-Indicator                  World             Advanced economies                Emerging economies

        Percent                                                  Index              Index
    2                                                                     2     2

                                                                          1     1

    1

                                                                          0     0

    0                                                                     -1   -1

                                                                          -2   -2

   -1

                                                                          -3   -3

   -2                                                                     -4   -4
     1997      2000      2003      2006      2009      2012      2015            1997       2000        2003       2006        2009       2012        2015

                                        Quarterly data, seasonally adjusted.
                                                                                                                                Monthly data, seasonally adjusted.
            IfW-Indicator: based on business expectations in 42 economies.              Based on business expectations in 34 (8) advanced (emerging) economies.
                        GDP: price adjusted, change over previous quarter.

4 | KOOTHS: Zur Lage der Weltwirtschaft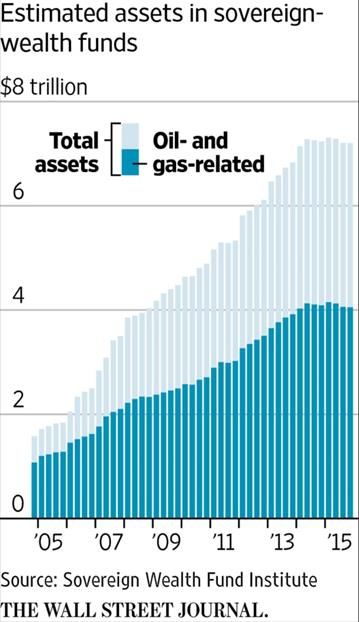
Typical post-crisis patterns (the not so new “new normal”)
Recovery following an ordinary recession and a severe crisis
Growth path Ordinary recession Severe crisis
„Ordinary“ recessions
120
Index » Induced by preceding booms
» Correction of mismatches
115
» Boom-bust cycles are costly
110
105
Severe crises
» Heavily distorted capital
100
stock/production structures
(obsolete capacities)
95
» Flipside: Financial crisis
90
Quarter
(over-indebtedness) following
0 1 2 3 4 5
excessive credit expansion in
Annual data, volume; GDP as index (year0=100); recovery following a
decline of GDP of 5 percent in year 1; according to Boysen-Hogrefe et al.
(forthcoming)
preceding boom
5 | KOOTHS: Zur Lage der WeltwirtschaftWeltproduktion und Welthandel 2014-2020 6 | KOOTHS: Zur Lage der Weltwirtschaft
TurmOil: Three (interwoven) troublemakers
Commodity prices
Slump in raw material HWWI-Index ex energy Brent oil (rhs)
prices 300
2010=100 US-$
140
» Global income redirection 120
250
2.6 percent (2015)
100
0.8 percent (2016) 200
80
150
(Other) structural problems 60
in emerging economies 100
40
50
20
Derailed monetary policy in 0 0
2000 2002 2004 2006 2008 2010 2012 2014 2016
the Western world
Monthly data.
Commodities prices without energy: HWWA-index based on US-Dollar.
7 | KOOTHS: Zur Lage der WeltwirtschaftGlobal oil market and implications for net oil exporters
GDP of the 15 biggest Net-Oil Exporters and Oil price Global oil market
GDP Oil price Inventory change (rhs) Oil consumption Oil production
Percent Percent Mn. Mn.
10 80 98 5
4
8 60 96
3
94
6 40 2
92
1
4 20
90 0
2 0
-1
88
0 -20 -2
86
-3
-2 -40 84
-4
-4 -60 82 -5
1991 1995 1999 2003 2007 2011 2015 2008 2009 2010 2011 2012 2013 2014 2015 2016
Yearly data; percentage change; Oil price: Brent in US-Dollar; Quarterly data; barrel per day.
GDP: percentage change weigthed by nominal GDP in US-Dollar.
8 | KOOTHS: Zur Lage der WeltwirtschaftSlumping Western stock markets (1/2)
Stock prices
Eurostoxx 50 Nikkei 225 S&P 500
Recent peak-to-trough
150 Index (2006=100 )
» US: - 13 percent
140 » JP: - 23 percent
130 » EU: -27 percent
120
110
100
90
80
70
60
50
40
Weekly data; last Value: March 03, 2016.
9 | KOOTHS: Zur Lage der WeltwirtschaftSlumping Western stock markets (2/2)
Sovereign wealth funds:
Not so wealthy anymore
» Approx. 5 percent of all stocks
» Estimated/expected net sales
USD 200 bn (2015)
USD 400 bn (2016)
Low interest rate environment:
Feeding market volatility
» Sensitive discount factors (DF)
» 50 bp increase
DF(5%) = 20 DF(5.5%) = 18.2
DF(1%) = 100 DF(1.5%) = 66.7
10 | KOOTHS: Zur Lage der WeltwirtschaftGlobal QE
Data source: Thomson Reuters Datastream, IfW calculations
Monetary Base Nominal effective exchange rates
Fed BoE BoJ ECB USD GBP JPY EUR CNY
Index (2005=100)
1000 160 Index (2005=100)
900 150
800 140
700 130
600 120
500 110
400 100
300 90
200 80
100 70
0 60
2005 2007 2009 2011 2013 2015 2017
Quarterly data. Monthly data.
11 | KOOTHS: Zur Lage der WeltwirtschaftMoney matters
More money cannot cure what too much money created.
(Patrick Barron)
Capital gives money the time to cause trouble.
(Roger Garrison)
We are destined to spend decades
paying for the easy money orgy of a few years.
(Ludwig von Mises)
12 | KOOTHS: Zur Lage der WeltwirtschaftMonetary Policy: Overloaded
Source: FAZ, 26 October 2011, p. 11
13 | KOOTHS: Zur Lage der WeltwirtschaftStimulus policies: Riding a dead horse?
Fiscal policy record high public debt levels
Monetary policy zero interest rates
» Private sector over-indebtedness, but: more money = more debt
» Rational uncertainty
Negative interest rates, central bank money explosion
CBs fight for inflation (and weaker currencies?)
Debate on helicopter money, ban on cash, …
Investors realize that they are not operating in normal times
Capital stock crisis
» Severe distortion of price and production structures
» The problem is in the composition, not in the levels of aggregates
Crisis of interventionism/short-termism
14 | KOOTHS: Zur Lage der WeltwirtschaftThree options of coping with debt-crises
Public bail-outs
» Shifts private debt to public sector
» Private debt crisis sovereign debt crisis Anti-capitalist
approach
» No solution for fiscally distressed countries (harms principle of
Inflating the debt away accountability,
creates moral
» Takes a long time, promotes zombification hazard risks)
» Puts the currency at risk
» Not targeted towards non-performing loans
Liquidation
Capitalist
» Tough (cold turkey) in the short-run … approach
» … but targeted (and root cause oriented) (in line with free
» Puts capital at second (now first) best use market principles)
15 | KOOTHS: Zur Lage der WeltwirtschaftSome thoughts on the cashless society
Focus
» Supervision of transactions (crime control)
» Room for negative interest rate polices (secular stagnation thesis)
So far: Cash (banknotes) as exclusive legal tender
Ersatz
» Declaring commercial bank money as legal tender
Ultimate privilege, totally at odds with a market economy
» Central banks offers electronic high powered money to anyone
Dramatic pull effect, transition to 100-percent-money
Chicago plan 2.0 (one-off anti-market socialization of risks)
Eliminating elastic credit creation
Last way out of current monetary systemic dead-end?
(private money emission to safeguard monetary discipline)
16 | KOOTHS: Zur Lage der WeltwirtschaftAgenda
Weltwirtschaft
» Entgleiste Geldpolitik (I)
» Rohstoffpreisverfall
» Schwellenländerschwäche
Europäische Union/Euroraum
» Entgleiste Geldpolitik (II)
» Quo-vadis European Governance?
Deutschland
» Gefahr der konjunkturellen Überhitzung/Blasenbildung
» Politik der Gegenwartsgeschenke (Infrastrukturerosion)
» Trügerisches demografisches Zwischenhoch
» Flüchtlingsmigration und Arbeitsmarktregulierung
17 | KOOTHS: Zur Lage der WeltwirtschaftEuro area: Debt overhang hampering credit channel
Data source: Bank for International Settlements, World Bank
Gross Private Sector Debt Non-Performing Loans
Protugal Italy Spain Greece Ireland Portugal Italy Spain Greece Ireland
Percent
Percent 40
350
35 34,4
300
30
250
25
200
20
18,9
17,3
150
15
12,3
100 10
7,0
50 5
0
0 2000 2002 2004 2006 2008 2010 2012 2014
2000 2002 2004 2006 2008 2010 2012 2014
Annual Data. In relation to nominal GDP. Annual data. Share of total loans.
18 | KOOTHS: Zur Lage der WeltwirtschaftEuro area: Monetary financing of governments
Data source: Eurostat, European Commission
Gross Government Debt Government Bond Yields (10-year)
Germany France Italy Spain EMU Germany France Italy Spain EMU
Percent 8 Percent
140
7
120
6
100
5
80
4
60 3
40 2
1
20
0
0
2005 2007 2009 2011 2013 2015 2005 06 07 08 09 10 11 12 13 14 15 16
Annual Data. In relation to nominal GDP; EMU: Average. Monthly data. EMU: Averrage.
19 | KOOTHS: Zur Lage der WeltwirtschaftTarget-2 imbalances:
Intra-euro area liquidity and capital flight are back
TARGET balances
Bank Recovery and billion euro
1200
Resolution Directive (BRRD) 1000
FIN
» Passed in March 2014 800
NED
LUX
» Bail-in elements 600
Liquidity flight 400 GER
200
Greek crisis 2015 0 AUT
BEL
» Capital flow and cash controls -200 ESP
-400 ITA
» ELA
-600 GRE
Liquidity and capital flight -800
POR
IRE
FRA
QE-programs -1000
» Starting in March 2015 -1200
20 20 20 20 20 20 20 20 20
08 09 10 11 12 13 14 15 16
» 60 (now 80) bn Euro/month
Monthly data. Sorce: ECB.
Capital flight
20 | KOOTHS: Zur Lage der WeltwirtschaftQE-related policy risks
Inflation targeting and policy communication
» (Necessarily) disappointing expectations
» Central bank reputation (overall monetary policy approach)
Central bank independence and monetary financing
» Pending loss risks on Eurosystem‘s balance sheets
» Eurosystem becomes largest single creditor of European governments
Systemic financial risks and misallocation of resources
» Asset price bubbles and systemic financial instability
» Misallocation of resources and zombification
Disincentives for governments
» Structural reform policies
» Fiscal consolidation
Distortions in foreign exchange markets (“currency wars”)
21 | KOOTHS: Zur Lage der WeltwirtschaftKrise als Beschleuniger der europäischen Integration?
Maastricht-Vertrag (Februar 1992)
Stabilitäts- und Wachstumspakt (Juli 1997), Reform (März 2005)
Wachstumsstrategie „Europa 2020“ (Juni 2010)
EFSF (Juni 2010)
Europäisches Semester (September 2010)
Euro-Plus-Pakt (März 2011)
Six-Pack (Dezember 2011) MIP
Fiskalpakt (März 2012)
ESM (Oktober 2012)
Two-Pack (Mai 2013)
22 | KOOTHS: Zur Lage der WeltwirtschaftMakroökonomisches Ungleichgewichteverfahren (MIP)
Fokussierung
» Krisenprävention (vs. Europa 2020)
» Gemeinschaftsinteressen (vs. „gute“ Wirtschaftspolitik)
Spannungsfelder
» Koordinierung vs. Subsidiarität
» Strukturprobleme vs. Makroindikatoren
Konzeptionelle Unschärfe (eklektischer Ansatz)
» Makroökonomischer Ungleichgewichtsbegriff
» Wettbewerbsfähigkeit von Wirtschaftsräumen
Ökonomische Systeme als soziokybernetische Regelkreise
» Binnenmarkt: Pekuniäre „externe“ Effekte als Normalfall
» Instrumenteneinsatz: Primat der Primärwirkung über Nebeneffekte
23 | KOOTHS: Zur Lage der WeltwirtschaftKrisenerklärung und -interpretation
MIP: Reaktion auf europäische Schuldenkrise
Finanzkrisen Kapitalstockverzerrung
» Monetäre Konjunktur- und Krisentheorie
» Zinsniveau, Fristentransformation und Produktionsstruktur
(realwirtschaftliche Verwurzelung einer Finanzkrise)
» Krise als Korrektur nicht-nachhaltiger Forderungspositionen
(Liquidationskrise zur Bereinigung von „Zombie-Strukturen“)
» Neubewertung des marktfähigen Kapitalstocks
Krisendiagnose in EUV 1176/2011
» Unzureichende wirtschaftspolitische Koordination
» Mangelnde ökonomische Konvergenz (Leistungsfähigkeit)
24 | KOOTHS: Zur Lage der WeltwirtschaftOrdnungsökonomisches Spannungsfeld
Subsidiaritätsprinzip gemäß EU-Vertrag
(Wettbewerb und wirtschaftspolitische Selbstverantwortung)
Abwehr von Fehlentwicklungen in einzelnen Mitgliedsländern,
die das Gemeinschaftsinteresse berühren
(Koordinierung und wirtschaftspolitische Überwachung)
Hohe Hürden für die Legitimation von Eingriffen
» Nachweis systemischer externer Effekte erforderlich
» Recht auf „falsche“ nationale Wirtschaftspolitik liegt im
Gemeinschaftsinteresse (Raum für institutionelle Experimente)
25 | KOOTHS: Zur Lage der WeltwirtschaftMakroökonomische Koordinationsdefekte
Ökonomische Diskrepanzen zwischen einzelwirtschaftlichen Plänen
Ungleichgewichte Dynamische Koordinationseffizienz
(Abbau von Angebots- und Nachfrageüberhängen)
Pervasive Koordinationsdefekte
Verfügungsrechte (Ordnungsrahmen)
Makroökonomische Geld (allgemeines Tauschmittel)
Ungleichgewichte Kapital/Zins (intertemporale Koordination)
Arbeit/Lohn (quasi-universeller Produktionsfaktor)
Grenzüberschreitende Koordinationsdefekte
MIP-relevante Geld- und Kreditwesen, Schuldentragfähigkeit
Ungleichgewichte
≠ Konjunkturglättung (Globalsteuerung)
≠ Pekuniäre Wettbewerbseffekte im Binnenmarkt
Dysfunktionale Koordinationsmechanismen Symptomatische Makroentwicklung
26 | KOOTHS: Zur Lage der WeltwirtschaftSystemische externe Effekte und Stabilitätskultur
Finanzsystem: Geld- und Kreditwesen
» Kreditdeckung des Geldes
(simultane Geld- und Kreditschöpfung aus dem Nichts)
» Implizite Gesamthaftung für Kollateral des Eurosystems
» Regulierungsarbitrage
Hartwährungsverbund erfordert Stabilitätskultur
» Variante 1:
Haftungsprinzip, Anreiz zur Vorsicht („No-bail-out“)
» Variante 2:
Überwachung, Hilfen unter Auflagen („No-bank-left-behind“)
Funktionsfähigkeit von Institutionen beruht auf Einsicht und
gemeinsamem Regelverständnis (Ownership)
27 | KOOTHS: Zur Lage der Weltwirtschaft„Nationale Wettbewerbsfähigkeit“
WF kein makroökonomisch bedeutungsvolles Konzept
» Anpassung der Faktorpreise
» Internationaler Handel kein Nullsummenspiel
» Konsummöglichkeiten sind relevant (Volkswirtschaft ≠ Exportsektor)
Leistungsfähigkeit = Produktivität
» Produktivität entscheidet über Einkommen/Terms-of-Trade,
nicht über Vorteilhaftigkeit des Außenhandels
» Funktionsfähiger Binnenmarkt setzt weder hohe, noch konvergierende
Produktivität voraus (sondern hat sie zur Folge)
» Produktivitätsschwäche: Kein Problem der Außenbeziehungen
Politikkoordinierung?
» Best-practice und peer-review
» Keine Interessenkonflikte, Recht auf „schlechte“ Wirtschaftspolitik
28 | KOOTHS: Zur Lage der WeltwirtschaftPrimat des Subsidiaritätsprinzips
Subsidiaritätsprinzip
» Anreizkonstellation
» Informationsstand
» Instrumentenzugriff
» Demokratische Legitimierung
Vertikaler Aufgabenzuschnitt
» Theorie des Fiskalföderalismus (Exkludierbarkeit, Rivalität)
» Genuine europäische Gemeinschaftsgüter statt „politische Projekte“
Subsidiarität macht Europa stark, nicht schwach
29 | KOOTHS: Zur Lage der WeltwirtschaftAgenda
Weltwirtschaft
» Entgleiste Geldpolitik (I)
» Rohstoffpreisverfall
» Schwellenländerschwäche
Europäische Union/Euroraum
» Entgleiste Geldpolitik (II)
» Quo-vadis European Governance?
Deutschland
» Gefahr der konjunkturellen Überhitzung/Blasenbildung
» Politik der Gegenwartsgeschenke (Infrastrukturerosion)
» Trügerisches demografisches Zwischenhoch
» Flüchtlingsmigration und Arbeitsmarktregulierung
30 | KOOTHS: Zur Lage der WeltwirtschaftBruttoinlandsprodukt und Komponenten 2014-2020 31 | KOOTHS: Zur Lage der Weltwirtschaft
Arbeitsmarkt und Preisentwicklung 2014-2020

32 | KOOTHS: Zur Lage der Weltwirtschaft
Drohende Überhitzung (stilisierter Konjunkturzyklus)
Kapazitätsauslastung Kapazitätsauslastung
(Abschwung/Kontraktion) (Aufschwung/Expansion)
Produktion tatsächlich
Erholung
Rezession
Abkühlung
Boom
Überauslastung Unterauslastung
Zeit
33 | KOOTHS: Zur Lage der WeltwirtschaftMittelfristprojektion für Deutschland
Potential und Produktion
Produktionslücke (rechte Skala) Bruttoinlandsprodukt Potenzial
Mrd. Euro Prozent
3200 5
4
3000
3
2800 2
1
2600
0
2400
-1
2200 -2
-3
2000
-4
Projektion
1800 -5
1991 1993 1995 1997 1999 2001 2003 2005 2007 2009 2011 2013 2015 2017 2019
Jahresdaten; Bruttoinlandsprodukt, Potential: preisbereinigt (verkettete Volumenwerte, Referenzjahr 2010).
Quelle: Statistisches Bundesamt, Fachserie 18, Reihe 1.2; Berechnungen und Projektion des IfW.
34 | KOOTHS: Zur Lage der WeltwirtschaftWachstumspotenzial und -faktoren 2001-2020
Produktionspotenzial und Wachstumsfaktoren
Prozent(punkte)
2,0
TFP Kapital Arbeit Potenzial
1,5
1,0
0,5
0,0
Projektion
-0,5
2001 2002 2003 2004 2005 2006 2007 2008 2009 2010 2011 2012 2013 2014 2015 2016 2017 2018 2019 2020
Jahresdaten. Produktionspotenzial: Veränderung gegenüber Vorjahr in Prozent; Faktoren: Wachstumsbeitrag in Prozentpunkten.
Quelle: Statistisches Bundesamt, Fachserie 18, Reihe 1.2; Berechnungen und Projektion des IfW;
35 | KOOTHS: Zur Lage der WeltwirtschaftPotenzielles Arbeitsvolumen 2001-2020
Potenzielles Arbeitsvolumen und Komponenten
Prozent(punkte)
0,8
0,6
0,4
0,2
0,0
-0,2
-0,4
Projektion
-0,6
2001 2002 2003 2004 2005 2006 2007 2008 2009 2010 2011 2012 2013 2014 2015 2016 2017 2018 2019 2020
Erwerbsbevölkerung Parizipation NAIRU Arbeitszeit Arbeitsvolumen
Jahresdaten, Vorjahresveränderung (Arbeitsvolumen) und Wachstumsbeiträge (Komponenten).
Quelle: Statistisches Bundesamt, Fachserie 18, Reihe 1.2; Berechnungen und Projektion des IfW.
36 | KOOTHS: Zur Lage der WeltwirtschaftDemografisches Zwischenhoch bis 2020 37 | KOOTHS: Zur Lage der Weltwirtschaft
IfW-Szenario zur Flüchtlingsmigration

38 | KOOTHS: Zur Lage der Weltwirtschaft
Flüchtlingsmigration: Kein makroökonomischer Gamechanger
Makro-Effekte
» Kurzfristig stimulierend via
Staatsausgaben (25 Mrd. p.a.)
» Potenzialeffekte mit
Verzögerung
Zugang zum Arbeitsmarkt ist
entscheidend
» Mindestlohnhürde
» Qualifizierung „on the job“
39 | KOOTHS: Zur Lage der WeltwirtschaftÖffentliche Infrastruktur 1991-2020
Öffentliche Nichtwohnbauten
Mrd. Euro Mrd. Euro
30 1100
Kapitalstock (rechte Skala) Nettoinvestitionen Projektion
1080
20
1060
10
1040
0 1020
1000
-10
980
-20
960
-30 940
1991 1993 1995 1997 1999 2001 2003 2005 2007 2009 2011 2013 2015 2017 2019
Jahresdaten.
Kapitalstock: Nettoanlagevermögen des Staates, preisbereinigt (Referenzjahr 2010); Nettoinvestitionen: in jeweiligen Preisen.
Quelle: Statistisches Bundesamt, Fachserie 18, Reihe 1.4 und Anlagevermögen nach Sektoren (Arbeitsunterlage); Berechnungen und Projektion des IfW.
40 | KOOTHS: Zur Lage der WeltwirtschaftAusgabenanteile der Gebietskörperschaften 1991-2015
Prozent Prozent
25 25
Differenz Investive Ausgaben Sozialausgaben
20 20
15 15
10 10
5 5
0 0
1991 1993 1995 1997 1999 2001 2003 2005 2007 2009 2011 2013 2015
Jahresdaten, Anteil an den Gesamtausgaben der Gebietskörperschaften.
Investiv: Bruttoinvestitionen und Investitionszuschüsse; Sozial: Monetäre Leistungen und Sachleistungen.
Quelle: Statistisches Bundesamt, Fachserie 18, Reihe 1.4; Berechnungen des IfW.
41 | KOOTHS: Zur Lage der WeltwirtschaftInfrastrukturbereitstellung
Tonnendenken vermeiden (mehr ≠ besser)
Privatisierung und Bereitstellungsagenturen
» Finanzierung über Nutzungsentgelte (Gebühren, Beiträge)
» Investitionssignale via Zahlungsbereitschaft
» Keine Haftungsübernahme durch den Staat
Niedrigzinsen keine Begründung für öffentliche Investitionen
» Massiver Einfluss der Geldpolitik
» Nullzinsen ≠ Nullkosten (Abschreibungen!)
» Verstetigung der Investitionstätigkeit
» Finanzierungslast vs. Finanzierungskonflikt:
„Generationenausgleich“ via Staatsverschuldung läuft ins Leere
42 | KOOTHS: Zur Lage der WeltwirtschaftYou can also read