Tissue Characterization Using Fractal Dimension of High Frequency Ultrasound RF Time Series
←
→
Page content transcription
If your browser does not render page correctly, please read the page content below
Tissue Characterization Using Fractal Dimension
 of High Frequency Ultrasound RF Time Series

           Mehdi Moradi1 , Parvin Mousavi1, and Purang Abolmaesumi1,2
              1
               School of Computing, Queen’s University, Kingston, Canada
      2
          Department of Electrical and Computer Engineering, Queen’s University
                      {moradi,pmousavi,purang}@cs.queensu.ca

          Abstract. This paper is the first report on the analysis of ultrasound
          RF echo time series acquired using high frequency ultrasound. We show
          that variations in the intensity of one sample of RF echo over time is
          correlated with tissue microstructure. To form the RF time series, a
          high frequency probe and a tissue sample were fixed in position and
          RF signals backscattered from the tissue were continuously recorded.
          The fractal dimension of RF time series was used as a feature for tissue
          classification. Feature values acquired from different areas of one tissue
          type were statistically similar. For animal tissues with different cellular
          microstructure, we successfully used the fractal dimension of RF time
          series to distinguish segments as small as 20 microns with accuracies as
          high as 98%. The results of this study demonstrate that the analysis of
          RF time series is a promising approach for distinguishing tissue types
          with different cellular microstructure.

1    Introduction
Ultrasound-based tissue characterization techniques rely on different scatter-
ing patterns of ultrasound in tissues with dissimilar cellular microstructures.
Although the exact physical mechanisms that govern these patterns are not
well understood [1], microstructure-induced differences in ultrasound-tissue in-
teraction are documented both at clinical (2-10 MHz) frequencies [2] and at
higher frequencies [1,3]. In other words, ultrasound Radio-Frequency (RF) echoes
contain information about tissue characteristics. However, it is challenging to dis-
entangle this information from the variations in the signal caused by the system-
dependent effects, such as mechanical and electrical properties of the transducer
and diffraction effects due to the finite aperture of the transducer. This funda-
mental restriction of ultrasound-based tissue characterization techniques limit
their sensitivity and specificity in diagnosis of cancer lesions [4,5].
   In a new approach to analysis of RF echoes for tissue characterization, we have
recently proposed that if a specific location in tissue undergoes continuous inter-
actions with ultrasound, the time series of the RF echo signals (see Figure 1) from
that location carries “tissue characterizing” information [6,7]. In other words, al-
though variations in the intensity of one sample of RF echo over time are partly
due to the electronic noise of the ultrasound machine or the errors caused during

N. Ayache, S. Ourselin, A. Maeder (Eds.): MICCAI 2007, Part II, LNCS 4792, pp. 900–908, 2007.

c Springer-Verlag Berlin Heidelberg 2007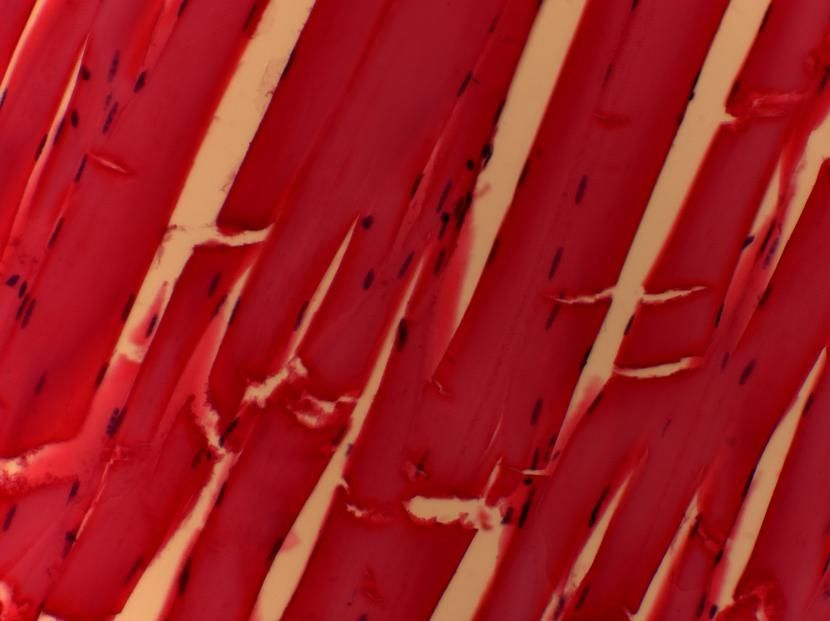
Tissue Characterization Using Fractal Dimension          901

    Fig. 1. RF time series: Sequential echoes received from one location of tissue

the beam-forming process [8], they depend on the tissue type as well. Specifically,
the fractal dimension (FD) of the RF time series was successfully used to detect
cancerous lesions in prostate tissue [7], as well as to distinguish different animal
tissues [6].
   These tissue characteristic variations might be due to the vibrations in the
microstructural level induced by the continuous emission of ultrasound beams.
However, more studies on the origin of this phenomenon are necessary. Specifi-
cally, in the current paper we report the results of our new research that addresses
three fundamental questions about the RF time series: 1) Are the results of tissue
classification based on the RF time series, correlated with the microstructure of
the tissue? In other words, is this approach more successful in separating tissue
types with significantly different microstructures? 2) What is the effect of utiliz-
ing high frequency ultrasound on the outcome of the method? It is a well-known
fact that at very high frequencies the scattering of ultrasound is primarily caused
by the cellular microstructure [1] as opposed to tissue macrostructure. Therefore,
the dependence of the FD of RF time series on cellular microstructure should be
more evident in high frequency data. 3) Are the tissue characterizing properties
of RF time series emphasized in A-mode? Some of the system related alter-
ations in the RF time series acquired in B-mode, including the beam-forming,
are absent in A-mode imaging.
   To answer these questions, we analyzed RF echo time series acquired using
high frequency ultrasound A-mode probes. Based on microscopic studies, we
showed that at these frequencies, the separability of tissues based on FD of RF
time series is closely related to differences in tissue microstructures. We used FD
of the RF times series to successfully distinguish segments as small as 20 microns
of animal tissues of dissimilar microstructures with accuracies as high as 98%.
Furthermore, the FD values calculated from the RF time series of different tissues
showed statistically significant differences, far beyond the variations in FD values
in one tissue type. These experiments suggest the presence of microstructure-
related information in the RF time series. Some of the pathologic conditions,
including cancer, are characterized by a dramatic change in the microstructure
of the affected tissue. Therefore, the proposed tissue characterization approach
could lead to an effective method for diagnosis of certain types of cancer [7].
The rest of this paper is organized as follows: Section 2 introduces the data
902 M. Moradi, P. Mousavi, and P. Abolmaesumi
collection method, feature extraction and classification approaches, Section 3
presents our results and discussions, and Section 4 provides a summary and the
conclusions.
2 Methods
To study the tissue characterizing capabilities of RF echo time series acquired
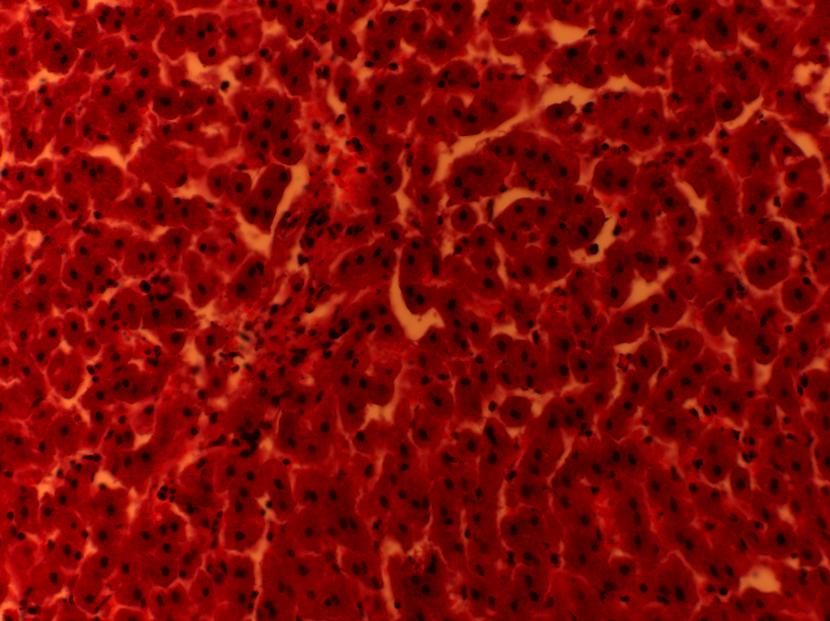
at higher frequencies, we used four different tissue types: bovine liver, pig liver,
bovine muscle, and chicken breast. As illustrated in Figure 2, the cellular struc-
ture of both bovine and pig liver are characterized by hepatocyte cells (of slightly
different shape and density), whereas bovine muscle and chicken breast both have
fibrous structures formed by sarcomeres.
The high frequency ultrasound RF time series in this study were collected
using a Vevo 770 high resolution ultrasound system (VisualSonics Inc., Toronto,
Canada) with RMV706 and RMV711 scanheads (see Table 1 for the specifica-
tions). The depth of scanning was about 1mm which corresponded to 512 signal
samples. While the tissue and the probe were fixed in place, we continually ac-
quired 500 ultrasound A-lines (frame rate: 60 fps) from one spot of the tissue.
In other words, we formed a time series of length 500 from each sample of the
ultrasound A-line. With each probe type, we acquired two separate lines of RF
time series from two different areas of each tissue type.
Table 1. Specifications of the high frequency ultrasound scanheads
Model Broadband frequency Center frequency Axial resolution
RMV711 Up to 82.5 MHz 55 MHz 30 μ
RMV706 Up to 60 MHz 40 MHz 40 μ
2.1 Feature Extraction
In this study, tissue types were characterized by the average of FDs computed
for all the RF time series in a Region of Interest (ROI). Our high frequency data
was acquired in A-mode. Therefore, ROIs were simply segments of RF lines (each
signal sample covered a depth of almost 2 microns).
FD of time series originating from natural processes has been extensively
studied as a parameter that quantifies nonlinear internal dynamics of complex
systems [9,10]. In such systems, the mechanisms of interaction that give rise to
the output time series are not well understood. FD has been shown to have
low sensitivity to the noise-induced variations [11]. In RF time series analysis,
the microstructural information is received along with noise-related variations.
Therefore, we chose FD to characterize the RF time series. We used Higuchi’s al-
gorithm [12] for computation of the FD of time series which can be summarized as
follows: Each sample of the RF data forms a time series {X(1), X(2), ..., X(N )}Tissue Characterization Using Fractal Dimension 903
(a) Bovine liver (b) Pig liver
(c) Chicken breast (d) Bovine muscle
Fig. 2. Images of the cellular structure of tissue types used in this study at 200X mag-
nification (acquired from H&E stained slides with a Zeiss AxioImager M1 microscope)
over sequential ultrasound frames, where N = 500 for our high frequency RF
data. From this time series, we first construct k new time series of form:
N −m
Xkm : {X(m), X(m + k), X(m + 2k)..., X(m + [ ].k)} (1)
k
where k is the sampling time interval (which determines the scale, k < N ) and
m = 1, 2, ..., k − 1. Both m and k are integers. The length of each time series,
Lm (k), is defined as:
[ N −m
N −1 k ]
Lm (k) = 1/k × ( N −m ) × |X(m + ik) − X(m + (i − 1).k)| (2)
[ k ].k i=1
The average value of Lm (k) over k sets, L(k), is the so-called length of the time
series at scale k. This procedure is repeated for each k ranging from 1 to kmax .
A line is fitted to values of ln (L(k)) versus ln (1/k) and the slope of this line is
considered as the FD. The number of the samples, N , and the nature of the time
series determine the optimal value of the parameter kmax . For the current study,
the value of kmax was optimized based on the average classification accuracy
acquired. We examined kmax values between 4 and 56. Feature extraction for
each A-line involved computation of FD of 512 time series of length 500. We call
the output of this process an FD vector.904 M. Moradi, P. Mousavi, and P. Abolmaesumi
2.2 Classification
All classification results reported in the current paper were acquired with a
Bayesian approach. If ω1 and ω2 represent ROIs from two categories of tissue
involved in one of our classification experiments, and x represents the feature
value of a given ROI (which its category is unknown), Bayes’ rule states that
the classification can be performed based on the following inequalities:
P (x|ω1 )P (ω1 ) ≷ P (x|ω2 )P (ω2 ) (3)
P (ω1 ) and P (ω2 ) are a priori probabilities (which can be simply calculated as
the ratio of the number of ROIs in each category to the total number of ROIs in
the two categories). P (x|ω1 ) and P (x|ω2 ) are the probability density functions
(pdf) of feature values in categories 1 and 2 respectively. We fit a Gaussian pdf
to the distribution of the feature in each category.
We followed a leave-10%-out approach to validate the classification procedure.
In other words, we randomly partitioned the data in each category to 10 folds.
We evaluated the pdfs on 90% of the data samples, classified the remaining 10%
based on the evaluated pdfs, and repeated the procedure for all 10 portions of
the data. We repeated the whole leave-10%-out process 200 times (each time
with a random partitioning of the ROIs to 10 folds). The mean accuracies and
standard deviations reported in our results were recorded over these 200 trials.
3 Results and Discussions
FD vectors from the same tissue types: The first step in our analysis was
to perform one-way ANalysis Of VAriance (ANOVA) tests on pairs of FD vec-
tors from the same tissue types. ANOVA is a statistical test in which the null
hypothesis is the equality of means in samples from two different populations.
As Table 2 illustrates, when two FD vectors from the same tissue type were
compared, the p-values in ANOVA tests were relatively large, also the sam-
ples from two lines could not be distinguished (classification accuracies close
to 50%). The ROI size used for classification was 20 microns (10 samples)
and Kmax = 16.
Table 2. Comparison of two FD vectors from two RF lines of one tissue type
Tissue type ANOVA p-value accuracy in separating ROIs from the two lines
RMV711 results on RMV711 - mean (STD)
Bovine liver 0.47 52% (3.7)
Pig liver 0.007 47% (3.9)
chicken breast 0.0001 59% (3.1)
Bovine muscle 0.68 53% (4.3)Tissue Characterization Using Fractal Dimension 905
Table 3. Comparison and classification of data from different tissue types
ANOVA mean (STD) mean (STD) mean(STD)
Tissue types p-value Res: 2μ Res: 20μ Res: 20μ
(RMV711) (RMV711) (RMV711) (RMV706)
Bovine liver - chicken breast 0 81.1% (2.5) 92.2% (5.8) 96.9% (3.5)
Bovine liver - bovine muscle 0 84.1% (2.3) 95.5% (4.0) 93.7% (5.3)
Chicken breast - pig liver 0 84.6% (2.3) 96.0% (4.2) 92.3% (5.3)
Pig liver - bovine muscle 0 89.2% (2.1) 98.2% (3.1) 90.0% (6.4)
Bovine liver - pig liver 0 73.7% (3.0) 83.7% (7.1) 65.1% (7.9)
Chicken breast - bovine muscle 5.7 × 10⁻¹³ 64.1% (3.1) 72.2% (8.9) 63.1% (8.1)
Average 79.5% 89.6% 83.2%
FD vectors from different tissue types (Kmax = 16): We performed the
ANOVA tests on FD vectors of different tissue types (Table 3). The p-values
were all virtually zero and showed that the vectors were statistically different
in all six pairs. Two separate FD vectors from each tissue type, computed from
the data acquired on RMV711 scanhead, were available. We combined the two
vectors of each tissue type to acquire a single vector of length 1000 and used
the Bayesian approach described in the previous section to perform pairwise
classifications. The results for these classification trials which were in single RF
sample resolution, are reported in column 3 of Table 3. It is interesting to note
that even at this resolution, we were successful in classification when the two
involved tissue types were from different microstructural categories (rows 1-4);
however, when pig liver was compared with bovine liver (row 5) or the two
fibrous tissue types were compared (row 6), the classification at this extremely
high resolution produced low accuracies.
Furthermore, we examined the performance of our approach at a lower reso-
lution. We averaged 10 samples of each FD vector to acquire vectors of length
50 (100 after combining the two lines from RMV711). Each element of these
vectors represented an ROI of size 20 microns. The results of pairwise classifica-
tion experiments at this level of resolution are presented in column 4, Table 3.
In general, the classification accuracy is significantly higher in this lower resolu-
tion (overall accuracy of 89.6% on RMV711). The mean accuracy for tissues in
different microstructural categories was around 95% (rows 1-4) and for tissues
with similar microstructures was around 80% (rows 5-6).
For validation purposes, the classification process (at 20 micron resolution)
was repeated on a similar dataset that was acquired on scanhead RMV706 (which
operates at a lower frequency and axial resolution). The results are reported in
column 5, Table 3. In general, the overall outcome declined in comparison with
RMV711 data (average over all: 83.2%). However, the same pattern of perfor-
mance (excellent on different microstructures, moderate on similar microstruc-
tures) was observed. The overall decrease in the classification results can be
explained by the lower axial resolution of RMV706.906 M. Moradi, P. Mousavi, and P. Abolmaesumi
90 90
88
85
average accuracy (%)
average accuracy (%)
86
80
84
75
82
70
80
65 78
10 20 30 40 50 0 5 10 15 20
Kmax ROI size
(a) (b)
Fig. 3. (a) The average of classification accuracy over six pairs of tissue for different
values of Kmax (at resolution of 10 samples). (b) The average of classification accuracy
over six pairs of tissue for different number of samples in an ROI (Kmax = 16).
Optimal Kmax value: We examined different possible values for Kmax (or
maximum scaling level of the signal) in Higuchi’s algorithm. In Figure 3-a, the
average accuracy of tissue classification over six pairs of tissue types is plotted
against the values of Kmax between 4 and 56. Values between 10 and 32 resulted
in very similar outcomes. The Higuchi algorithm becomes increasingly computa-
tionally expensive for large values of Kmax . We chose Kmax = 16 as a reasonably
small number that also resulted in maximum accuracy. This is also in agreement
with previous findings about the optimal Kmax value on RF time series acquired
from human prostate specimens [7].
Optimal ROI size: As Figure 3-b illustrates, the classification accuracy in-
creased when ROIs of larger size were used. However, we were limited by the
size of the dataset. Increasing the size of the ROI to over 10 samples meant that
the Gaussian PDFs were estimated on less than 100 data points and tested on
less than 10 points in our leave-10%-out classification approach. It appears that
this low number of samples was not sufficient for training and testing of the
classifiers and therefore, we witnessed an unexpected and irregular decrease in
the accuracy of classification for ROIs of sizes larger than 10 samples.
Comparison with results at 6.6 MHz: As previously reported, even at fre-
quencies normally utilized on clinical machines (2-10MHz), the RF time series
contain tissue characterizing information [7,6]. However, the maximum resolution
is much lower. For comparison, we used a Sonix RP (Ultrasonix Inc., Vancouver,
Canada) ultrasound machine to collect RF time series at 6.6 MHz from the same
specimens that we had scanned at high frequencies. The temporal length of time
series (number of frames taken from each cross-section) was 255 and the data
was collected with a BPSL9-5/55/10 probe at the rate of 22 frames per second.
ROIs of size 8 × 44 RF samples (equivalent to 0.03cm2) of the tissue were used
in classification; 150 ROIs from each tissue type were available. Results reported
in Table 4 show an overall accuracy of around 76.5%.Tissue Characterization Using Fractal Dimension 907
Table 4. Results of applying the proposed tissue classification approach to the data
acquired on a clinical ultrasound machine (probe center frequency: 6.6 MHz)
Tissue types classification accuracy (STD)
Bovine liver - chicken breast 82.9% (6.4)
Bovine liver - bovine muscle 80.7% (6.8)
Chicken breast - pig liver 71.4% (6.7)
Pig liver - bovine muscle 74.8% (7.5)
Bovine liver - pig liver 69.3% (5.3)
Chicken breast - bovine muscle 79.6% (5.9)
Average over all six tissue pairs 76.5%
4 Conclusions
In this paper we reported the exploitation of high-frequency RF time series for
tissue characterization. We used fractal dimension of RF echo time series ac-
quired on ultrasound probes operating at center frequencies of 55 MHz and 40
MHz to successfully characterize tissue types of different microstructure at the
resolution of only 20 microns. The correlation of variations in RF time series
with tissue microstructure was evident. FD vectors acquired from different areas
of one tissue type were very similar (Bayesian approach resulted in only around
50% successful separation of ROIs from two areas of one tissue type). For two
different tissue types which were from a similar category of microstructure (both
mammalian liver or both fibrous muscles), the ROIs could be separated with ac-
curacies around 80%. For tissue types from different microstructural categories,
the classification of ROIs based on the Gaussian approach was nearly perfect
(up to 98% accuracy). The same approach was also applied to data acquired
on a clinical ultrasound machine and an average accuracy of around 77% was
observed at the resolution of 0.03cm2 .
These findings strongly suggest that the microstructure of the tissue has an
effect on the variations of the RF time series. This concept can potentially be
used in ultrasound-based detection of pathologic conditions such as cancer.
Acknowledgement. The authors would like to thank Mr. G. Leney from Vi-
sualSonics Inc. and Mr. R. Watering for their help in data collection. This work
was supported by Natural Sciences and Engineering Research Council of Canada
(NSERC), and Institute of Robotics and Intelligent Systems (IRIS).
References
1. Foster, F.S., Pavlin, C.J., Harasiewicz, K.A., Christopher, D.A., Turnbull, D.H.:
Advances in ultrasound biomicroscopy. Ultrasound in Med. & Biol. 26, 1–27 (2000)
2. Akashi, N., Kushibiki, Dunn, N.C.F.: Acoustic properties of selected bovine tissues
in the frequency range 20-200 MHz. J. of Acoust. Soc. Am. 98(6), 3035–3039 (1995)
3. Goss, S.A., Johnston, R.L., Dunn, F.: Compilation of empirical ultrasonic proper-
ties of mammalian tissues. II. J. of Acoust. Soc. Am. 68, 93–108 (1980)908 M. Moradi, P. Mousavi, and P. Abolmaesumi
4. Scheipers, U., Ermert, H., Garcia-Schurmann, H.J.S.M., Senge, T., Philippou, S.:
Ultrasonic multifeature tissue characterization for prostate diagnosis. Ultrasound
Med. Biol. 20(8), 1137–1149 (2003)
5. Lizzi, F.L., Feleppa, E.J., Astor, M., Kalisz, A.: Statistics of ultrasonic spectral
parameters for prostate and liver examination. IEEE Transactions on Ultrasonics,
Ferroelectrics, and Frequency Control 44(4), 935–942 (1997)
6. Moradi, M., Mousavi, P., Isotalo, P.A., Siemens, D.R., Sauerbrei, E.E., Abolmae-
sumi, P.: A new approach to analysis of RF ultrasound echo signals for tissue
characterization: results of animal studies. In: Proceedings of SPIE conference on
Medical Imaging, vol. 6513, pp. 65130P1–65130P10 (2007)
7. Moradi, M., Abolmaesumi, P., Isotalo, P.A., Siemens, D.R., Sauerbrei, E.E.,
Mousavi, P.: A new feature for detection of prostate cancer based on RF ultrasound
echo signals. In: IEEE Ultrasonics Symposium, pp. 2084–2087. IEEE Computer So-
ciety Press, Los Alamitos (2006)
8. Thomenius, K.: Evolution of ultrasound beamformers. In: Proc. IEEE Intl Ultras
Symp., pp. 1615–1622. IEEE Computer Society Press, Los Alamitos (1996)
9. Accardo, A., Affinito, M., Carrozzi, M., Bouquet, F.: Use of the fractal dimen-
sion for the analysis of electroencephalographic time series. Biological Cybernet-
ics 77(5), 339–350 (1997)
10. Henderson, G., Ifeachor, E., Hudson, N., Goh, C., Outram, N., Wimalaratna, Per-
cio, C.D., Vecchio, F.: Development and assessment of methods for detecting de-
mentia using the human electroencephalogram. IEEE Transactions on Biomedical
Engineering 53(8), 1557–1668 (2006)
11. Shono, H., Goldberger, C.K.P.A.L., Shono, M., Sugimori, H.: A new method to
determine a fractal dimension of non-stationary biological time-serial data. Com-
puters in Biology and Medicine 30(4), 237–245 (2000)
12. Higuchi, T.: Approach to an irregular time series on the basis of the fractal theory.
Physica D 31(2), 277–283 (1988)You can also read