Seismic Hazard Assessment Considering Local Site Effects for Microzonation Studies of Chennai City
←
→
Page content transcription
If your browser does not render page correctly, please read the page content below
A Workshop on Microzonation
                                                                             ©Interline Publishing, Bangalore

            Seismic Hazard Assessment Considering Local Site Effects for
                      Microzonation Studies of Chennai City
               A. Boominathan, G. R. Dodagoudar, A. Suganthi and R. Uma Maheswari
             Department of Civil Engineering. Indian Institute of Technology Madras, Chennai

Introduction
Peninsular India has been considered as a stable continental region for years. It is primarily the
damages caused during the 2001 Bhuj earthquake (Mw 7.6) demanded the immediate study of the
Peninsular region. Earthquakes of Koyna (1967; Mw 7.6), Latur (1993; Mw 6.1) and Jabalpur (1997;
Mw 5.8) also occurred in the “stable” Indian shield. A review of the historical as well as recent
earthquake activity in peninsular India indicated that different parts of the peninsular region are
characterized by a low to moderate level of seismic activity. But it is only in recent decades that the
occurrence of some large and damaging earthquakes has caused concern, which led to the study of
peninsular seismicity in greater detail (Chandra, 1977). With the revised seismic zoning map pegged
Chennai at a higher activity zone (Zone III), there is a need to prepare seismic hazard map and site
specific design response spectra which will enable urban planners to design earthquake resistant
structures and strengthen existing unstable structures. In this paper, an attempt has been made to carry
out seismic hazard assessment for Chennai city considering the site effects.
Geology of Chennai City
Chennai is located between 12.75° − 13.25° N and 80.0° − 80.5° E on the southeast coast of India and
in the northeast corner of Tamil Nadu. It is the India's fourth largest metropolitan city covering an
area of 1,177 km². The geology of Chennai comprises of mostly clay, shale and sandstone. The city is
classified into three regions based on geology: sandy areas, clayey areas and hard-rock areas. Sandy
areas are found along the river banks and coasts. Igneous/metamorphic rocks are found in the
southern area; marine sediments containing clay-silt sands and Charnockite rocks are found in the
eastern and northern parts and the western parts are composed of alluvium and sedimentary rocks.
Clayey regions cover most of the city. The thickness of soil formation ranges from a few meters in the
southern part to as much as 50 meters in the northern and central parts.
Seismicity and Seismotectonics of the Region
Indian seismicity is characterized by a relatively high frequency of great earthquakes and a relatively
low frequency of moderate earthquakes. Typical seismicity of Peninsular India based mainly on
Gauribidanur seismic array (GBA) detections of regional earthquakes spanning two decades (1978–
1997) is shown in Figure 1.
Seismological information and seismotectonic features of the region were collected from the latest
Seismotectonic Atlas of India (2000). The Seismotectonic map combines the fault map with
geological features of the area under consideration. Regions with pronounced variation in thickness
show higher seismicity as compared to the parts with more or less uniform thickness. Historical
earthquake information within 300 km radial distance from Chennai was obtained from NEIC, USA
since 1800 A.D. onwards. A total of 65 earthquake data was obtained from this catalogue. The
seismological details gathered for establishing ground motion parameters for the Prototype Fast
Breeder Reactor (PFBR) building site at Kalpakkam located 60 km away from Chennai city were
used in this study (Ghosh, 1994). They have compiled 622 earthquake data from the GBA and global
Seismic Hazard Assessment 95
sources from the year 1968 to 1991 A.D. The summary of the earthquake events occurred in and
around Chennai city is presented in Table 1. The historical earthquake data prior to 1968 and the
recent seismicity of the region after the year 1991 to 2001 obtained from the NEIC, USA catalogue
was appended to the data compiled by Ghosh (1994). Repeated events were removed and finally a
new catalogue of 638 earthquake data was prepared. Seismic events with magnitude greater than 2 are
only considered in the preparation of earthquake catalogue.
Figure 1 Seismicity of Peninsular India (Gangrade and Arora, 2000)
TABLE 1 Summary of Earthquake Events
Global data GBA Data
Magnitude
Sr. No. No. of events No. of events No. of events No. of events
range
in the range with M > M in the range with M > M
1 2.0 – 2.5 1 39 109 417
2 2.5 – 3.0 3 38 110 308
3 3.0 – 3.5 1 35 103 198
4 3.5 – 4.0 7 34 54 95
5 4.0 – 4.5 19 27 35 41
6 4.5 – 5.0 1 8 4 6
7 5.0 – 5.5 6 7 2 2
8 5.5 – 6.0 0 1 0 0
9 6.0 – 6.5 1 1 0 096 Microzonation
BASE MAP PREPARATION
A base map is the one of the important ingredients of the seismic microzonation studies; a preparation
of which requires a special consideration. Over the last four decades Geographical Information
Systems (GIS) have emerged as the predominant medium for graphic representation of geospatial
data, including geotechnical, geologic and hydrologic information. Toposheets of scale 1:50,000
obtained from Survey of India were used for creating the base map. The GIS software, Arc Info was
used for creation of base map of the city (Figure 2). The scanned toposheets were digitized onscreen
with several layers including administrative boundaries, highways, railroads, water bodies, and land
marks as shown in Figure 2. A large number of borehole data were collected from the reputed
geotechnical agencies and marked on the map. Typical borehole locations for some of the regions of
the Chennai city are shown in the figure.
Thiruvallur
Kanchipuram
Figure 2 Base Map of Chennai City
Seismic Hazard Assessment
Deterministic Seismic Hazard Analysis
The methodology for this analysis can be described in four steps:
1. Source characterization, which includes identification, and characterization of all earthquake
sources which may cause significant ground motion in the study area.
2. Selection of the shortest distance between the source and the site of interest.
3. Selection of controlling earthquake i.e., the earthquake that is expected to produce the strongest
level of shaking.
4. Defining the hazard at the site formally in terms of the ground motions produced at the site by the
controlling earthquake.
The detailed investigation on the seismotectonics has been carried out to study the fault in and around
Chennai. The fault map was prepared from the seismotectionic Atlas map and the fault studies carried
out by ONGC and is shown in Figure 3. It indicates that the Palar fault and fault No. 24 were theSeismic Hazard Assessment 97
longest active faults near to the City. In the present study, we have assumed all the faults (36 in
numbers) to be seismically active but for deterministic seismic hazard analysis only 10 are
considered. It is a general practice to consider the seismic and seismotectonic information around 300
km radial distance from the site for the best representation of the seismic status of the region.
78.0 78.5 79.0 79.5 80.0 80.5 81.0
16.0 16.0
15.5 15.5
15.0 15.0
14.5 14.5
14.0 14.0
13.5 13.5
13.0 13.0
Latitude
12.5 12.5
12.0 12.0
11.5 11.5
11.0 11.0
10.5 10.5
10.0 10.0
9.5 9.5
9.0 9.0
78.0 78.5 79.0 79.5 80.0 80.5 81.0
Longitude
Palar Neot ect onic f ault Kilcheri M uttukadu Tambaram
Kaliveli Kalkulam Tallapuram M amallapuram Tenbakkam
12.00 13.00 14.00 15.00 15a
15b 15d 16.00 18.00 21.00
24 24a 26a 26b 26c
26d 37a 45.00 52 53
56.00 56e 15e 26.00 17.00
54
Figure 3. Fault Map of Chennai
Maximum magnitude for each fault source was obtained using the Wells and Coppersmith
relationships (1994) as given below.
Mw = 4.86 + 1.32 log L (1)
where Mw is the moment magnitude and L is the fault surface rupture length in km. The fault rupture
length is taken as l/3 of its total fault length as suggested by Mark (1977). It has been found that the
maximum magnitude ranges from 3.5 to 6.5 in the study area.
After computing the maximum magnitude for each seismic source (active fault) using Equation (1),
appropriate attenuation equation for strong ground motion is selected. In this study, an attenuation
relationship developed by Iyengar and Raghukanth (2004) particularly for the Peninsular India based
on a statistically simulated seismological model is made use of. Their equation for estimating the peak
ground acceleration (PGA in g) is of the form:
ln (PGA/g) = C1 + C2 (M-6) + C3 (M-6)2 – ln (R) – C4 R + ln ε (2)98 Microzonation
where C1 = 1.6858; C2 = 0.9241; C3 = -0.0760; C4 = 0.0057 and σ (ln ε) = 0.4648.
The maximum PGA of 0.134 g was obtained for Palar fault, which is located at a distance of 68 km
from the Chennai city. This PGA has been used as an input acceleration after suitable scaling for input
acceleration time history and the same is used in ground response analysis of the three suburbs
incorporating the site effects.
Evaluation of Vs From Correlations
A large and reliable borehole data for a number of sites in and around the Chennai city has been
obtained from the reputed geotechnical agencies. The details of the soil layers and their engineering
properties were assessed from the compiled data. Thus the selected locations of each of the chosen
suburbs (i.e., Velachery, Santhome, Anna Nagar and Mogappair) were characterized using the
geotechnical properties provided in the bore log along with SPT N values. The SPT N-values obtained
in the field were corrected for various factors: overburden pressure, hammer energy, bore hole
diameter, rod length and fines content. Shear wave velocity, Vs was estimated from the corrected
SPT-N values using the following empirical equations (JRA, 1980):
Vs (m/sec) = 100 N1/3 (for clay) (3)
1/3
Vs (m/sec) = 80 N (for sand) (4)
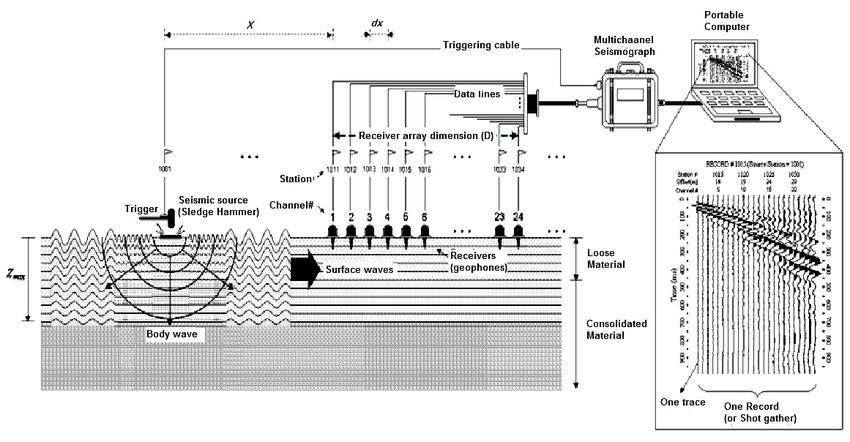
Evaluation of VS From Masw Tests
In this study, Geometrics make 24 channels Geode seismic recorder with SGOS operating software is
used to carry out MASW tests for the estimation of shear wave velocities in the selected suburbs of
the Chennai city. The vertical geophones of 4.5 Hz (24 Nos.) are used to receive the wavefields
generated by the active source of 5 kg sledgehammer. The acquired surface wave data are processed
using software − Surfseis and SeisImager to develop 1-D and 2-D shear wave velocity profiles. The
overall setup of the MASW test is shown in Figure 4.
Figure 4 Overall Setup of MASW TestSeismic Hazard Assessment 99
Description of the soil and the variation of SPT-N values with depth for West Mogappair site are
shown in Figure 5. The subsoil at the West Mogappair site consists of four layers. The top layer of
about 6 m thickness consists of medium stiff to stiff silty clay with SPT N values varying from 6 to
18. This layer is followed by loose to medium dense sand deposit of 7 m thickness with N values
increase from 4 to 16 with depth. The subsequent layer consists of soft to hard clay deposit of 14 m
thickness with N value varies from 5 to 78. This layer is followed by dense sand deposit of 3 m
thickness with N value >100. The wavefield data were acquired at the West Mogappair site using 24
Nos. of 4.5 Hz geophone spaced at 2 m intervals connected to the Geode seismic recorder. The
sledgehammer was discharged at an offset of 2, 25 and 48 m from the first geophone to develop the
1-D shear wave velocity profile.
SPT N value
0 10 20 30 40 50 60 70 80 90 100
0
1 Stiff clay
2
3 Sand
4 Fine to med sand
5
6 Clay
7
8 Fine to med sand
9
D ep th (m )
10
11
12
13 Med Stiff to stiff clay
14
15
16 Stiff to very stiff clay
17
18
19
20 Very stiff to hard clay
21
22
23
24
25
26 Dense sand
27
28
29
Figure 5. Variation of SPT with Depth
The shear wave velocity for this site was obtained using Multichannel Analysis of Surface Waves
method (MASW) and SPT-N value and it is tabulated in Table 2. Identification of the thickness and
shear wave velocity of subsurface layers involves the iterative matching of a theoretical dispersion
curve to the experimental dispersion curve. The variation of shear wave velocity (Vs) with depth from
MASW test is given in Figure 6.
Table 2 Shear Wave Velocity, Vs from MASW and SPT-N value
Soil description Vs from MASW (m/s) Vs from SPT-N (m/s)
Stiff clay 230 190
Fine to medium sand 240 180
Stiff clay 230 200
Fine to medium sand 200 180
Medium to stiff clay 190 170
Stiff to very stiff clay 240 330
Very stiff to hard clay 290 400
Dense sand 320 460100 Microzonation
Figure 6 Variation of Shear Wave Velocity with Depth
Ground Response Analysis
Local site conditions will profoundly influence all of the important characteristics mainly the
acceleration amplitude and frequency characteristics of ground motion during an earthquake. Ground
response analysis can be carried out using linear, equivalent linear or non-linear methods. For the
present study, one-dimensional equivalent linear approach is adopted to perform the site-specific
ground response analysis at various locations of the three suburbs such as Velachery, Santhome and
Anna Nagar (Mogappair) in the Chennai city. A computer program SHAKE 91, which uses
equivalent linear approximation for layered soils, is used for computing the seismic response of
horizontally layered soil deposits of the study area.
From deterministic seismic hazard analysis (DSHA), a rock level PGA of 0.134 g and bracketed
duration of 2 sec are obtained for all the three suburbs. The Loma Prieta earthquake (M = 6.7 and
PGA = 0.112g) of 18th October 1989 is selected as a possible candidate. This earthquake record
together with the estimated ground motion parameters of the study area was scaled to 0.134 g
(Figure 7) and accordingly the acceleration time history has been chosen and used in the subsequent
ground response analysis.
Soil amplification effects for a large number of sites around the Chennai city have been carefully
studied using the compiled borehole data and ground response analysis. Peak acceleration values and
acceleration time histories are computed at the top of each of the layers for all the soil profiles as well
as on the ground surface.Seismic Hazard Assessment 101
Input Tim e History
0.10
0.05
Acceleration, g
0.00
0 4 8 12 16 20 24 28 32 36 40
- 0.05
- 0.10
- 0.15
Tim e, sec
Figure 7 Input Acceleration Time History
Typical frequency response curves obtained for Velachery, Santhome and Anna Nagar sites are given
in Figure 8. The sites of Velachery, Santhome and Anna Nagar best represent the rocky, sandy and
clayey areas of the city respectively.
7
6 VELACHERY
Amplification factor
5 SANTHOME
4
3 ANNA NAGAR
2
1
0
0 5 10 15 20 25
Frequency, Hz
Figure 8 Frequency Response Function of Selected Regions
Typical response spectra depicting the stiff clay/medium dense sand, soft soil/medium stiff clay or
weathered rock/dense sand of the sites of the above three suburbs in Chennai city are shown in
Figure 9.
It is observed from the figure that:
• Weathered rock sites are found to dampen spectral values more slowly than the soil sites.
• Rock sites correspond to the low period (high frequency) motion whereas the soil sites
correspond to the high period (low frequency) motion.
• At periods above 0.4 sec, the spectral amplifications are higher for the soil sites than for the
rock sites.
• Soft soil deposits are found to spread over higher periods. Whenever longer period structures
such as bridges and tall structures are founded on these deposits, the period lengthening leads
to the resonance condition thereby contributing to the damage.
• Most importantly, the single response spectrum for all the sites is inappropriate and does not
depict the actual conditions. A further work on these lines is currently underway.102 Microzonation
SANTHOME
5
4 STIFF CLAY / MEDIUM
DENSE SAND
3
Sa/ g
2
1
0
0 0.5 1 1.5 2 2.5 3
Period, sec
VELACHERY
4.5
4
3.5
3 WEATHERED ROCK /
DENSE SAND
Sa /g
2.5
2
1.5
1
0.5
0
0.0 0.5 1.0 1.5 2.0 2.5 3.0
Period, sec
ANNA NAGAR
3.5
3
2.5
SOFT SOIL / MEDIUM
STIFF CLAY
2
Sa/g
1.5
1
0.5
0
0 0.5 1 1.5 2 2.5 3
Pe riod, se c
Figure 9 Response Spectra for the Selected Regions ofSeismic Hazard Assessment 103
Comparative Studies
The frequency response functions for West Mogappair site are obtained using the Vs values estimated
by empirical relations and those evaluated by MASW tests and are shown in Figures 10 (a) and (b). It
can be observed from the figures that the frequency response curves obtained using both the
approaches are nearly the same. However, it is noted the frequency response function obtained using
MASW is found to give realistic representation of amplification. The amplification of the PGA was
observed to be 3.8 for both the cases. The frequency response curves show several humps and
depressions depicting the gradual damping of the seismic waves. Based on the results of amplification
studies, an empirical equation is suggested to incorporate the site effects in the evaluation of PGA
value obtained using DSHA. The proposed equation is of the form:
n
⎡ ⎤
⎢ AF ⎥
PGA ( g ) = ( PGA ) DSHA ⎢ ⎥ (5)
⎢ f max − f min ⎥
⎢ f ⎥
⎣ mod al ⎦
where (PGA)DSHA is the PGA value obtained using DSHA (g), AF is the amplification factor, fmax is
the frequency in Hz at which 95% of the total energy is input to the system, fmin is the frequency in Hz
at which 5% of the total energy is input to the system, fmodal is the fundamental frequency of the soil
deposit and n is the coefficient which depends on the soil type and stress history. The final PGA value
is 0.141 g for the study area.
4.5
4
3.5
Amplification factor
3
2.5
2
1.5
1
0.5
0
0 5 10 15 20
Frequency, Hz
(a) Using Vs Calculated from Empirical Relation
4.5
4
3.5
Amplification factor
3
2.5
2
1.5
1
0.5
0
0 5 10 15 20
Frequency, Hz
(b) Using Vs Calculated from MASW Test
Figure 10. Frequency Response Function for West Mogappair Site104 Microzonation Conclusions The paper discussed the role of the subsoil conditions in the amplification of the seismic excitation for some selected suburbs of the Chennai city. The ground response analysis was carried out using SHAKE 91 software wherein the shear wave velocity inputs have been obtained using two approaches. The results of the ground response analysis for West Mogappair site are obtained for Vs value inputs taken from SPT-N value as well as MASW test and are found to be comparable. The outcome of the local soil effects on the ground response is well illustrated through the amplification factor. As the ground motion parameters obtained from the deterministic seismic hazard assessment at the bed rock level does not reflect the actual seismic status of the area, the PGA value obtained using DSHA is modified accordingly to take into account the influence of the local site effects. It is to be noted that the seismic hazard assessment has to incorporate the local site effects as realistically as possible in the analysis procedure in order to place a reliability on the estimated peak ground acceleration. Acknowledgements The authors like to thank The Department of Science and Technology, Government of India for funding the sponsored research project entitled “Seismic Site Characterization and Site Amplification Studies for Chennai City” (DST No: 23(497)/ SU/2004 Dt. 09/08/2005). The authors extend their thanks to M/s. Geotechnical Solutions, Chennai for providing the borehole data of the regions reported in the paper. References 1. Chandra, U. (1977). Earthquakes of Peninsular India – A Seismotectonic Study, BSSA, Vol. 67, pp. 1387-1413. 2. Gangrade, B. K. and Arora, S. K. (2000). Seismicity of the Indian Peninsular Shield from Regional Earthquake Data, Pure and Applied Geophysics, Vol. 157, pp. 1683 – 1705. 3. Ghosh, A. K. (1994). Design basis ground motion parameters for PFBR site, Kalpakkam, BARC, Mumbai. 4. Iyengar, R. N. and Raghukanth, S.T.G. (2004). Attenuation of Strong Ground Motion in Peninsular India, Seismological Research Letters, Vol. 75, pp. 530-540. 5. Japan Road Association (JRA) (1980). Specification and Interpretation of Bridge Design for Highway – Part V: Resilient Design, pp. 14-15. 6. Mark, R. K. (1977). Application of linear statistical model of earthquake magnitude versus fault length in estimating maximum expectable earthquakes, Geology, Vol. 5, pp. 464–466. 7. Seismotectonic Atlas of India (2000). Geological Survey of India, New Delhi. 8. Wells, D. L. and Coppersmith, K. J. (1994). New Empirical Relationships among Magnitude, Rupture Length, Rupture Width, Rupture Area, and Surface Displacement. BSSA, Vol. 84, pp. 974 - 1002.
You can also read