Dashboard 101 Tuesday, January 29, 2019 Hosted by: California ...
←
→
Page content transcription
If your browser does not render page correctly, please read the page content below

Dashboard 101
Tuesday, January 29, 2019
Hosted by: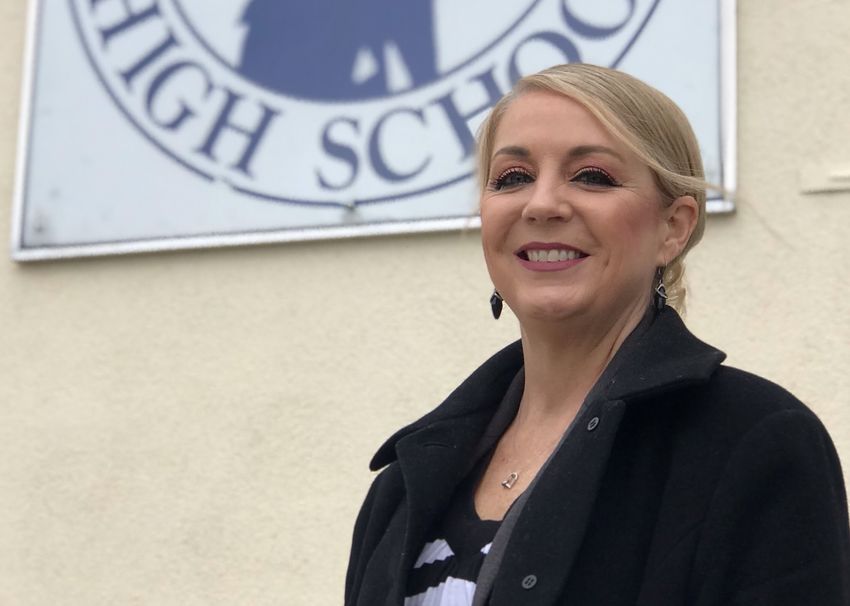
Agenda
   » Section I:    Module Overview

   » Section II:   Accountability and Continuous Improvement

   » Section III: Dashboard Overview and LIVE Demonstration

   » Section IV: Supporting Site Level Leadership & Stakeholders

   » Section V:    Supporting District Level Leadership & Stakeholders

   » Section VI: Closing and Next Steps

                                                                         2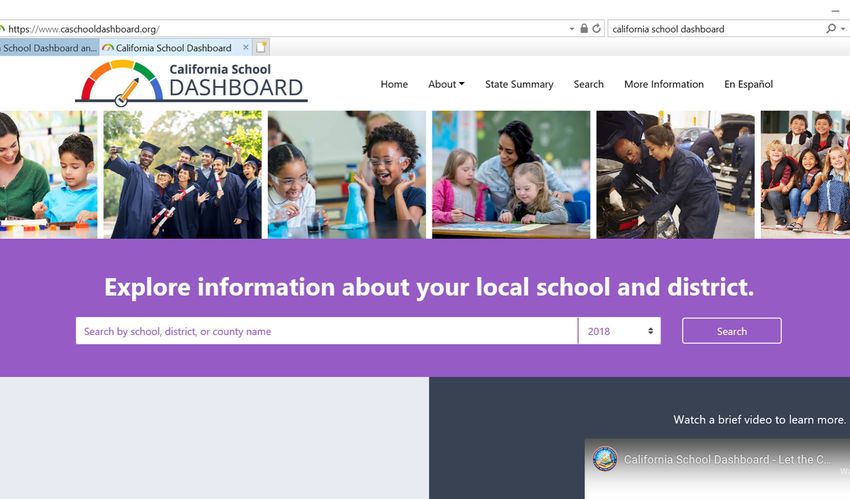
Section I
Module Overview

                  3
I. Housekeeping
    Dashboard 101 Toolkit:
    (https://ccee-ca.org/resource-collection.asp)
       » Video: Recorded webinar
       » Presentation slides: Webinar
       » Presentation slides: Dashboard Overview
       » Handout: Dashboard Discussion Protocol
       » Presentation Slides: School Site Leadership
       » Handout: Dashboard Reference Guide
       » Coming Soon!
          » Video and Podcast on Beaumont Unified
          » Academic Indicator                         4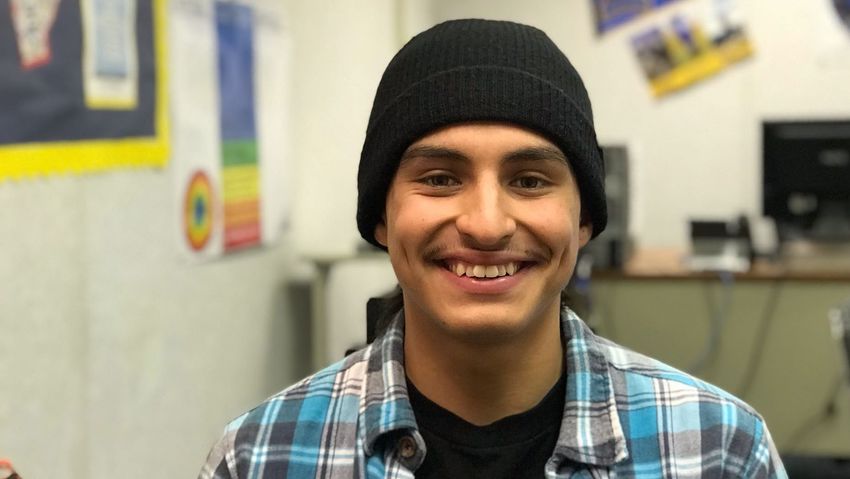
I. Question and Answer

        All participants may     Pause at the end of each
        submit questions using   section to answer a
        the chat feature         couple of questions

        Time at the end of the   Contact information is
        presentation for Q&A     provided (last slide)

                                                            5
I. Audience

        Local Educational Agency (LEA) staff involved in supporting and
        using the California School Dashboard

        Community members engaged in data-informed decision making
        to support local planning and evaluation

                                           Basic understanding of state and local
                                           indicators
        Helpful Prior Knowledge            Familiarity with Dashboard, LCAP, and
                                           System of Support

                                                                                    6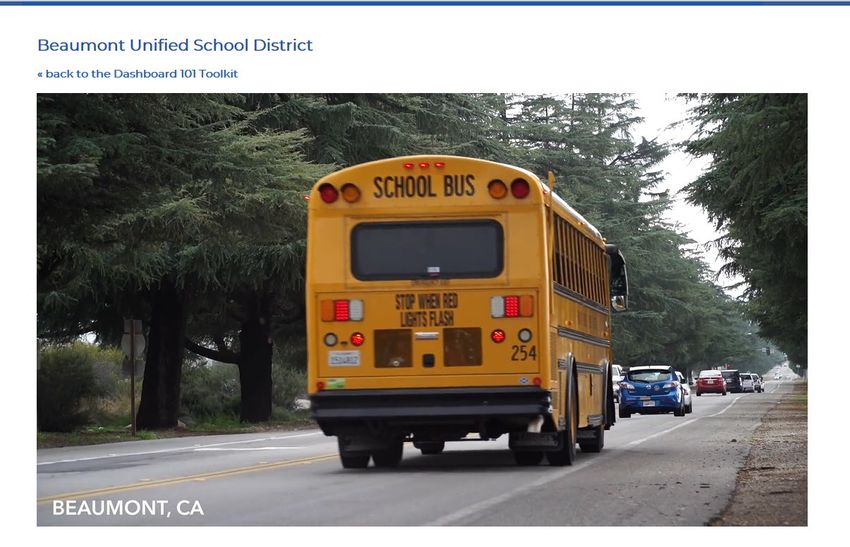
Today is…                             Today is not…
An opportunity to receive updates on the An overview of accountability
Dashboard and suggestions on how to use requirements for the Dashboard and
as a resource                            the LCAP Template

A chance for experienced attendees to     A deep dive into the nuances of the
review resources that may be helpful in   Dashboard data and technical details
trainings

A time for attendees to consider how to   A review of a uniform, prescribed
engage in an improvement cycle, taking    process for all LEAs to use throughout
into account local circumstances          the school year

                                                                                 7
I. Webinar Purpose

    » Provide “live" demonstration and walk through of
      the California School Dashboard
    » Discuss updates to state and local indicators
    » Explore resources that support training on
      Dashboard

                                                         8
I. Webinar Objectives
    The objectives of this training are to:
    » Understand the California School Dashboard
    » Learn the new design and navigation features
    » Review example data and resources

                                                     9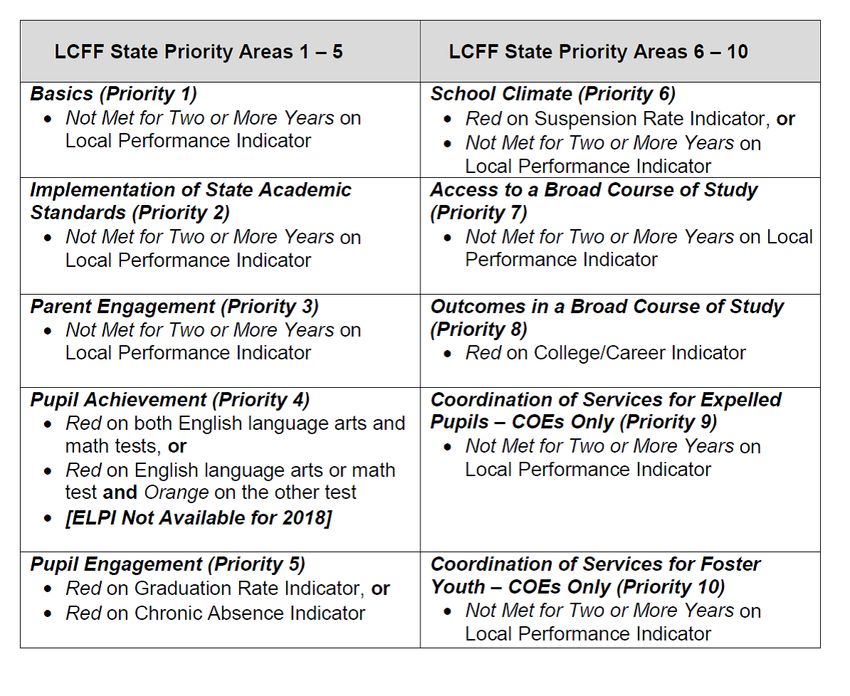
I. Presenters
»   Rigel Spencer Massaro, Senior Staff Attorney, Public Advocates, Inc.
»   Cindy Kazanis, Director, Analysis, Measurement & Accountability and Reporting Division, California
    Department of Education
»   Jenny Singh, Administrator, Academic Accountability Unit, California Department of Education
»   Kimberly Mundhenk, Consultant, Academic Accountability Unit, California Department of Education
»   Melissa Bazanos, Ed.D., Executive Director, Assessment, Accountability, and Continuous Improvement,
    Division of Educational Services, Riverside County Office of Education
»   Nick Chitwood, Ed.D., Data Coordinator, Assessment, Accountability, and Continuous Improvement,
    Division of Educational Services, Riverside County Office of Education
»   Heather Richter, Administrator, Continuous Improvement Support, Kern County Superintendent of
    Schools, Instructional Services
»   Michelle Magyar, Ph.D., Senior Manager, Continuous Improvement, California Collaborative for
    Educational Excellence

                                                                                                         10
Section II
Accountability and
Continuous
Improvement
Rigel Spencer Massaro, Senior Staff Attorney,
11
Public Advocates, Inc.II. Local Control Funding Formula (LCFF)
Equity: addressing different educational needs among students,
particularly those who need additional support
Local Control: using autonomy and stakeholder support under
LCFF to capitalize on LEA unique capacities
Continuous Improvement: reflecting and improving on rigorous
process to capitalize on LEA's unique capabilities to address
different educational needs of students on an ongoing basis
12As you are
participating in
this module, is
there a particular
student you want
this information to
impact?
Mark Navarrete
14
Glen View High School, studentII. Indicators by Priority
Local Control Funding
State Indicators Local Indicators
Formula Priority
Priority 1: Basic Services or Text books availability, adequate facilities, and
Basic Conditions at Schools correctly assigned teachers
Priority 2: Implementation of Annually report on progress in Implementing the
State Academic Standards standards for all content areas
Priority 3: Parent Engagement Annually report progress toward: (1) seeking input
from parents/guardians in decision making; and (2)
promoting parental participation in programs
Priority 4: Student Academic Indicator (3-8, 11)
Achievement English Learner Progress Indicator (1-12)
Priority 5: Student Chronic Absence Indicator (K-8)
Engagement Graduation Rate Indicator (9-12)
15II. Indicators by Priority
Local Control Funding Formula
State Indicators Local Indicators
Priority
Priority 6: School Climate Suspension Rate Indicator (K-12) Administer a Local Climate Survey every other year
Priority 7: Access to a Broad Annually report progress on the extent students have
Course of Study access to, and are enrolled in, a broad course of study
Priority 8: Outcomes in a Broad College/Career Indicator (9-12)
Course of Study
Priority 9 (COE Only) Services Annually report on the coordination of Services for
for Expelled Students Expelled Students
Priority 10 (COE Only) Services Annually report on the coordination of Services for
for Foster Youth Foster Youth
16II. The California Way
» Improve learning so all students can be successful in
school, college, work and life
» LCFF Priorities, Local Control and Accountability Plan,
California School Dashboard, and System of Support
are key features of this effort
17II. Local Control and Accountability Plan
» 3 year accountability plan
» Highlights state priority areas and goals to address local
needs
» Engages community members in the planning process
» Provides an opportunity to clarify how LEA is budgeting
and programming for equity
18II. California School Dashboard
» Online tool that reports
performance on state and local
measures
» Help parents and educators
identify strengths and areas for
improvement
19II. California System of Support
» Assist LEAs and schools meeting the needs of each
student served
» Focus on building capacity to sustain improvement
» Effectively address inequities in student opportunities and
outcomes
2021
II. System of Support Eligibility

 » Each of the three levels represents a type of assistance
   available or provided to eligible LEAs, not a status or label
   applied to LEAs

 » Criteria based on student group performance across:
   » two or more state and local indicators in the Dashboard
   » or two or more state priorities in the LCAP

                                                               22
State Indicators
Local Indicators
Not Met for Two or
More Years
23
23II. Continuous Improvement & Engagement Calendar
Sept – Oct (Capacity Building): Nov (Local Indicators):
- Update Parent Advisory Committees (PAC) - Local Indicators: review/input with PAC &
- Build PAC capacity community
- LCFF - Present Local Indicators to Board
- Dashboard, local indicators
- School budgets
Sept- Oct Nov Dec
Oct
Oct: Dec:
- Work with PAC, community stakeholders - Dashboard results released
to identify evaluations tools (surveys, - Present district’s results to Board and
questions, etc.) for Local indicators. community.
- Finalize measurements of Local - Further PAC training
Indicators and report.
24II. Continuous Improvement & Engagement Calendar
Jan – March (Annual Update):
- Review Dashboard (if not done in December).
- Review January budget from Governor with PAC and community stakeholders.
- Share district’s analysis of the areas of need with PAC and community stakeholders.
- Community listening sessions re areas of need
- Further training of PACs
Jan - April
March
April (LCAP Revision):
- Publish draft LCAP.
- Present draft LCAP to PACs and hold community listening sessions where
(1) draft LCAP is explained;
(2) proposed actions viewed against needs reflected in Dashboard results;
(3) feedback and suggestions gathered.
25II. Continuous Improvement & Engagement Calendar
May (Update LCAP Revisions):
- Incorporate May Revisions; be transparent re changes to LCAP.
- Present post-May Revise LCAP to PAC and community stakeholders; gather feedback.
- Provide time for PAC to comment & Supt. to respond re proposed LCAP.
- First Board meeting re proposed LCAP.
May June
June (Finalize LCAP):
- Provide time for PAC to comment & Supt. to respond re proposed LCAP.
- Second Board meeting re proposed LCAP.
- Adopt LCAP and budget by June 30th.
- Recruit new members for PAC for next year. 26Section III
California School
Cindy Kazanis, Director,
Dashboard
California Department of
Education
Demonstration 27III. Dashboard Overview
Instructional Slides in Dashboard https://www.caschooldashboard.org/
101 Toolkit
28Nick Chitwood, Ed.D., Data
Coordinator, Riverside County
Office of Education
Section IV
Supporting Site
Melissa Bazanos, Ed.D., Level Leadership
Executive Director, Riverside
County Office of Education
29IV. Beaumont Unified
Tony Knapp, Assistant Superintendent, Beaumont Unified Dr. Bobbie Burnett, Principal, Glen View High School
3031
IV. Dashboard Reflection Tool — Site Leaders
                    » Title: Here’s What. So What? Now
                      What?
                    » Resource Author: Beaumont Unified
                      School District
                    » Download: Dashboard 101 Toolkit
                      (https://ccee-ca.org/resource-
                      collection.asp)

                                                          32
IV. Dashboard Reflection Tool — Site Leaders
» Purpose: To provide a simple data discussion protocol that
sequentially takes site leaders through the following
steps:
» Here’s what (Develop factual statements regarding
performance)
» So what (Interpret the performance data)
» Now what (Create a plan of action)
» Time Frame Needed: 60 minutes
33IV. Dashboard Reflection Tool — Site Leaders
Here’s what. Factual statements.
Review District Performance Overview and discuss reflection questions
(partner or group):
1. What do you notice about the overall performance level color for each state indicator?
Record in table below.
2. What is the status for each state indicator? Record in table below.
3. How did each indicator “change” from the prior year (increased significantly, increased,
maintained, declined, declined significantly)? Record in table below.
34Group discussion using frames: 1. I noticed______ which makes me think________. 2. I am surprised that ________. 3. I’m not surprised that _______ because ___-_____. 4. I notice a potential pattern in the results for ________ which indicate ________. 5. I wonder what is driving the difference in results for ___________. 6. I wonder what might be behind ________. 35
IV. Dashboard Reflection Tool — Site Leaders
Key considerations when using this document:
  » Discussion and reflection utilizing this tool should occur with
    partners or a group
  » Determine what additional site-level or formative data can
    contribute to understanding causes for Dashboard outcomes
  » Utilize the provided frames in order to support reflection among
    participants
     » Example: I wonder what is driving the difference in results
       for ___________.
                                                                       36
IV. Dashboard Reflection Tool — Site Leaders
Key considerations when using this document:
» Make the connection to district/school priorities, programs,
actions and services
» Create a specific plan for sharing Dashboard data with site
staff and other stakeholders
37IV. Site-Level Reflection Presentation
» Title: California School Dashboard
» Resource Author: Riverside County Office of Education
» Intended Audience: Site-Level Leaders Facilitating
Dashboard Discussions Among Site-Level Stakeholders
» Purpose: Facilitate understanding of Dashboard as part of
the broader Continuous Improvement System
» Download: Dashboard 101 Toolkit (https://ccee-
ca.org/resource-collection.asp)
38IV. Site-Level Reflection Presentation
Presentation Sections (1–6):
1. What is the California School Dashboard?
2. Connecting the CA School Dashboard to California’s
Accountability and Continuous Improvement System
3. CA School Dashboard Methodology and Indicators
4. CA School Dashboard Analysis
5. Connecting CA School Dashboard Outcomes to School and
Classroom Practice
6. CA School Dashboard Resources
39IV. Site-Level Reflection Presentation
Section 4: School Dashboard Analysis
» Review your school’s performance for all
state indicators.
» What do we notice about the overall
performance level (color) for each
indicator?
» Which district or school programs,
actions, services, or initiatives might be
contributing to these results?
40IV. Site-Level Reflection Presentation
Section 4: School Dashboard Analysis
» Scroll down to see performance for
ELA, Math, ELPAC, and CCI (high
schools).
» Discuss a set of questions with your
table.
Status » Example: How did each indicator
Change
“change” from the prior year
(increased significantly, increased,
maintained, declined, declined
significantly)? To what do we attribute
the change or lack of change?
41IV. Site-Level Reflection Presentation
Section 4: School Dashboard Analysis
» Based on review of overall data, select ONE
indicator to explore in greater depth. Use the
“View Additional Reports” button to view 5x5
placement charts:
» Which student groups are demonstrating success or
improvement? To what might we attribute success?
Additional
student
» Which student groups need support? How might we
group data is respond?
available by
clicking on » Are there actions/ services in the SPSA aligned to needs?
each color.
Additional » How does this indicator connect to outcomes for other
student data
will appear
Dashboard indicators?
for each » What local/interim metrics are we using to monitor
performance
level. progress throughout the year? 42IV. Site-Level Reflection Presentation
Section 5: Connecting Dashboard to School and Classroom
» The LCAP is a comprehensive district plan. The School
Plan for Student Achievement (SPSA) serves as the
school’s comprehensive plan. Plans are aligned to the
eight state priorities and district/school priorities.
» Dashboard data for state and local indicators informs
actions and services included in the LCAP and SPSA.
» Districts and schools monitor interim metrics that
contribute to Dashboard outcomes.
» Monitoring leading indicators and formative measures
and adjusting support accordingly will enable schools to
provide a targeted focus on student groups and individual
student performance and progress.
43
43IV. Site-Level Reflection Presentation
Section 5: Connecting Dashboard to School and Classroom
» Discuss, chart, and record responses:
» What are our local metrics that inform annual
Dashboard outcomes in College/Career Readiness?
» How are metrics monitored regularly?
» How do we ensure we focus on student group
performance and progress?
» How might school policies and practices contribute to
the the number of students prepared for college and
career?
» What supportive practices are implemented in the
school and classroom? How do we know they are
occurring and effective? 44IV. Site-Level Reflection Presentation
Section 5: Connecting Dashboard to School and Classroom
• Conclude with whole group debrief on table discussions
with charted and recorded responses to the guiding
questions for each indicator
45IV. Site-Level Reflection Presentation
» Key considerations when using this document
» All terminology and graphics are aligned with existing
California Department of Education resources
» All indicators are covered in the presentation in Section 4, but
data analysis will not cover all Dashboard indicators. Focus on
one specific dashboard indicator depending on local needs.
46IV. Site-Level Reflection Presentation
» Key considerations when using this document
» It is recommended that Section Five (Connecting Dashboard
Outcomes to School and Classroom Practice) NOT be skipped,
as it is where Dashboard outcomes are connected to:
» School and classroom practices
» How sites can continuously monitor progress throughout the year
47IV. Academic Indicator Video
» Title: The Academic Indicator – California State
Dashboard
» Resource Author: Riverside County Office of Education
» Intended Audience: Any stakeholder group
» Format: PDF Presentation, Video
» Purpose: To provide a visual explanation regarding the
academic indicator and the calculation of Distance from
Standard
48IV. Making the Dashboard Real for Students
» Title: Hemet High School Senior Lunch Pass Instructions
» Resource Author: Hemet High School, Hemet Unified
School District
» Intended Audience: Site Leaders for Use with Students
and Parents
» Format: Single Page Word Document
» Purpose: To use College-Career Indicators as part of a self-
analysis by students to determine eligibility to go off-
campus for lunch
49IV. Making the Dashboard Real for Students
» Key Considerations in Using This Document:
» This is an example of how to make a Dashboard Indicator more
tangible for students who are removed from directly
responding to the State accountability system
» Think about how you can create opportunities in your local
context to have students analyze their own progress to College-
Career Readiness
» Consider how to communicate the details of similar efforts with
school site staff such as counselors or teachers, as well as with
parents or other stakeholders
50Section V
Supporting District
Leadership and
Stakeholders
Heather Richter, Administrator,
Kern County Office of Education
51V. Dashboard Reference Guide
» Developed by Kern COE to support district administrators
» KCOE Google Folder:
» Short Overview (also included in this slide deck)
» Dashboard Basics Presentation
» Dashboard Reference Guide
52V. Purpose of the Dashboard Reference Guide
1. Provide a quick reference guide for administrators and
stakeholders
a. Identify indicators
b. Identify data used for each indicator
c. Identify the criteria used to calculate status and change
d. Provide the 5x5 or 3x5 grids for each indicator by category
2. Provide meaningful use of the 5x5 or 3x5 grids to create
appropriate LCAP measurements
53V. Dashboard Reference Guide
54V. Dashboard Reference Guide
55V. Dashboard Reference Guide
56V. Dashboard Reference Guide
57V. How might the Dashboard inform
my LCAP?
58V. How do you determine Expected Annual Measurable
Outcomes?
591. Determine where each student
group is located on the 5x5 grid.
V. 5x5 with Guiding Questions 2. Determine long term goal or
performance color with needed
stakeholders.
3. With long term goal in mind, how
might progress be made?
a. Focus on % of current year
status?
b. Focus on % of change from
last year?
4. How much progress needs to be
made yearly to reach your long term
goal?
5. Report that annual progress with
the LCAP/SPSA Annual Measurable
Outcomes.
6. Discuss what actions and services
are in place to support the long
term goals.
60The dashboard helps LEAs add
meaningful data points into the Review of
Performance in the LCAP template.
What are your green and blue priorities?
What are your areas with high status?
What are your areas with greatest growth?
What are your orange or red priorities?
What are your areas with low status?
What are your areas with the least growth?
Once the identification of student groups with
performance gaps from this area, what changes
will you make in your actions and services?
What actions and services will be given to
address the greatest needs?
What actions and services will help accelerate
the closing of performance gaps?
61Section VI
Closing and Next
Steps
Michelle Magyar, Ph.D., Senior Manager,
California Collaborative for Educational
Excellence
62VI. Closing Comments
» Dashboard is part of a larger system
» Local, formative data used continuously
» Provides information to inform LEA decisions on supports
» High need or unduplicated student groups
6364
VI. Survey Link

 • Link will be provided at the conclusion of the presentation

                                                             65
VI. Disclaimer
» Any references herein, regardless of form, to any person or organization other than
the CCEE—or to third party-created activities, products, services, or links—are
provided solely for convenience and informational purposes.
» Such references do not constitute or imply endorsement, recommendation, or
preferential treatment by the CCEE or any of its agents or representatives.
» The CCEE is not responsible for and shall not be liable for any loss or damage of any
kind incurred as a result of dealings with, and makes no representation, guarantee,
or warranty regarding these third parties or any activities, products, services, or other
information or resources offered by a third party or located on or accessible from
any third party website, including but not limited to compliance with applicable web
accessibility requirements.
66VI. Additional Resources
67VI. Additional Resources
68VI. Additional Resources
69VI. CCEE Trainings
(https://ccee-ca.org/training-2018-2019.asp)
Budget Transparency: LCFF Overview for Parents!
» February 21, 2019
10:30am - 12:00pm
Register here!
Data & Evaluation: Spotlight on Chronic Absenteeism
» February 27, 2019
1:00pm - 3:00pm
Register here!
70VI. CCEE Toolkits
(https://ccee-ca.org/resource-collection.asp)
» Dashboard Alternative School Status (DASS) Toolkit
» Authentic LCAP Engagement Toolkit
» Rethinking Increased/Improved Services & the LCAP
71VI. CDE Implementation Update Sessions for Stakeholders January 29, 2019 at 2 p.m. Local Control and Accountability Plan (LCAP) Changes Event number: 669 254 362 Event password: 161484 Event registration/address for attendees: https://cdeevents.webex.com/cdeevents/onstage/g.php?MTID=e48a89bfde4e65ce4e0218f5202d7f6cb February 5, 2019 at 2 p.m. School Plan for Student Achievement (SPSA) Event number: 661 374 924 Event password: 161486 Event registration/address for attendees: https://cdeevents.webex.com/cdeevents/onstage/g.php?MTID=e786a73ca58158703ebac8df009e084ed February 15, 2019 at 12:30 p.m. ESSA Implementation Stakeholder Session In Person Attendee: 1500 Capitol Avenue, Auditorium Virtual Attendee: Event number: 404 928 073 Event password: 162266 Event registration/address for attendees: https://cdeevents.webex.com/cdeevents/onstage/g.php?MTID=e1b3a6a449f2fe1172be0239d2c8479c1 72
VI. Acknowledgements

» Tony Knapp, Assistant Superintendent, Instructional
  Support Services, Beaumont Unified School District
» Bobbie Burnett, Ed.D., Principal, Glen View High School
» Mark Navarrete, student, Glen View High School
California Collaborative for Educational   Michelle Magyar                                       mmagyar@ccee-ca.org
          Excellence                                 Senior Manager of Continuous Improvement

Contact
Us        Public Advocates                           Rigel Spencer Massaro, Senior Staff Attorney          rmassaro@publicadvoca
                                                                                                           tes.org

          California Department of Education         Cindy Kazanis, Director, Analysis, Measurement &      CKazanis@cde.ca.gov
                                                     Accountability and Reporting Division                 JSingh@cde.ca.gov

                                                     Jenny Singh, Administrator, Academic Accountability
                                                     Unit
          Riverside County Superintendent of         Melissa Bazanos, Ed.D., Executive Director,           MBAZANOS@rcoe.us
          Schools                                    Assessment, Accountability, and Continuous            nchitwood@rcoe.us
                                                     Improvement, Division of Educational Services
                                                     Nick Chitwood, Ed.D., Data Coordinator,
                                                     Assessment, Accountability, and Continuous
                                                     Improvement, Division of Educational Services
          Kern County Superintendent of Schools      Heather Richter, Administrator-Continuous             herichter@kern.org
                                                     Improvement Support

                                                                                                                          74
You can also read