Coronavirus (COVID-19): Analysis - The ...
←
→
Page content transcription
If your browser does not render page correctly, please read the page content below
social
                                                         research

Coronavirus (COVID-19): Analysis

    State of the Epidemic in Scotland – 2nd July 2021

    Background

    This report summarises the current situation on the Covid-19 epidemic in
    Scotland. It brings together the different sources of evidence and data
    about the epidemic in Scotland at this point in time, why we are at that
    place, and what is likely to happen next. This summarises the data up to
    and including 1 July 2021 on Covid-19 in Scotland. This updates the
    previous publication published on 25 June 20211. The information in this
    document helps the Scottish Government, the health service and the
    wider public sector respond to the epidemic and put in place what is
    needed to keep us safe and treat people who have the virus.

    This edition of the State of the Epidemic summarises current data on
    Covid-19 at a national and local level, and how Scotland currently
    compares to the rest of the UK. It looks at the vaccination program in
    Scotland and the effects that are beginning to be seen from this.
    Information is provided about variants of concern and what impact these
    may have. Bringing this information together in one place gives the
    opportunity to better understand the current state of the epidemic in
    Scotland.

    Key Points

    • The reproduction rate R in Scotland is currently estimated as being
      between 1.2 and 1.5, based on data up until the 28th June. This has
      increased since last week. The R and growth rate indicators lag by
      two to three weeks, as a result the estimates cannot fully reflect the
      significant increase in daily cases seen over the past week.
    • An average of 3,107 cases were reported per day in the 7 days to
      1 July, which is a 71% increase in reported cases since the 24 June.

    1
        Scottish Government: Coronavirus (COVID-19): state of the epidemic - gov.scot (www.gov.scot)
• There were 375 weekly cases per 100,000 in the week to 28 June,
  which is an increase since last week. This compares to 302 weekly
  cases per 100,000 on 8 January and is the highest case rate
  recorded in Scotland since the start of the pandemic.
• Case rates saw a rise amongst all age bands over the last week. The
  highest case rates were observed amongst 20-39, followed by 0-19,
  40-59, 60-79 and 80+ this week.
• As determined through the latest weekly ONS survey, the estimated
  proportion of people becoming infected with Covid in the community
  in Scotland has continued to increase in the most recent week.
  Scotland is currently above England, Wales and Northern Ireland.
• Latest modelled estimates suggest there are currently between
  48 and 76 new daily infections per 100,000 people in Scotland.
• There were 17 deaths registered in Scotland where coronavirus was
  mentioned on the death certificate in the week ending 27 June.
  Deaths have increased in those aged 45-64 (from 0 to 1 death),
  65-74 (from 2 to 5 deaths) and 75-84 (from 2 to 8 deaths) over the
  3 weeks to 27 June. COVID deaths declined a little in those aged
  85+ (from 3 to 2 deaths) over this period.
• Average daily deaths per 100,000 population in Scotland (0.04) are
  above England (0.02), Wales (0.01) and Northern Ireland (0.00).
• Dundee currently has the highest weekly case rate in Scotland
  reporting 788 cases per 100,000 in the week to 28 June, followed by
  Midlothian with 676 weekly cases per 100,000 East Lothian with 624
  weekly cases per 100,000. There were 25 other local authorities
  reporting over a 100 weekly cases per 100,000 population in the last
  week. Na h-Eileanan Siar reported 7 weekly cases per 100,000 in the
  same period.
• Modelled rates of positive tests per 100,000 population using data to
  28th June indicate that for the week commencing 11th July 2021,
  there are 28 local authorities with at least a 75% probability of
  exceeding 150 cases. Of these, 19 local authorities have at least a
  75% probability of exceeding 500 cases per 100,000. These are
  Aberdeen, Aberdeenshire, Angus, Edinburgh, Dundee, East Ayrshire,
  East Dunbartonshire, East Lothian, Falkirk, Fife, Glasgow, Midlothian,
  North Ayrshire, North Lanarkshire, Perth and Kinross, Renfrewshire,
  South Lanarkshire, West Dunbartonshire and West Lothian. There
  are 4 local authorities with at least a 75% probability of exceeding
  1000 cases per 100,000. These are Dundee, Edinburgh, Fife and
  Glasgow. Of these, Edinburgh is expected to exceed 2000 cases per
  100,000 with at least a 75% probability.
• The overall level of wastewater (WW) Covid-19 rose rapidly in the last
  week.
• Based on the recent increase in cases, infections, hospital beds and
  ICU are projected to rise – how long this continues for is uncertain.
  Following the recent increase in cases, projections of a continued
  growth in the epidemic in Scotland, are with considerable uncertainty
  as to what this means for future weeks.
• Over 3.8 million people in Scotland have been given a first vaccine
  against SARS-CoV-2, and over 2.7 million have now received a
  second dose.
• The Delta variant of concern, (VOC-21APR-02, first identified in
  India), is now the dominant strain in Scotland.

Method

This report brings together a wide range of publically available figures
from a range of data sources. These include publications by Scottish
Government, Public Heath Scotland, National Records of Scotland and
Office for National Statistics along with scientific publications and SAGE
summaries where appropriate to summarise the state of the epidemic in
Scotland in a given week. We also provide information on public
attitudes to the virus from weekly YouGov polling surveys.

The national picture

The latest R value for Scotland (published on 1 July and based on data
up to 28 June)2 was between 1.2 and 1.5 (Figure 1), with a growth rate
of between 3% and 7%. The R and growth rate indicators lag by two to
three weeks, as a result the estimates cannot fully reflect the significant
increase in daily cases seen over the past week.

2
    Scottish Government: Coronavirus (COVID-19): modelling the epidemic - gov.scot (www.gov.scot)
Figure 1. R in Scotland over time.
2.0
1.5
1.5
1.0 1.2
0.5
0.0
16/09
30/09
14/10
28/10
11/11
25/11
09/12
23/12
13/01
27/01
10/02
24/02
10/03
24/03
07/04
21/04
05/05
19/05
02/06
16/06
30/06
An average of 3,107 cases were reported per day in the 7 days to 1 July.
This is a 71% increase from the daily average cases recorded a week
earlier to 24 June3. Average daily cases reported are 34% higher than
the peak of 2,323 in the week to 7 January. Our current position is 375
weekly cases per 100,000 in the week to 28 June4. This compares to
302 weekly cases per 100,000 on 8 January (see Figure 2) and is the
highest case rate recorded in Scotland since the start of the pandemic 4.
Following PHS analysis, 1,991 people resident in Scotland with a
laboratory-confirmed COVID-19 diagnosis were identified as having
attended one or more Euro 2020 events during their infectious period (a
time in which they may have unknowingly transmitted their infection to
others) between 11-28 June 20215. Almost 74% (1,470 cases) of these
were of 20-39 year olds5.
The number of locations where the levels of Covid in wastewater are
monitored has increased to 110 sites around Scotland. In contrast to
Covid-19 case records, virus shedding into wastewater is a biological
process. This means that wastewater data is unaffected by factors that
impact whether testing is done. The level of wastewater Covid-19 has
increased rapidly in the last week.
3
Scottish Government: https://www.gov.scot/publications/coronavirus-covid-19-daily-data-for-scotland/
4
Public Health Scotland Covid dashboard: https://public.tableau.com/profile/phs.covid.19#!/vizhome/COVID-
19DailyDashboard_15960160643010/Overview
5
Public Health Scotland COVID-19 Statistical ReportFigure 2. Seven day case rate for Scotland by specimen date. Refers to
PCR testing only.
400
350
7 day cases per 100,000
300
250
200
150
100
50
0
Specimen date
Case rates have risen across all age bands this week, with the highest
case rates similarly to last week currently being reported in those aged
20-39 followed by 0-19, 40-59, 60-79 and 80+ (Figure 3).
Figure 3. Seven day case rate in Scotland by age group by specimen
date6. Refers to PCR testing only.
800
7 Day Cases Per 100,000
700
600
500
400
300
200
100
0
Specimen Date (after 14 September 2020)
0-19 20-39 40-59 60-79 80+
6
Source: Public Health ScotlandNot everyone who has the virus will be tested, as many people do not realise they have Covid, or they have mild symptoms and do not come forward. Latest modelled estimates, based on data up to 28 June, suggest there are currently anywhere between 2,600 and 4,200 people infected in Scotland each day2. This means that as of 30 June there were between 48 and 76 new daily infections per 100,000 people. The number of people in hospital with confirmed Covid for less than 28 days has started to increase. After peaking at 2,053 on 22 January, this figure decreased to a low of 58 on 6 May. This has since increased and as of 1 July there were 275 patients in hospital with Covid-19. Daily hospital admissions for people with Covid follow a similar pattern, having decreased from a peak of 241 on 11 January to a low of 4 on 28 April, and have since increased to 29 on 27 June7. There were 17 deaths registered where Covid was mentioned on the death certificate in the week to 27 June. This is slightly higher than the 13 deaths the week before (+31%), and 97% lower than the peak in April 2020 (663 deaths). The proportion of deaths in care homes decreased from 60% in April 2020 to between 0% and 25% of Covid deaths from 3 May to 6 June 2021. In the most recent week ending 27 June, no deaths occurred in care homes. Deaths involving coronavirus have increased in those aged 45-64 (from 0 to 1 death), 65-74 (from 2 to 5 deaths) and 75- 84 (from 2 to 8 deaths) over the 3 weeks to 27 June8 (Figure 4). Deaths decreased from 3 to 2 weekly deaths in the over 85s over the same period. However, this variation in age and location is expected when death numbers are low. 7 Public Health Scotland dashboard: COVID-19 Daily Dashboard - PHS COVID-19 | Tableau Public 8 NRS Scotland: https://www.nrscotland.gov.uk/statistics-and-data/statistics/statistics-by-theme/vital- events/general-publications/weekly-and-monthly-data-on-births-and-deaths/deaths-involving-coronavirus-covid- 19-in-scotland
Figure 4. Deaths by age group (weekly total by week beginning, NRS)7.

How Scotland compares with the rest of the UK

The latest ONS survey estimates that the proportion of the population
infected in the community in Scotland (0.68% of people currently testing
positive for Covid-19 from 20 to 26 June) has continued to increase in
the most recent week. The estimation is above England (0.39%),
Northern Ireland (0.15%) and Wales (0.22%). In the week to 26 June the
estimated rate of community infection was 1 in 150 people in Scotland,
compared to 1 in 260 for England, 1 in 670 for Northern Ireland and 1 in
450 for Wales9. Average daily deaths in Scotland (0.04 per 100,000 in
the week to 1 July) are above England (0.02), Wales (0.01) and
Northern Ireland (0.00). The Coronavirus Infection Survey estimated that
in the week beginning 7 June 2021, 79.1% of the adult population in
Scotland would have tested positive for antibodies against Covid-19, as
a result of having the infection in the past or being vaccinated. This
compares to 86.6% in England, 88.7% in Wales and 85.4% in Northern
Ireland10.

9
  Office for National Statistics:
https://www.ons.gov.uk/peoplepopulationandcommunity/healthandsocialcare/conditionsanddiseases/bulletins/cor
onaviruscovid19infectionsurveypilot/previousReleases
10
   Office for National
Statistics:https://www.ons.gov.uk/peoplepopulationandcommunity/healthandsocialcare/conditionsanddiseases/bul
letins/coronaviruscovid19infectionsurveyantibodyandvaccinationdatafortheuk/22june2021
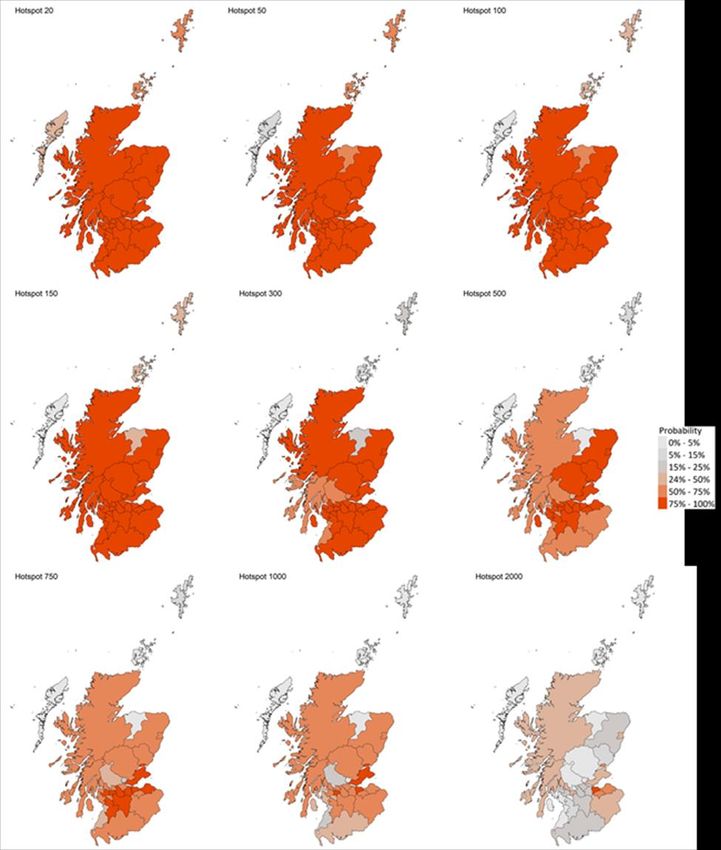
81,000 people in Scotland (1.53% of the respective population) living in
private households were experiencing self-reported long COVID
symptoms for any duration as of 6 June 2021. This compares to 1.51%
in England, 1.41% in Wales and 0.97% in Northern Ireland11.

Following the ONS analysis of new positive infection after COVID-19
vaccination at the UK level, 0.5% of those who had been vaccinated had
a new infection after vaccination to 31 May 2021. A lower proportion
(0.1%) tested positive after two vaccinations 12.

Situation by local authority within Scotland

Dundee currently has the highest case rate in Scotland with 788 weekly
cases reported per 100,000 in the week to 28 June, which is a 106%
increase from the week to 21 June4. It is followed by Midlothian with 676
weekly cases per 100,000, and East Lothian with 624 cases per 100,000
population. In the week to 28 June there were 25 other local authorities
reporting over a 100 weekly cases per 100,000 population (Table 1).
There are mostly very high levels of cases across Scotland (Figure 5).
All local authorities, except for Shetland, recorded an increase in cases
per 100,000 population over the last week. Na h-Eileanan Siar has the
lowest case rate in Scotland, reporting 7 weekly cases to 28 June4.

11
   Office for National Statistics: Prevalence of ongoing symptoms following coronavirus (COVID-19) infection in
the UK - Office for National Statistics (ons.gov.uk)
12
   Office for National Statistics: Coronavirus (COVID-19) Infection Survey technical article: analysis of positivity r
accination data - Office for National Statistics
Table 1. Total new weekly cases per 100,000 population to 28 June
2021, in order of prevalence.

                            Total new weekly       Change since
Local authority             cases per 100,000      previous week (21
                            population (28 June)   June )
Dundee City                 788                    +405
Midlothian                  676                    +374
East Lothian                624                    +231
City of Edinburgh           585                    +248
Renfrewshire                486                    +293
East Ayrshire               455                    +176
West Dunbartonshire         454                    +201
East Dunbartonshire         431                    +196
East Renfrewshire           430                    +223
Angus                       423                    +286
Glasgow City                411                    +195
Fife                        375                    +257
Perth and Kinross           363                    +143
West Lothian                359                    +195
Aberdeen City               357                    +185
North Lanarkshire           351                    +173
Falkirk                     331                    +208
South Lanarkshire           279                    +81
Clackmannanshire            277                    +114
Inverclyde                  276                    +125
Stirling                    269                    +162
Scottish Borders            265                    +77
North Ayrshire              248                    +34
South Ayrshire              247                    +78
Argyll and Bute             235                    +35
Highland                    218                    +167
Aberdeenshire               185                    +90
Dumfries and Galloway       144                    +72
Moray                       70                     +49
Shetland Islands            57                     0
Orkney Islands              40                     +18
Na h-Eileanan Siar          7                      +7
Scotland                    375                    +182
Figure 5. Map of weekly new positive cases per 100,000 people in Scotland. The most recent modelling predicts, based on data up to 28th June, that for the week ending 17 July there are 28 local authorities that have at least a 75% probability of exceeding 150 cases per 100,000 population. Of those, 19 local authorities have at least a 75% probability of exceeding 500 cases (Aberdeen, Aberdeenshire, Angus, Edinburgh, Dundee, East Ayrshire, East Dunbartonshire, East Lothian, Falkirk, Fife, Glasgow, Midlothian, North Ayrshire, North Lanarkshire, Perth and Kinross, Renfrewshire, South Lanarkshire, West Dunbartonshire and West Lothian) and 4 local authorities (Dundee, Edinburgh, Fife and Glasgow) have at least a 75% probability of exceeding 1000 cases per 100,000 (Figure 6)2.
Figure 6. Maps of probability of Local Authorities exceeding 20, 50, 100,
150, 300, 500, 750, 1000 and 2000 cases per 100,000 population in the
period 11-17 July 2021. Data used to 28 June.
Children and Education

Over the last week there was a further increase in the total number of
COVID-19 cases in young people, which has gone up from 2,658 cases
in the week to 20 June to 4,852 cases in the week ending 27 June. 7
day cases per 100,000 have also increased in all age groups in the
week ending 27 June (Figure 7). The percentage of cases made up of
children under 12 was just over 35% (1,719 cases) compared to just
over 46% (1,239 cases) in the previous week13.

The rate of testing increased amongst all age groups in the week ending
27 June. Test positivity rates increased amongst all age groups in the
same period13. The proportion of positive cases who report having been
in an education setting in the 7 day period prior to the onset of
symptoms has decreased to 10.5% in week ending 27 June, from 19.1%
of positive cases in the previous week. Hospital admissions amongst
children continue to increase, with a 3-week rolling average of 3.3
admissions for 2-4 year olds, 5.0 for 5-11 year olds, and 3.0 for 12-17
year olds up to 23 June13. These are now higher than levels seen in
December and late January and compares to 3.7 among 2-4 year olds,
3.7 among 5-11 year olds and 3.3 among 12-17 year olds in the period
ending 16 June.

This section will not be updated in the coming weeks due to school
summer holidays.

13
     Public Health Scotland: PHS COVID-19 Education report (shinyapps.io)
Figure 7. Seven day case rate in Scotland by age group by specimen
date for children. Refers to PCR testing only.
1200
1000
7 day cases per 100,000
800
600
400
200
0
Week Ending
2-4 years 5-11 years 12-15 years 16-17 years 18-19 years
Looking ahead
Changes in patterns of mixing and adherence to restrictions will impact
on future case numbers. The Scottish Contact Survey measures times
and settings that people mix where they could potentially spread Covid2.
From this survey we can say that average contacts have increased
slightly (6%) in the last two weeks (comparing surveys pertaining to 3rd
June - 9th June and 17th June - 23rd June) with a current level of 4.6
daily contacts. Contacts within the school setting were 3 times higher
than reported two weeks prior and contacts within the other setting
(contacts outside of the school, home and work) have increased by 7%.
Average contacts within the home and work setting have remained at
similar levels over the same period. Those aged under 40 have shown
the biggest increase in mean contacts in the last two weeks, increasing
by at least 33%. These increases are largely driven by contacts within
the school and work settings. Average contacts for those aged over 70
have also increased, although to a lesser extent (15%), which is
influenced by an increase in contacts within a school or other (contacts
outside of the school work or home) setting. The biggest increase in
interactions is seen with those aged between 18-39 with those aged
under 18 whereas those aged between 40-49 have reported the biggest
reductions in interactions with those under 18.Self-reported compliance with the current regulations and guidance has decreased since January but remains at a high level. On 29-30 June, 66% of people reported ‘complete’ or ‘almost complete’ compliance 14. Based on the recent increase in cases, infections, hospital beds and ICU are projected to rise – how long this continues for is uncertain (Figure 82). Following the recent increase in cases, projections of a continued growth in the epidemic in Scotland, are with considerable uncertainty as to what this means for future weeks. Figure 8. Medium term projections of modelled ICU bed demand, from Scottish Government modelling15. Vaccinations are continuing across the priority groups and 85.6% of the adult population in Scotland has now been vaccinated with the first dose6. The first vaccines were administered on Tuesday 8 December and 3,816,251 people had received their first dose by 1 July 2021, a 3% increase from 24 June3. By age group, almost 100% of individuals aged 55+, 94% of those aged 50-54, 89% of those aged 40-49, 78% of those aged 30-39 have received their first vaccination (Figure 9). 95% of the 14 Results are taken from questions run on behalf of Scottish Government on the YouGov online omnibus survey. The sample is demographically and geographically representative of adults 18+ across Scotland, with c.1000 responses each week. Fieldwork took place on 29-30 June with a total sample size of 1,001 adults. ‘Complete’ or ‘almost complete’ compliance refers to respondents who rated themselves 6 or 7 on a scale of 1-7 for the question: Thinking about ALL of the guidance on what to do and what not to do during the Coronavirus pandemic (including distancing, protection measures and all restrictions)...On a scale of 1-7, where 1 is 'Not at all' and 7 is 'Completely', to what extent do you feel you are following the regulations and guidance? 15 The difference between the Better and Worse scenarios: Both scenarios are based on current vaccine roll-out plans and efficacy assumptions. ‘Worse’ is based on a continuation in transmission rate from last week’s level. ‘Better’ is based on a reduction, falling to below the level from before last week’s increase, due to school holidays. In comparison to last week’s projections, the ‘Worse’ projection is lower and the ‘Better’ projection is higher. This is because we have more information and can therefore make a more precise estimate, narrowing the bounds of uncertainty somewhat. Nevertheless, the level of uncertainty remains high as we go into the summer holiday period
over 80s, 99% of those aged 75-79, 100% of those aged 70-74, 98% of
those aged 65-69, 99% of those aged 60-64, 95% of those aged 55-59
and 86% of those aged 50-54 have received their second dose. Overall,
2,722,725 people (61.2% of those aged 18 and over) had received their
second dose by 1 July6. There remains low levels of hospitalisations and
deaths among those groups vaccinated first (Figure 4).

Figure 9. Estimated percentage of adults vaccinated by 1 July 2021.
                                                                                                95%
     Age 80+                                                                                      99%
Age 75-79                                                                                          99%
                                                                                                    100%
Age 70-74                                                                                          100%
                                                                                                    100%
Age 65-69                                                                                         98%
                                                                                                    100%
Age 60-64                                                                                          99%
                                                                                                    100%
Age 55-59                                                                                      95%
                                                                                                    100%
Age 50-54                                                                              86%
                                                                                               94%
Age 40-49                                           43%
                                                                                          89%
Age 30-39                            26%
                                                                                 78%
Age 18-29                     18%
                                                             54%          2nd dose      1st dose
               0%   10%     20%      30%     40%      50%     60%      70%     80%     90%      100%

The proportion of people surveyed who said they would be likely to be
vaccinated for Covid-19 remains relatively high. 88% of all respondents
have already received at least their first vaccine dose. Of those not
vaccinated, 30% report they are likely to be vaccinated when a vaccine
becomes available to them 16.

How the virus is changing

The variant of concern Delta, also referred to as VOC-21APR-02 (first
identified in India) is spreading rapidly and has fast replaced Alpha
(VOC-20DEC-01, first identified in the UK) as the dominant strain in
Scotland, and 10,185 cases have now been sequenced as Delta to 30
June 2021.

16
   Total sample size on 29-30 June was 1,001 adults. Sample size for those who have not yet received their first
vaccine was 68 adults. ‘Likely’ to be vaccinated refers to respondents who rated themselves 8 to 10 on a scale of
0-10 for the question: How likely or unlikely are you to be vaccinated for COVID-19 when a vaccine becomes
available to you? (Please select a number between 0 and 10, where 0 means 'extremely unlikely' and 10 means
'extremely likely')
To date there are five ‘variants of concern’ (VOCs) and eight ‘variants
under investigation’ (VUIs)17. There is a concern that some of these new
variants may partially escape immunity, from both natural infection and
from vaccines currently being deployed, and we are monitoring the
evidence on this18 19 20. Up to 30 June there have been 55 genomically
confirmed cases of the variant Beta/VOC-20DEC-02 (first seen in South
Africa) in Scotland, no increase since last week. Genomically confirmed
cases of other VOCs and VUIs remains low, there have been no new
cases of VOCs or VUIs in the last week (Figure 10).
Figure 10. Variants detected in Scotland by sequencing (data up to 30
June and reported weekly21).
100000
10000
Cases, log scale
1000
100
10
1
25/01/2021
01/02/2021
08/02/2021
01/03/2021
08/03/2021
15/03/2021
22/03/2021
29/03/2021
05/04/2021
12/04/2021
19/04/2021
26/04/2021
03/05/2021
24/05/2021
31/05/2021
07/06/2021
14/06/2021
21/06/2021
28/06/2021
15/02/2021
22/02/2021
10/05/2021
17/05/2021
Date (up to)
Beta/VOC-20DEC-02 Zeta/VUI-21JAN-01 Gamma/VOC-21JAN-02
VUI-21FEB-01 VOC-21FEB-02 Eta/VUI-21FEB-03
VUI-21FEB-04 Theta/VUI-21MAR-02 Kappa/VUI-21APR-01
Delta/VOC-21APR-02 VUI-21APR-03 VUI-21MAY-01
VUI-21MAY-02 Alpha/VOC-20DEC-01
17
Variants: distribution of cases data - GOV.UK (www.gov.uk)
18
Brief note on SARS-CoV-2 variants (publishing.service.gov.uk)
19
Brief note on SARS-CoV-2 B.1.351 - 27 January 2021 (publishing.service.gov.uk)
20
Brief note on SARS-CoV-2 variant of concern P.1 (publishing.service.gov.uk)
21
Variants: distribution of cases data - GOV.UK (www.gov.uk)The Delta/VOC-21APR-02 variant is more transmissible than
Alpha/VOC-20DEC-0122 23 and R is currently estimated to be 40–80%
higher for delta than for alpha (B.1.1.7), although this is highly
uncertain24. The secondary attack rates for contacts of cases with
Delta/VOC-21APR-02 and no travel history are higher than those for
contacts of non-travel cases with Alpha/VOC-20DEC-0125. Public Health
England recent study shows that after a single dose there was an 14%
absolute reduction in vaccine effectiveness against symptomatic disease
with Delta compared to Alpha, and a smaller 10% reduction in
effectiveness after 2 doses26, which is in line with previous studies27.
Public Health England preliminary analysis also shows that vaccines
highly effective against hospitalisation from Delta variant 28 with similar
vaccine effectiveness against hospitalisation seen with the Alpha and
Delta variants29. EAVE II data from Scotland also shows that both the
Oxford–AstraZeneca and Pfizer–BioNTech COVID-19 vaccines are
effective in reducing the risk of SARS-CoV-2 infection and COVID-19
hospitalisation in people with the Delta variant, but these effects on
infection appeared to be diminished when compared to those with the
Alpha VOC30.
There remains uncertainty regarding the impact of the Delta variant on
severity of illness, treatment or reinfections. Updated Risk Assessment
for Delta variant suggests that vaccine effectiveness against
hospitalisation is maintained22. Current data from the EAVEII project
shows that compared to the Alpha variant, the Delta variant is
associated with an increase in the risk of Covid-19 hospitalisation in
Scotland by 85% (95% CI 39-147)31. As more data is analysed we shall
become more certain of the impact of Delta on hospitalisations and
disease severity.
22
S1236_Eighty-nineth_SAGE.pdf (publishing.service.gov.uk)
23
Risk assessment for SARS-CoV-2 variant: VOC-21APR-02 (B.1.617.2) (publishing.service.gov.uk)
24
S1284_SAGE_92_minutes.pdf (publishing.service.gov.uk)
25
SARS-CoV-2 variants of concern and variants under investigation (publishing.service.gov.uk)
26
COVID-19 vaccine surveillance report - week 26 (publishing.service.gov.uk)
27
COVID-19 vaccine surveillance report - week 23 (publishing.service.gov.uk)
28
Vaccines highly effective against hospitalisation from Delta variant - GOV.UK (www.gov.uk)
29
COVID-19 vaccine surveillance report - week 26 (publishing.service.gov.uk)
30
SARS-CoV-2 Delta VOC in Scotland: demographics, risk of hospital admission, and vaccine effectiveness -
The Lancet
31
SARS-CoV-2 Delta VOC in Scotland: demographics, risk of hospital admission, and vaccine effectiveness -
The LancetNext steps The Scottish Government continues to work closely with Public Health Scotland and modelling groups to monitor what happens following the high number of cases in Scotland this week and how this effects the course of the epidemic. Each week this report will provide an overview of the current Covid-19 situation in Scotland. This will include real time data on case rates, hospitalisations and deaths and how Scotland’s figures compare to those from the rest of the UK. Modelling can tell us where the epidemic is likely to be heading. Local data and data by age group can highlight where problems arise, which can help in addressing some of these issues. In the coming weeks the roll out of the vaccine will continue to be monitored along with the impact of this on case rates and deaths among different age cohorts. Investigations are ongoing by NERVTAG, SPI-M, SAGE, Public Health England and Public Health Scotland regarding the impact of new variants and of vaccination; this will be reflected here as work is undertaken.
This publication will be available in accessible HTML on the gov.scot website

© Crown copyright 2021
You may re-use this information (excluding logos and images) free of charge
in any format or medium, under the terms of the Open Government Licence.
To view this licence, visit http://www.nationalarchives.gov.uk/doc/open-
government-licence/ or e-mail: psi@nationalarchives.gsi.gov.uk.
Where we have identified any third party copyright information
you will need to obtain permission from the copyright holders concerned.

The views expressed in this report are those of the researcher and
do not necessarily represent those of the Scottish Government or
Scottish Ministers.

This document is also available from our website at www.gov.scot.
ISBN: 978-1-80201-132-6

The Scottish Government
St Andrew’s House
Edinburgh
EH1 3DG

Produced for
the Scottish Government
by APS Group Scotland
PPDAS900766 (07/21)
Published by
the Scottish Government,
July 2021

ISBN 978-1-80201-132-6

Web Publication

PPDAS900766 (07/21)
You can also read