QUANTIFYING THE IMPACT OF CLIMATE CHANGE ON EXTREME HEAT IN AUSTRALIA
←
→
Page content transcription
If your browser does not render page correctly, please read the page content below

QUANTIFYING
THE IMPACT
OF CLIMATE
CHANGE ON
EXTREME
HEAT IN
AUSTRALIA

The Climate Council is an independent, crowd-funded organisation
providing quality information on climate change to the Australian public.

CLIMATECOUNCIL.ORG.AU
Authorship:
Will Steffen
Published by the Climate Council of Australia Limited
ISBN:    978-0-9942453-1-1 (print)
         978-0-9942453-0-4 (web)
© Climate Council of Australia Ltd 2015
This work is copyright the Climate Council of Australia Ltd. All material
contained in this work is copyright the Climate Council of Australia Ltd
except where a third party source is indicated.
Climate Council of Australia Ltd copyright material is licensed under
the Creative Commons Attribution 3.0 Australia License. To view a
copy of this license visit http://creativecommons.org.au
You are free to copy, communicate and adapt the Climate Council of
Australia Ltd copyright material so long as you attribute the Climate
Council of Australia Ltd and the authors in the following manner:
Quantifying the impact of climate change on extreme heat in Australia
by Will Steffen (Climate Council of Australia).

© Climate Council of Australia Limited 2015.

Permission to use third party copyright content in this publication
can be sought from the relevant third party copyright owner/s.
This report is printed on 100% recycled paper.

                  Professor Will Steffen
                  Climate Councillor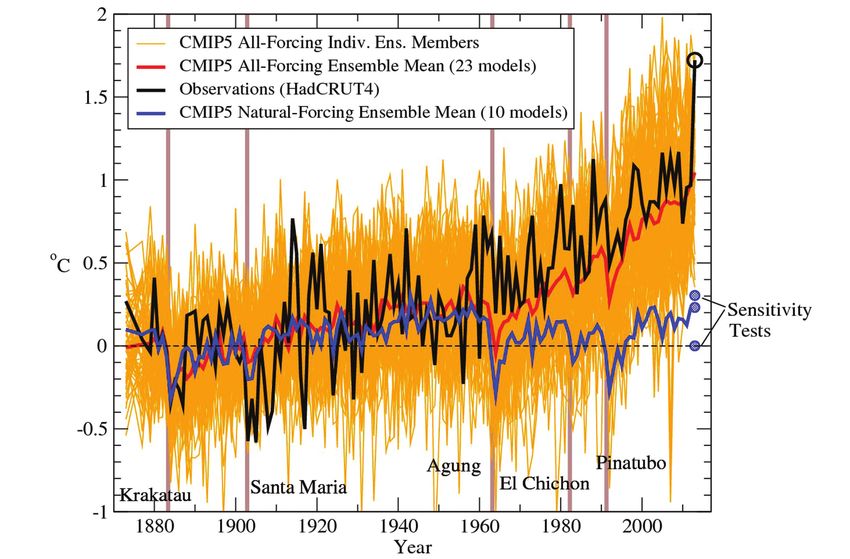
Key Findings
     1. Climate change is making                 2. While it has been clear for
        Australia hotter. Hot days are              many years that climate
        happening more often while                  change is a major factor in
        heatwaves are becoming                      intensifying heat, recent
        hotter, longer and more                     scientific advances now allow
        frequent.                                   us to understand the extent
       ›› The annual number of record hot
                                                    of the impact on individual
          days across Australia has doubled
                                                    extreme events. Climate
          since 1960. Over the past 10 years
                                                    change has significantly
          the number of record hot days
                                                    worsened recent extreme heat
          has occurred three times more
                                                    events in Australia.
          frequently than the number of            ›› The record hot year of 2013 in
          record cold days.                           Australia was virtually impossible
                                                      without climate change.
       ›› The annual occurrence of very hot
          days across Australia has increased      ›› Climate change tripled the
          strongly since 1950 and particularly        odds that the heatwaves of the
          sharply in the last 20 years.               2012/2013 Australian summer
                                                      would occur as frequently as
       ›› Over the 1950-2013 period many
                                                      they did.
          characteristics of heatwaves have
          changed across Australia. They           ›› Climate change doubled the odds
          are becoming hotter, lasting                that the 2012/2013 heatwaves
          longer, occurring more often                would be as intense as they were.
          and starting earlier.
                                                 3. The new research showing
       ›› All extreme heat events are now           the strong influence of
          occurring in an atmosphere that           climate change on heat
          is significantly hotter than it           events strengthens the case
          was 50 years ago.                         for strong action on climate
                                                    change.
                                                   ›› Carbon emissions must be reduced
                                                      rapidly and deeply if the worst of
                                                      extreme heat in the second half of
                                                      the century is to be avoided.
                                                   ›› Clean energy technologies
                                                      are advancing rapidly and
                                                      international action is ramping up,
                                                      building momentum towards a
                                                      decarbonised future.

CLIMATECOUNCIL.ORG.AU                                                                       Page 1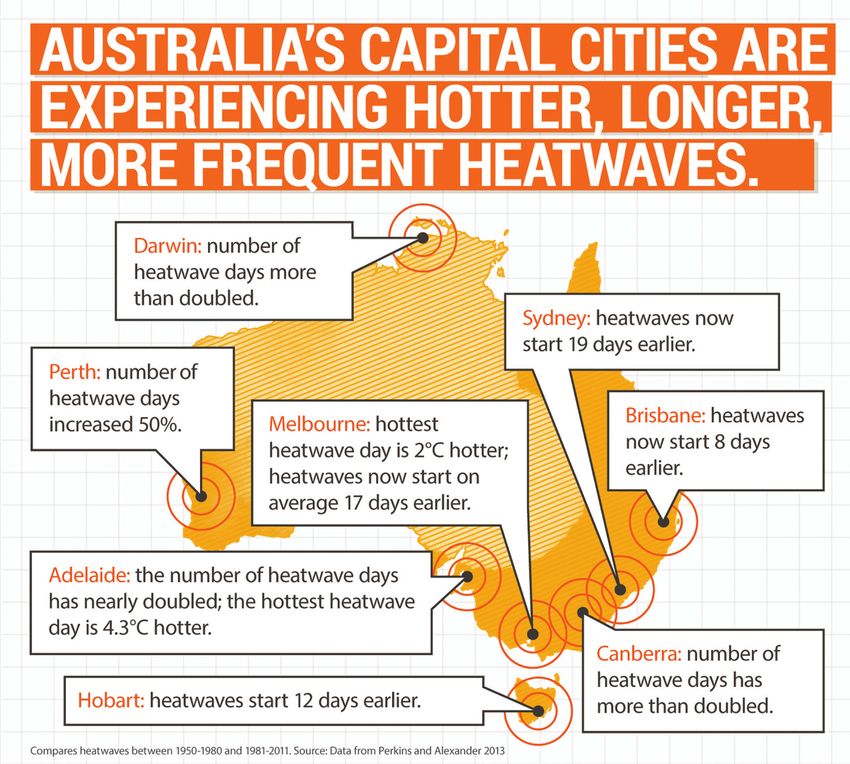
QUANTIFYING THE IMPACT OF CLIMATE CHANGE ON EXTREME HEAT IN AUSTRALIA

               1. Climate change
               and extreme heat
               New ground-breaking scientific research in
               2014 can now tell us just how much of an
               influence climate change has on a single
               heatwave or heat records.
               Climate change is increasing the                                For many years it has been clear that
               intensity and frequency of many                                 climate change is making Australia hotter.
               extreme weather events, with adverse                            Hot days are happening more often
               impacts on Australians. Extreme heat                            while heatwaves are becoming hotter,
               is one the most important of these                              longer and more frequent. However, new
               events. In fact, more Australians                               ground-breaking scientific research in
               die every year from extreme heat                                2014 can now tell us just how much of an
               than from any other type of natural                             influence climate change has on a single
               disaster. Extreme heat can damage                               heatwave or heat records. Understanding
               infrastructure such as electricity                              this shows us just how damaging climate
               distribution and transport systems,                             change has already become.
               while hot, dry conditions have a major
               influence on bushfires (Figure 1).

               More Australians die every year from extreme
               heat than from any other type of natural disaster

               Figure 1: Firefighters at work in Belrose, NSW. Hot, dry conditions have a major influence on bushfires in Australia.

  Page 2                                                                                              CLIMATECOUNCIL.ORG.AU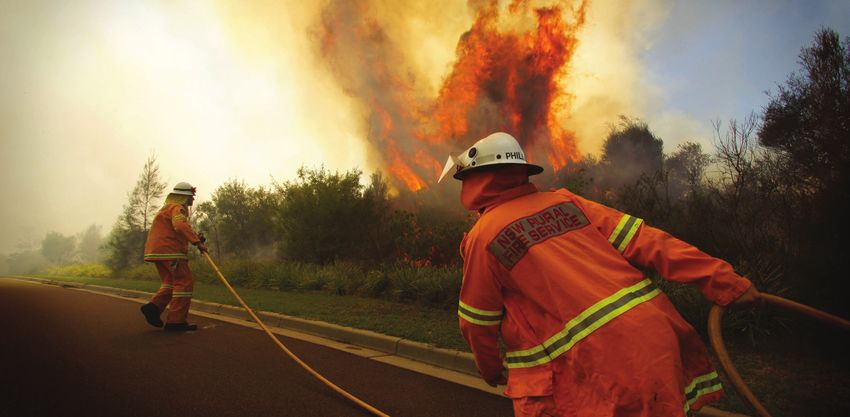
2. Observing long-
     term changes in
     extreme heat
     The recent research showing the                                 declined by a similar fraction (CSIRO
     strong influence of climate change                              and BoM 2012). Over the last decade,
     on individual heat events comes on                              hot weather records were set three
     top of an increasingly strong body of                           times more often than cold weather
     observations that clearly show the link                         records (Trewin and Smalley 2013). The
     between extreme heat and climate                                exceptionally large number of record
     change.                                                         high temperatures set during the Angry
                                                                     Summers of 2012/2013 and 2013/2014
     Climate change is stacking the odds
                                                                     are further evidence of this pronounced
     towards record heat. Record hot days
                                                                     trend (Climate Commission 2013;
     have doubled in Australia in the last
                                                                     Climate Council 2014a).
     50 years, while record cold days have

     Climate change is stacking the odds towards
     record heat. Record hot days have doubled in
     Australia in the last 50 years, while record cold
     days have declined by a similar fraction.

     Figure 2: The number of days each year where the Australian area-averaged daily mean temperature is above the 99th
     percentile for the period 1910-2013. The data are calculated from the number of days above the climatological 99th percentile
     for each month and then aggregated over the year. This metric reflects the spatial extend of extreme heat across the
     continent and its frequency. Half of these events have occurred in the past twenty years. Source: CSIRO and BoM 2014.

CLIMATECOUNCIL.ORG.AU                                                                                                                Page 3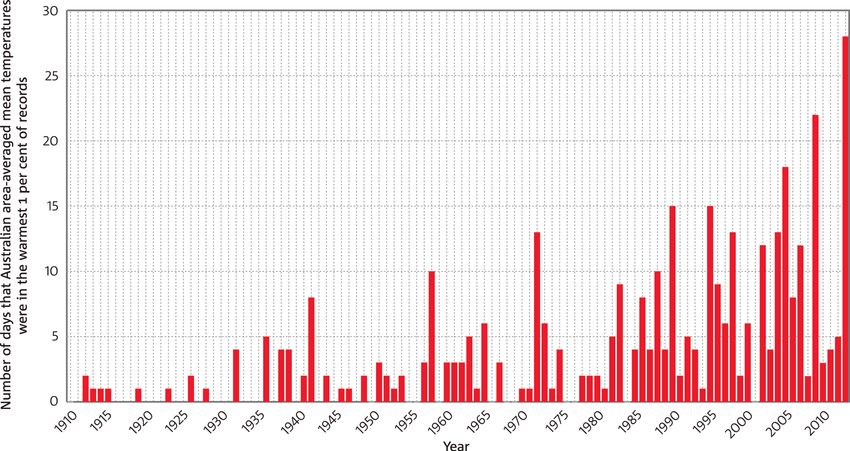
QUANTIFYING THE IMPACT OF CLIMATE CHANGE ON EXTREME HEAT IN AUSTRALIA

               As shown in Figure 2, days where                               ›› Heatwaves are occurring more
               extreme heat is widespread across                                 frequently in terms of the number of
               Australia has increased markedly over                             heatwave events per summer.
               the past century, especially after 1950
                                                                              ›› The duration of the longest yearly
               (CSIRO and BoM 2014). In fact, half
                                                                                 heatwave is increasing.
               of these extreme heat events have
               occurred in the last 20 years.                                 ›› The first heatwave in the season is
                                                                                 occurring earlier over almost all of
               Over the 1950-2013 period many
                                                                                 Australia.
               characteristics of heatwaves have
               changed across Australia (Perkins and                          ›› The hottest day in a heatwave – its
               Alexander 2013; Climate Council 2014b):                           peak - is becoming even hotter
                                                                                 over almost all of Australia below
               ›› The number of heatwave days has
                                                                                 the tropics.
                  increased over much of Australia,
                  particularly the eastern half.

               Figure 3: Australia’s capital cities are experiencing hotter, longer or more frequent heatwaves, based on a comparison of
               heatwaves during the 1950-1980 period with those during the 1980-2011 period

  Page 4                                                                                            CLIMATECOUNCIL.ORG.AU
Australia’s capital cities have already                         start 19 days earlier on and the number
           experienced hotter, longer or more                              of heatwave days has increased by 50%.
           frequent heatwaves (Figure 3). The                              In Adelaide the number of heatwave days
           average intensity of heatwaves in                               has nearly doubled while the average
           Melbourne is 1.5°C hotter and they occur                        intensity of heatwaves is 2.5°C hotter
           on average 17 days earlier than between                         (Table 1).
           1950 – 1980. In Sydney heatwaves now

Source: Climate Council 2014b

Table 1: The average number of heatwave days, number of events, length of the longest event, average heatwave intensity, average intensity of the peak
heatwave day, and change in the timing of the first summer heatwave for Australia’s capital cities (Perkins and Alexander 2013). Statistics were calculated
from the high-quality ACORN-SAT temperature dataset for the period 1951-2011 (Trewin 2013), using the Excess Heat Factor heatwave definition (Nairn
and Fawcett 2013; Perkins and Alexander 2013). All statistics are rounded to the nearest integer. The first column for each characteristic is for the 1950–1980
period and the second is for the 1981–2011 period. Changes in average intensity and peak intensity are calculated by subtracting the respective average from
1950–1980 and 1981–2011. Changes in timing are calculated by subtracting the average start date during 1981–2011 from that of 1950–1980.

CLIMATECOUNCIL.ORG.AU                                                                                                                         Page 5
QUANTIFYING THE IMPACT OF CLIMATE CHANGE ON EXTREME HEAT IN AUSTRALIA
3. How much of
an influence does
climate change have
on single heat events?
While climate change is already forcings and variability alone, as shown
increasing the intensity and likelihood in Figure 4. The increased temperatures
of hot days and heatwaves, recently resulting from climate change compared
scientists have been studying specific to the “natural only” climate model
heat events and asking: just how much of simulations allow scientists to calculate
an influence did climate change have? As the influence of climate change on
the following examples show, the answer specific events, such as the record hot
is that climate change has been a major year of 2013 in Australia, or our record
factor in recent heat events. heat in the spring of 2013 and in
September 2013.
Climate change has been a major factor in
recent heat events.
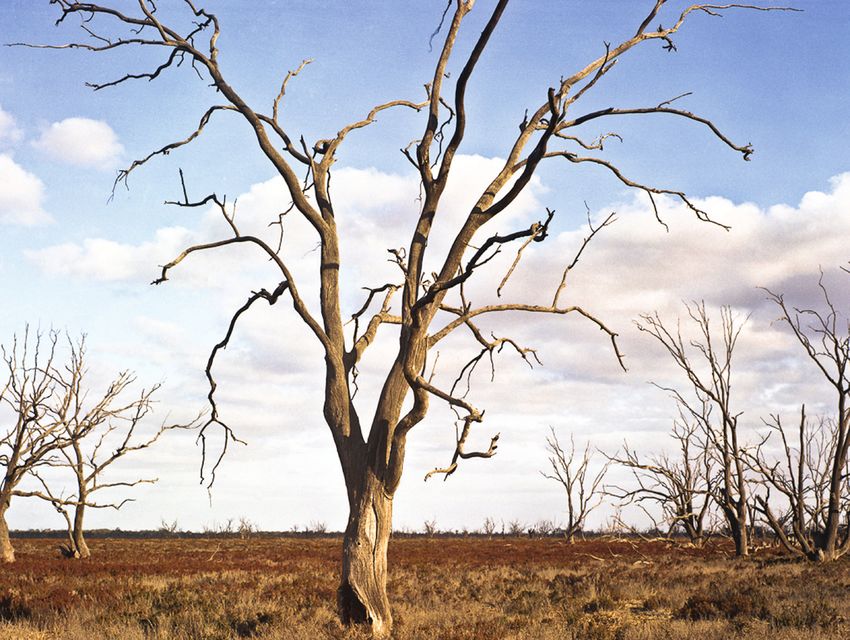
The most common approach to linking Figure 4 shows results of the simulations
individual heat events to climate by multiple climate models to test the
change is to mathematically analyse influence of greenhouse gases from
the likelihood that such events would human beings versus natural factors.
occur in the absence of the additional The blue line shows model simulations
greenhouse gases, primarily carbon of global temperature over the last 130
dioxide, in the atmosphere from human years with just natural factors. You can
activities. Scientists use state-of-the-art see that global temperature fluctuates
climate models to simulate temperature around zero degrees, indicating no long
changes due to the internal variability term warming. The dark red line shows
of the climate system and to natural what happens when greenhouse gases
forcings such as solar variability and emitted by humans are added to natural
aerosols from volcanoes. They then run factors in the model simulations. You
the climate models again, this time can see the steep increase in simulated
adding in the additional greenhouse temperature from the mid-20th century.
gases from human activities. The black line shows the temperature
trend that has actually been observed, so
As additional greenhouse gases
only when human-driven greenhouse
accumulate in the atmosphere, the
gases are added into the models does
simulated temperature trends begin
their simulated temperature trend
to diverge from those due to natural
Page 6 CLIMATECOUNCIL.ORG.AUclosely follow the temperature rise year in Australia? In only 1 year out of
we’ve actually experienced. over 12,300 years of model simulations
without human forcing was the 2005
The influence of climate change is often
record exceeded (Lewis and Karoly 2014).
expressed mathematically as “fraction
That is, without the human influence on
of attributable risk” (FAR) – the fraction
climate, the record temperature Australia
of risk of exceeding a particular climatic
experienced in 2013 would occur only
threshold that can be attributed to a
once in 12,300 years. So the FAR is
particular cause, in this case climate
effectively 100%; the 2013 record would
change. For example, what is the FAR
not have occurred in the absence of
due to climate change that 2013 would
climate change.
break the 2005 record for the hottest
Australia Region Annual Surface Temperature Anomalies Through 2013
Relative to 1881-1920 mean. CMIP5 Historical/RCP4.5 experiments
Figure 4: Times series of annual averaged surface temperature anomalies (oC) over Australia. The black curve depicts
the observed (HadCRUT4) anomalies; the dark red curve depicts the multi-model ensemble anomalies from the CMIP5
All-Forcing runs, while the blue line depicts the Natural Forcing-only runs. Each of the available models (23 for All-
Forcing and 10 for Natural Forcing-only) is weighted equally. The three blue circles labeled “Sensitivity Tests” depict low,
medium and high estimates of the Natural Forcing-only response for 2013. The All-Forcing simulations included both
anthropogenic and natural forcings from about 1860 to the present, with data from RCP4.5 runs used to extend the time
series through 2013 where necessary. All time series shown are adjusted to have zero mean over the period 1881-1920.
Source: Knutson et al. 2014.
CLIMATECOUNCIL.ORG.AU Page 7QUANTIFYING THE IMPACT OF CLIMATE CHANGE ON EXTREME HEAT IN AUSTRALIA
Without the human influence on climate, the
record temperature Australia experienced in
2013 would occur only once in 12,300 years
A similar approach by Knutson et al. three factors played significant roles,
(2014) comparing temperature trends and concluded that “…anthropogenic
from 1860 to the present (Figure 4) climate change played an important
yielded the same conclusion – the role in the record Australian maximum
record hot year of 2013 in Australia temperatures in September 2013”.
was virtually impossible without the
King et al. (2014) also explored the role
influence of climate change.
of severe drought along with climate
Other studies (Arblaster et al. 2014; change in driving the extreme heat of
King et al. 2014) explored several 2013 (Figure 5). They found that the
factors that could be implicated in extreme heat that much of Australia
the record-breaking 2013 heat events experienced in 2013 was made much
in Australia. One of these studies more likely by important contributions
The extreme heat that much of Australia
experienced in 2013 was made much more
likely by important contributions from both
climate change and very dry conditions
(Arblaster et al. 2014) used both long- from both climate change and the very
term observations and simulations dry conditions over the eastern inland
by a seasonal forecasting model to region of the continent. Their precise
examine the relative effects of natural results were (i) the risk of the record
variability, the unusually dry conditions 2013 heat exceeding a high temperature
in inland eastern Australia in 2013 threshold (they used 2002 as the
and the background warming due to threshold) is extremely likely to be 23
climate change on the record-breaking times greater now than in the late 19th
heat of 2013, especially in the spring century due to climate change; and (ii)
and in September. They found that all that the risk of extreme heat is 25 times
greater in dry years than wet years.
Page 8 CLIMATECOUNCIL.ORG.AUFigure 5: A parched landscape in South Australia in 2013. Research has found that severe drought along with climate
change played a role in the extreme heat of 2013.
The FAR approach has also been applied characteristics. The results showed that
by Perkins et al. (2014) to two heatwave there is a “calculable” human influence
characteristics – the total number of on the hot Australian summer of
heatwaves (frequency) and the hottest 2012/2013 in terms of both heatwave
heatwave day (intensity) – for the characteristics. The comparison of the
2012/2013 Australian summer. Their first and third time periods showed that
simulations compared three time periods the risk of increased frequency rose
(1955-83, 1955-2012 and 1984-2012) to 3-fold and the risk of increased intensity
explore the influence of human-driven 2-fold compared to a climate with
climate change on these heatwave no human forcing.
There is a “calculable” human influence on the
hot Australian summer of 2012/2013
CLIMATECOUNCIL.ORG.AU Page 9QUANTIFYING THE IMPACT OF CLIMATE CHANGE ON EXTREME HEAT IN AUSTRALIA
4. Without substantial
reductions in emissions,
climate change will
continue to exacerbate
extreme heat.
The trend toward more frequent and more
severe heatwaves in Australia is part of a larger
global trend which requires international
action on climate change.
All extreme weather events, including physics of the climate system points
extreme heat events, are now occurring towards an escalating risk of extreme
in an atmosphere that is significantly heat. Across Australia, 1-in-20 year
hotter than it was 50 years ago (Trenberth extreme hot days are expected to occur
and Fasullo 2012). The additional heat in every two to five years by the middle of
the atmosphere and surface ocean from the century (IPCC 2012); that is, extreme
human emissions of greenhouse gases hot days are expected to occur four to ten
drives up the risk of more intense heat times more often. Towards the end of the
and more frequent extreme heat events. century, the occurrence and intensity of
The trend toward more frequent and extreme heat will depend strongly on our
more severe heatwaves in Australia is part success, or not, in reducing greenhouse
of a larger global trend which requires gas emissions, mainly emissions of
international action on climate change. carbon dioxide. Without effective action
on climate change, today’s extreme heat
As even more greenhouse gases
will become commonplace, occurring
accumulate in the atmosphere over
every summer across the continent in the
the coming decades, the fundamental
last decade or two of this century.
Without effective action on climate change,
today’s extreme heat will become commonplace,
occurring every summer across the continent in
the last decade or two of this century
Page 10 CLIMATECOUNCIL.ORG.AU5. The need for
action to deal with
extreme heat
The evidence on the link between climate
change and extreme heat is stronger than
ever, and in fact is overwhelming
The evidence on the link between But there is good news on the horizon
climate change and extreme heat as we reach the halfway point of the
is stronger than ever, and in fact is Critical Decade in 2015. Clean energy
overwhelming. Whether one considers technologies, such as solar and wind,
the fundamental physics, the observed are advancing rapidly and are now
long-term trends in extreme heat, or competitive in price with fossil fuel
the new model- and observation-based technologies in many places (Citigroup
analyses of record years or individual 2013; IRENA 2014). International action is
events, the answer is absolutely clear. ramping up with stronger commitments
Extreme heat is becoming more frequent from the world’s two biggest emitters,
and more severe, and climate change is China and the USA. The challenge for
the primary reason. the second half of the decade is clear
– build on this momentum towards
The case for action is just as
a decarbonised future and ramp up
overwhelming. Carbon emissions will
action even further in the second half
need to be reduced rapidly and deeply,
of the decade. The UN Climate Summit
with most of the world’s economies
in Paris in December 2015 provides
essentially decarbonised by the middle
an opportunity for nations, including
of the century, if the climate system is
Australia, to increase their domestic
to be stabilised and the worst of extreme
action on climate change.
heat in the second half of the century
is to be avoided. Now, more than ever, we need action
on climate change.
CLIMATECOUNCIL.ORG.AU Page 11QUANTIFYING THE IMPACT OF CLIMATE CHANGE ON EXTREME HEAT IN AUSTRALIA
References
Arblaster JM, Lim E-P, Hendon HH, Trewin King AD, Karoly DJ, Donat MG and Alexander LV
BC, Wheeler MC, Liu G and Braganza K (2014) (2014) Climate change turns Australia’s 2013 Big
Understanding Australia’s hottest September on Dry into a year of record-breaking heat. Bulletin of
record. Bulletin of the American Meterological the American Meteorological Society 95(9): S41-S45.
Society 95(9): S37-S41.
Knutson TR, Zeng F and Wittenberg AT (2014)
Citigroup (2013) Energy Darwinism: The Evolution Multimodel assessment of extreme annual-mean
of the Energy Industry. Channell J, Jansen H, warm anomalies during 2013 over regions of
Syme A, Savvantidou S, Morse E and Yuen A. Australia and the western tropical Pacific. Bulletin
of the American Meteorological Society 95(9):
Climate Commission (2013) The Angry Summer. S26-S30.
Steffen W.
Lewis SC and Karoly DJ (2014) The role of
Climate Council (2014a) Angry Summer 2013/2014. anthropogenic forcing in the record 2013 Australia-
Accessed at http://www.climatecouncil.org.au/ wide annual and spring temperatures. Bulletin of
angry-summer. the American Meteorological Society 95(9): S31-S34.
Climate Council (2014b) Heatwaves: Hotter, longer, Nairn J and Fawcett R (2013) Defining Heatwaves:
more often. Steffen W, Hughes L and Perkins S. Heatwave defined as a heat-impact event servicing
Accessed at http://www.climatecouncil.org.au/uplo all community and business sectors in Australia.
ads/9901f6614a2cac7b2b888f55b4dff9cc.pdf. CAWCR Technical Report, No. 060. CSIRO and
CSIRO and BoM (2012) State of the Climate 2012. Australian Bureau of Meteorology, p 96.
CSIRO and Bureau of Meteorology, Melbourne. Perkins S and Alexander L (2013) On the
Accessed at http://www.csiro.au/Outcomes/ measurement of heat waves. Journal of Climate
Climate/Understanding/State-of-the-Climate-2012. 26:4500-4517.
aspx.
Perkins SE, Lewis SC, King AD and Alexander LV
CSIRO and BoM (2014) State of the Climate 2014. (2014) Increased simulated risk of the hot Australian
CSIRO and Bureau of Meteorology, Melbourne. summer of 2012/13 due to anthropogenic activity
Accessed at http://www.bom.gov.au/state-of-the- as measured by heat wave frequency and intensity.
climate/. Bulletin of the American Meteorological Society
IPCC (2012) Managing the Risks of Extreme 95(9): S34-S37.
Events and Disasters to Advance Climate Change Trenberth KE and Fasullo JT (2012) Climate
Adaptation. A Special Report of Working Groups I extremes and climate change: The Russian heat
and II of the Intergovernmental Panel on Climate wave and other climate extremes of 2010. Journal
Change. Field CB, Barros V, Stocker TF, Qin D, of Geophysical Research: Atmospheres 117:D17103.
Dokken D, Ebi KL, Mastrandrea MD, Mach KJ,
Plattner G-K, Allen SK, Tignor M and Midgley PM Trewin B (2013) A daily homogenized temperature
(eds.), Cambridge University Press, Cambridge and data set for Australia. International Journal of
New York, 582 pp. Climatology 33:1510-1529, doi: 10.1002/joc.3530.
IRENA (International Renewable Energy Agency) Trewin B and Smalley R (2013) Changes in extreme
(2014) Rethinking Energy. Accessed at http://www. temperatures in Australia, 1910 to 2011. In: 19th
irena.org/rethinking/. AMOS National Conference, Melbourne, pp 11-13.
Page 12 CLIMATECOUNCIL.ORG.AUImage Credits
Cover photo: “Fat Old Sun” by Flickr user
Harry Hoopman licensed under CC by 2.0
Page 2: Figure 1 “A hazard reduction
burn being conducted by the NSW RFS
in Belrose, 2011” by Flickr user NSW RFS
Media Services licensed under CC by –
NC-ND 2.0
Page 9: Figure 5 “Dead trees (10 year
drought)” by Flickr user Gary Sauer-
Thompson licensed under –NC –ND 2.0.
CLIMATECOUNCIL.ORG.AU Page 13You can also read