PROSPECTS AND CHALLENGES FOR THE CARRIBEAN - in the context of the New World Order - CEPAL
←
→
Page content transcription
If your browser does not render page correctly, please read the page content below
PROSPECTS AND CHALLENGES
       FOR THE CARRIBEAN
       in the context of the New World Order

        Amar Bhattacharya
Senior Fellow, Brookings Institution

                                May 2017

                                           0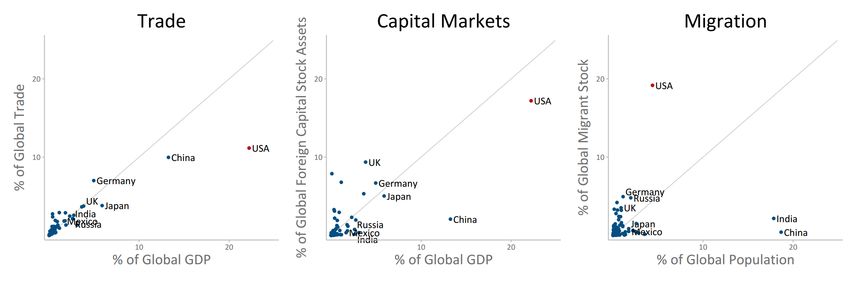
A New Global Agenda

•   2015 and 2016 breakthrough years for global collaboration around
    development and climate action. First shared global agenda since
    agreements after WW II.

•   Agenda for action has been set with agreements on:

    »   Financing for development in Addis (July 2015)

    »   Sustainable Development Goals (Sep 2015)

    »   Paris Agreement on Climate Change (CoP 21) (agreed Dec 2015,
        entered into force in Nov 2016; very rapid ratification)

    »   Kigali Amendment to the Montreal Protocol on HFCs (Oct 2016)

    »   New Urban Agenda (Oct 2016)

                                                                       1
The growth story of the future
• Growth, sustainable development, poverty reduction and climate change
are complementary and interwoven. (“Better Growth, Better Climate”, NCE,
2014; “Why are we Waiting?” MIT Press, Stern, 2015;“The Sustainable
Infrastructure Imperative”, NCE, 2016; “Delivering on Sustainable
Infrastructure for Better Development and Better Climate”; Bhattacharya et
al., 2016)
• Opportunity to:
» Boost shorter-run growth from increased investment in the low-carbon
transition (sustainable infrastructure);
» Spur innovation, creativity and growth in medium term;
» Provides the only feasible longer-run growth on offer.
• A growth story that delivers: alternative paths of economic development;
rising living standards; cities where we can move and breathe; stronger
communities; ecosystems that are more productive and resilient.
2Sustainable infrastructure is crucial to the story
Promote productive employment and End poverty in all its forms everywhere
decent work for all
End hunger and achieve food security
Promote resilient infrastructure, and improved nutrition
sustainable industrialization and
foster innovation Ensure healthy lives and
promote well-being for all
Reduce inequality
within and among Ensure quality education and
countries learning opportunities for all
Promote peaceful and Achieve gender equality
inclusive societies
SUSTAINABLE
INFRASTRUCTURE
Ensure availability of water
Revitalize the global and sanitation for all
partnership for sustainable
development Ensure access to
affordable and clean
energy for all
Promote sustainable use of Make cities and human settlements
terrestrial ecosystems Promotes resilient and sustainable
environmental
sustainability Ensure sustainable consumption
Conserve and sustainable use
of marine resources and production patterns
Take urgent action to combat
climate change and its impacts
3Next 10 to 20 years are of crucial importance
• Long-lasting infrastructure investments on scale will need to be made in our cities,
energy, water and transport systems all over the world:
» aging infrastructure in advanced economies will need repair and replacement.
» higher growth and growing weight of emerging/developing countries in global
economy.
» structural change in developing countries including rapid urbanisation from
around 3.5bn now (50% of 7+bn) to 6.5bn by 2050 (70% of 9+bn). Africa’s
population will double (from 1 billion to 2 billion).
• World economy likely to double in next 20 years or so, infrastructure will more than
double.
• Once in history transition.
• Altogether $80-$90 trillion in infrastructure investments will be required over
next 15 years - more than the current existing stock.
4Major Challenges in the new global order
1. Headwinds in the global economy
2. Rising inequality
3. The future of work
4. Uncertainties about the trajectory of globalization and
global governance
5. Threat of climate change
5Global GDP Levels (Index; 2007=100)
A compilation of historical data and projections for real GDP according to the W.E.O
210
190
170
150
130
110
90
2007 2008 2009 2010 2011 2012 2013 2014 2015 2016 2017 2018 2019 2020
World EMDEV AE
Source: Bhattacharya, IMF World Economic Outlook Database and Brookings staff calculations
Note: W.E.O = World Economic Outlook;. EMDEV = Emerging Markets and Developing Countries; AE = Advanced
Economies
6Global Trade vs Output (% Change)
A compilation of historical data and projections for real GDP according to the W.E.O
15
10
5
0
2007 2008 2009 2010 2011 2012 2013 2014 2015 2016 2017
-5
-10
Output (World) Trade Volume (World)
-15
Source: Bhattacharya, IMF World Economic Outlook Database and Brookings staff calculations
Note: W.E.O = World Economic Outlook;. EMDEV = Emerging Markets and Developing Countries; AE = Advanced
Economies
7Global Commodities Prices (Index; 2005 = 100)
A compilation of historical data and projections for prices according to the W.E.O
250
Energy Agricultural Raw Materials Metals
230
210
190
170
150
130
110
90
70
2005 2006 2007 2008 2009 2010 2011 2012 2013 2014 2015 2016 2017 2018
Source: Bhattacharya, IMF World Economic Outlook Database and Brookings staff calculations
Note: W.E.O = World Economic Outlook;. EMDEV = Emerging Markets and Developing Countries; AE = Advanced
Economies
8Global Total Investment (as a % of GDP)
A compilation of historical data and projections for GDP according to the W.E.O
35
33
31
29
27
% of GDP
25
23
21
19
Advanced economies
17
Emerging market and developing economies
15
1999 2001 2003 2005 2007 2009 2011 2013 2015 2017 2019 2021
Source: Bhattacharya, IMF World Economic Outlook Database and Brookings staff calculations
Note: W.E.O = World Economic Outlook;. EMDEV = Emerging Markets and Developing Countries; AE = Advanced
Economies
9Real GDP Levels (Index; 2007=100)
A compilation of historical data and projections for real GDP according to the W.E.O
180
170
160
150
140
130
120
110
100
90
2007 2008 2009 2010 2011 2012 2013 2014 2015 2016 2017 2018
CAPDR LAC CAR: Tourism Dependent CAR: Commodity-Exporters Emerging Markets and Developing Countries
Source: Bhattacharya, IMF World Economic Outlook Database and Brookings staff calculations
Note: W.E.O = World Economic Outlook; CAPDR = Central America and the Dominican Republic; LAC = Latin America and
the Caribbean; CAR= Caribbean Countries; Tourism Dependent countries = Antigua and Barbuda, The Bahamas, Barbados,
Dominica, Grenada, Jamaica, St. Kitts and Nevis, St. Lucia, and St. Vincent and Grenadines. Commodity Exporting countries
= Belize, Guyana, Suriname, and Trinidad and Tobago.
10Average Consumer Price (Percentage Change)
A compilation of historical data and projections for inflation according to the W.E.O
12
Latin America and Caribbean Caribbean (Commodity-Exporting) Caribbean (Tourism-Dependent)
10
8
6
4
2
0
2007 2008 2009 2010 2011 2012 2013 2014 2015 2016 2017 2018 2019 2020 2021 2022
-2
Source: Bhattacharya, IMF World Economic Outlook Database and Brookings staff calculations
Note: W.E.O = World Economic Outlook; Tourism Dependent countries = Antigua and Barbuda, The Bahamas, Barbados,
Dominica, Grenada, Jamaica, St. Kitts and Nevis, St. Lucia, and St. Vincent and Grenadines. Commodity Exporting countries
= Belize, Guyana, Suriname, and Trinidad and Tobago.
11Current Account Balance (% of GDP)
A compilation of historical data and projections for GDP according to the W.E.O
10
Commodity-Exporters
Tourism-Dependent
5
0
2007 2008 2009 2010 2011 2012 2013 2014 2015 2016 2017 2018
-5
-10
-15
-20
-25
Source: Bhattacharya, IMF World Economic Outlook Database and Brookings staff calculations
Note: W.E.O = World Economic Outlook; Tourism Dependent countries = Antigua and Barbuda, The Bahamas, Barbados,
Dominica, Grenada, Jamaica, St. Kitts and Nevis, St. Lucia, and St. Vincent and Grenadines. Commodity Exporting countries =
Belize, Guyana, Suriname, and Trinidad and Tobago.
12Fiscal Accounts (% of Fiscal Year GDP)
A compilation of historical data and projections for GDP according to the W.E.O
100 4
90 3
80 2
CE Primary Balance
70 1
60 0 TD Primary Balance
50 -1
Commodity Exporter
40 -2
Government Debt
30 -3
Tourism Dependent
20 -4 Goverment Debt
10 -5
0 -6
2007 2008 2009 2010 2011 2012 2013 2014 2015 2016 2017 2018
Source: Bhattacharya, IMF World Economic Outlook Database and Brookings staff calculations
Note: W.E.O = World Economic Outlook; Tourism Dependent countries = Antigua and Barbuda, The Bahamas, Barbados,
Dominica, Grenada, Jamaica, St. Kitts and Nevis, St. Lucia, and St. Vincent and Grenadines. Commodity Exporting countries =
Belize, Guyana, Suriname, and Trinidad and Tobago.
13Investment & Savings (% of GDP)
A compilation of historical data and projections for GDP according to the W.E.O
40
35
30
25
20
15
10
5
0
2007 2008 2009 2010 2011 2012 2013 2014 2015 2016 2017 2018
Investment (Commodity Exporters) Investment (Tourism Dependent)
Gross National Savings (Commodity Exporters) Gross National Savings (Tourism Dependent)
Source: Bhattacharya, IMF World Economic Outlook Database and Brookings staff calculations
Note: W.E.O = World Economic Outlook; Tourism Dependent countries = Antigua and Barbuda, The Bahamas, Barbados,
Dominica, Grenada, Jamaica, St. Kitts and Nevis, St. Lucia, and St. Vincent and Grenadines. Commodity Exporting countries =
Belize, Guyana, Suriname, and Trinidad and Tobago.
14Major Challenges in the new global order
1. Headwinds in the global economy
2. Rising inequality
3. The future of work
4. Uncertainties about the trajectory of globalization and
global governance
5. Threat of climate change
15Sources and impact of rising inequality
• Need to distinguish global inequality and its two components: inequality within
countries and inequality between countries.
• Over the past generation, between-country disparities fell, due to the fast growth
of emerging economies, even while inequality within several countries has risen.
The net effect has been a small reduction in recorded global inequality.
• Yet that would not quiet grievances about inequality. Global growth benefits have
accrued primarily to high earners in advanced economies along with the
expanding middle class in emerging economies, while the incomes of the
working class in advanced economies have stagnated. Their sense of being
shortchanged is increasingly recognized as a source of political instability.
• Since politics is organized principally around the nation state, it is the level and
change in inequality within countries that is the most potent source of tension
and debate.
• Nearly all developed economies have seen inequality rise over the past
generation. In most developing economies where recent data exist, inequality is
trending downward
16Major Challenges in the new global order
1. Headwinds in the global economy
2. Rising inequality
3. The future of work
4. Uncertainties about the trajectory of globalization and
global governance
5. Threat of climate change
17The future of work
• A rapid uptick in sales of robots, coinciding with breakthroughs in the capability
of machines and artificial intelligence in increasingly complex, non-routine tasks
such as driverless vehicles and semi-cognitive skills such as voice-recognition.
• Estimates on the share of jobs that are at risk of automation over the medium
term vary from 9 to 47 percent for OECD economies.
• The replacement of workers by machines poses a threat to developing
economies’ traditional comparative advantage in global markets—their surfeit of
cheap labor. Evidence of premature de-industrialization.
• At the same time, the digital economy provides opportunities to link workers in
poor economies with companies and customers in rich markets, thus offering a
temporary reprieve from the risks associated with labor-saving technologies
• In response to these trends need to develop education systems that will provide
digital and broad-based skills for the 21st century labor market demands.
• Modern and sustainable social-welfare systems including fully portable benefits.
• Strategies for managing migration.
18Major Challenges in the new global order
1. Headwinds in the global economy
2. Rising inequality
3. The future of work
4. Uncertainties about the trajectory of globalization and
global governance
5. Threat of climate change
19Globalization in retreat?
• Threat to globalization now comes from the center.
• Long-term trends in trade, capital and migration shows that the current
wave of globalization is deeper than the first.
• US actions unlikely to cause large reversals but adds major new
uncertainties with prospects for retaliation. Major impact could be on
migration.
• Countries may also repudiate global norms and institutions that
underpin the globalized economy.
• An erosion of multilateral institutions would be damaging for global
cooperation in key areas like trade and climate action and
development finance.
20Globalization trends, 1870-2015
A compilation of historical data and projections for GDP according to the W.E.O
35 3.5
30 3
25 2.5
% Global Population
20 2
% GDP
15 1.5
10 1
5 0.5
0 0
Merchandise Exports (% Global GDP) Foreign Capital Stock (% Developing World GDP) Migrant Stock (% Global GDP)
Source: Originally published in Brookings report by Laurence Chandy and Brina Siedel; based on IMF 2015, Lane and Milesi-Ferretti
2013, Maddison 2001, the Maddison Project 2015, McKeown 2004, McKeown 2010, Riley 2009, U.N. 1999, U.N. 2015a, U.N. 2015b,
UNCTAD 2015, U.S. Census Bureau 1975, World Bank 2015, World Bank 2016, and WTO 2016. Merchandise exports and foreign
capital stock are expressed in market dollars as a share of global income expressed in international dollars, and will therefore differ with
those cited elsewhere. 21Global shares of trade, capital markets, and migration
Source: Originally published in Brookings report by Laurence Chandy and Brina Siedel; Authors’ calculations based on Lane
and Milesi-Ferretti 2014, U.N. 2015a, and World Bank 2016. Capital stock assets include estimates of external debt, foreign
direct investment (FDI), and portfolio equity stocks..
22Major Challenges in the new global order
1. Headwinds in the global economy
2. Rising inequality
3. The future of work
4. Uncertainties about the trajectory of globalization and
global governance
5. Threat of climate change
23The Paris agreement
• Remarkable that 195 countries agreed. Foundation of agreement in
understanding of i) scale of risks ii) attractiveness of low-carbon paths as
sustainable routes to lasting development and overcoming poverty (no horse-
race between development and climate responsibility).
• This was based on anticipated risks rather than the grim experience that
drove Bretton Woods and other post-war collaborations; makes it all the more
remarkable.
• It agrees action to keep warming “well below 2oC” and “pursue efforts for
1.5oC”.
• Forms the basis of new, international, cooperative, long-term action on
climate change. New and shared sense of direction.
• Remarkable too that the agreement has been ratified faster than any other major
international agreement because of the leadership of major economies
especially China and the US.
• The Paris Agreement comes into force on November 4, less than 12 months
after the Paris meeting.
24The science underlying the Paris Agreement is clear
• Climate science is built on two centuries of theory and evidence.
• CO2e concentrations currently around 450ppm. At current rates (2.5 ppm
increase per year and rising compared with 0.5 ppm 70 years ago) will
reach 750 ppm by 2100 temp increases of 4°C or 5°C in global
average surface temperature above second-half of the 19th century.
• Stabilising temperatures requires stabilizing concentrations, i.e. net
zero emissions. The lower the target temperature, the earlier the
necessary achievement of net-zero.
• Necessary emissions path for 50-50 chance of 2°C:
– under 35Gt in 2030; under 20Gt in 2050; zero before end century.
• Can do a little more earlier and a little less later and vice versa but shape of
feasible paths similar, and costly to catch up if we postpone action (e.g.
sometimes find 40Gt for 2030 to reach 2°C).
25Ramping up
• The Paris Agreement recognises need to ramp up ambition and actions:
• Current pledges (NDCs)are around 55-60 GtCO2e per annum in 2030, an
improvement on BAU (ca. 65-68 GtCO2e per annum ).
• A 2°C path would require GHG emissions around 40 GtCO2e or less per annum
by 2030 (depends on assumed path thereafter).
• Recognises that gap; peaking of emissions must happen “as soon as possible”.
• Also recognizes that climate change requires significant investments in adaptation
especially in vulnerable countries.
• It agreed conventions on measurement and to meet every five years to look at
progress towards meeting NDCs with a view to enhancing levels of ambition.
• Will require actions, collaboration and commitment from many parties (countries,
cities, private sector and the MDBs.).
• Coming into force of the Paris agreement allows and requires focus on ramping up.
26The central role of fiscal policy
• All of these challenges in the new global order highlight the central role
of fiscal policy.
• Fiscal policy has a greater role to play in fostering sustainable and inclusive
growth. At the same time, the high degree of uncertainty as well as stretched
government balance sheets require a better understanding and management
of risks.
• Fiscal policy therefore has the difficult task of achieving more and better in a
more constrained environment (IMF Fiscal Monitor April 2017)
• Three key challenges: how to preserve countercyclical fiscal space; how to
support growth; and how to promote inclusion.
• For the Caribbean dealing with .debt overhang and coping with shocks are two
additional challenges requiring national and international actions.
27You can also read