Why gas flaring should be in the spotlight at COP26 - f - Capterio
←
→
Page content transcription
If your browser does not render page correctly, please read the page content below
Why gas flaring should be
    in the spotlight at COP26

f

     A thought piece by

       By John-Henry Charles and Mark Davis
            www.capterio.com/insights
                 22 February 2021

    1950 words, reading time 7 minutes 30 seconds.
WHY GAS FLARING SHOULD BE IN THE SPOTLIGHT AT COP26
Executive summary
• Gas flaring creates more emissions than the airline industry, yet much of
it can be solved technically and commercially. So-called “flare capture”
projects are, therefore, “low-hanging fruit” that reduce emissions, create
value and accelerate the energy transition.
• At COP21 in Paris in 2015, eleven countries made gas flaring a stated
commitment to their Paris NDCs (Nationally Determined Commitments).
Disappointingly, five years on, flaring has increased for these eleven
countries, by 6% to 60 Billion Cubic Metres (BCM) per year.
• Ambition without a plan is insufficient – and we need a more concerted
effort to reduce flaring over the next five years. Countries (and more than
just eleven in 2015) need to step up their ambition levels. But they also
need to deliver actual on-the-ground capture projects. Innovation in
policy, operational and financing models are required to accelerate
change – supported by clear political will.
• COP26 is the moment for governments to raise ambitions. Gas flaring
projects need to be appropriately included in the next round of
commitments and negotiations. After all, governments and national oil
companies are responsible for a disproportionate share of global gas
flaring. And these groups can provide the operating and regulatory
environment to accelerate flaring reduction.
• With the US re-joining the global compact and focusing on its own flaring
challenges, the world should again concentrate on flaring. This time at
COP26, we need bold commitments that actually get delivered. Delivery
will require strong political will, support and investment. And the best
way to ensure delivery happens is by putting flaring in the spotlight at
COP26.
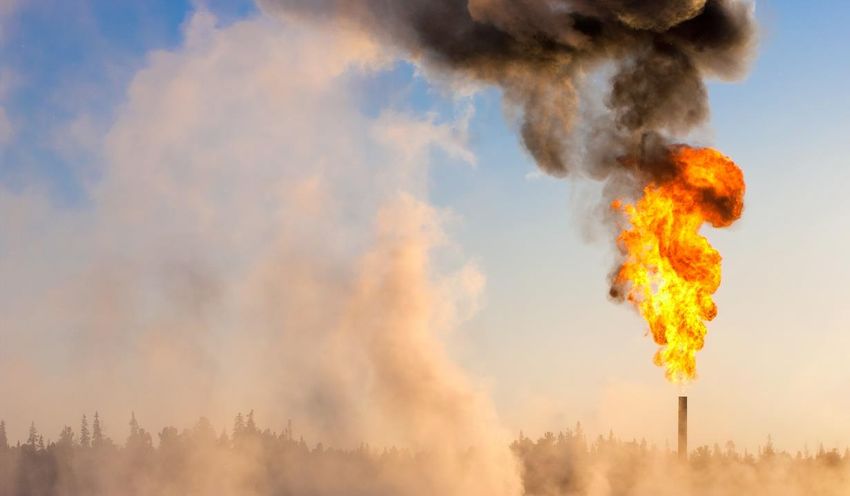
Why flaring matters
Gas flaring is a major source of economic and environmental waste. Globally, 150
Billion Cubic Metres (BCM) of gas is flared per year, according to the World Bank.
That’s large enough such that, if it were a country, “flaring” would be the 5th largest
gas-consuming country globally (after US, Russia, China and Iran).
Flaring also leads to an annual revenue loss of $20 billion and direct emissions of
280 million tonnes of CO2 per year. And when the “methane slip” (associated with
2
www.capterio.comWHY GAS FLARING SHOULD BE IN THE SPOTLIGHT AT COP26
incomplete combustion of flares) is included, the emissions from flaring rise to at
least 1.2 billion CO2-equivalent tonnes1. Now, that’s material, at 2% of the world’s
51 billion tonnes of CO2-equivalent emissions. And on top of gas flaring is also
venting and leaking/fugitive emissions (see “New data accelerates global call to
action”).
With emissions, therefore, equivalent to 1 to 1.5x that of airlines, it is perhaps
surprising that flaring doesn’t get more global attention. Especially so since
existing technologies can solve a chunk of the flaring challenge within a decade.
(For aviation, despite outstanding progress, battery and H2 technology are still a
way off).
Flaring and COP
At the COP21 in 2015, 194 states signed the Paris climate agreement and
committed to so-called National Determined Contributions (NDCs). Of these, 11
countries have made specific NDC contributions from flared gas utilisation – and
others refer to flare reduction in their LEDS (“long-term low greenhouse gas
emission development strategies”2).
We explore below the disappointing lack of global progress on flaring since 2015.
But we are also concerned that flaring may not get enough attention in the COP
process (which is one reason we’ve written this paper). We understand that in
today’s world, directing political capital to the oil and gas industry may be
unpopular or be seen to inconsistent with the direction of travel.
But, the world also would be wise to recognise that fossil fuel extraction will
probably be around for a couple of decades at least. Especially so since the most
robust oil suppliers (those with the lowest unit production cost) also tend to be
those with the highest rates of flaring. The Middle East, in particular (which is 40%
of the global challenge, see article), is likely to have an even more dominant role in
a world of lower oil demand and lower oil prices.
And if the economic and environmental loss of not “monetising every molecule”
(or providing reliable power) is not enough, exporters should be mindful that,
without addressing the carbon intensity issues, their gas (which is increasingly
under scrutiny for more aware consumers) will be uncompetitive.
1using the IPCC’s Global Warming Potential of methane being 84x that of CO2, over a 20-year basis.
2“Untapped ambition: addressing fossil fuel production through NDCs and LEDS”, June 2019; Stockholm
Environment Institute.
3
www.capterio.comWHY GAS FLARING SHOULD BE IN THE SPOTLIGHT AT COP26
Indeed, a recent Oxford paper3 noted: “it will be of paramount importance for … gas
producing countries to cut their emissions in the gas value chain, in order to preserve
their position and geopolitical influence … [otherwise their] role will shrink as [e.g.]
the European Green Deal is implemented”. We made a similar point in our article
“12 things the EU should do about gas flaring” and note the importance of
developing certification standards, such as those driven by MIQ.
Low-level flaring will always be required for safety reasons. Flaring is also an
acceptable outcome for unexpected operational challenges. But as long as
petrostates produce oil, they will also have clear economic and environmental
imperatives to end routine (i.e. continuous) flaring.
Taking stock of flaring since COP21 in Paris
So as the world prepares for COP26, it’s worth taking stock of the progress and
outlook for gas flaring reduction. So-called “flare capture projects” (that capture,
store and transport associated gas from oil production sites for power generation and
other productive uses are) should make a difference. A big difference: gas flaring
wastes the equivalent of 100 GW of continuous power (almost 900 TWh, 3% of all
power generated in 2019) and could displace up to 9% of all coal-generated power.
But data from the World Bank’s Global Gas Flaring Reduction (GGFR) programme4,
supplemented by Capterio’s proprietary “Global Flaring Intelligence Tool” (GFIT),
highlights that:
• Since the Paris agreement in 2015, global gas flaring has increased by 3%
from 146 BCM to 150 BCM in 2019. The cumulative waste is some $100
billion in lost potential revenue.
• The flaring from the 11 countries that specifically identified flaring as
a significant component of their NDCs has increased by 6%, from 56
BCM to BCM of gas (40% of the global total), meaning that we have made no
progress over this period, and these countries have performed worse than
the global average. Whilst this is particularly disappointing, the picture
varies by country in detail.
• More specifically, the gains seen from reductions in flaring in 3
countries are offset by increased flaring in 8 countries.
3 Raimondi and Tagliapietra, “The geopolitical implications of global decarbonisation for MENA producing
countries” in the latest quarterly journal on energy from the Oxford Institute for Energy Studies (Issue 26,
February 2021).
4 A Multi-Donor Trust Fund composed of governments, oil companies, and multilateral organizations
working to end routine gas flaring at oil production sites across the world, see
https://www.worldbank.org/en/programs/gasflaringreduction
4
www.capterio.comWHY GAS FLARING SHOULD BE IN THE SPOTLIGHT AT COP26
Over this period, Egypt, Gabon and Ecuador have reduced flaring by 1-5%
per year5. And as the figure shows, whilst the underlying liquids production
is lower in each country, the reduction in flaring is greater – therefore the
improvement is not simply due to a decrease in oil production. Rather, the
decreased flaring is also helped by a lower flaring intensity (flaring per unit
oil production), which may result from better underlying operational
performance.
Conversely, all other countries increased their flaring. All but Iraq also
increased their flaring by more than they increased their oil production –
meaning that their flaring intensity increased as their operations’
underlying performance has probably become poorer (and are in the red
sector). Flaring intensities have increased by 6.2% in Iran, by 3.3% in
Algeria, 3.2% in Nigeria and 3.1% in China, for example.
11 countries made flare reduction a key commitment at Paris – but their flaring
is up by 6% (as gains in 3 countries are offset by poorer performance in 8)
▪ Gas flaring is a key Total flaring is up 6% … but the improvements from 3 countries are offset by lower
source of economic BCM per year performance in 8 countries
waste +6% Change in flaring and flaring intensity 2015-2019 Change in
59.7 flaring intensity
4
Annualised change in liquids production (%)
▪ 11 countries made Bahrain 56.1 Iraq higher
Green sector: All 3 countries
explicit reference to Ecuador 2.1 3 that reduced flaring did so
2.3 lower
flare reduction from Gabon 2.0
through operational
“associated gas 2.6 improvement (as opposed to
China 2.8 2 simply lower production) Bubble size is
utilisation” in Saudi Arabia
2.4 flaring volume
7.7
their NDCs 1 in 2019
Egypt 7.6
Oman
− Algeria, Bahrain, 8.9 0
Nigeria Oman
China, Ecuador, 8.9 Ecuador
Egypt, Gabon, Iran, Algeria -1 Saudi Arabia
Iraq, Nigeria, Gabon
13.7 -2
Oman, Saudi Arabia Egypt
Iran 11.8 China Iran
Nigeria
-3
▪ However, the data
shows no aggregate -4 Algeria
change since Paris in 17.7
Iraq 16.0 Bahrain
2015 – and the
-5
improvements in 4
countries are offset -5 -4 -3 -2 -1 0 1 2 3 45
by poorer 2015 2019 Red sector: countries here have
Annualised change in flaring (%) increased flaring by more than
performance in 7
their liquids production – implying
Source: World Bank; EIA; Capterio analysis poorer operational performance
2
Figure: Illustration of the progress made by the 11 countries that specifically referenced flare gas
capture as a key contribution to their 2015 NDCs at Paris COP21. Despite their commitments
under Paris, these 11 countries have not delivered flared reduction in aggregate, rather flaring
has increased by 6%. In detail, the good progress by 3 countries is offset by the greater flaring
in 8.
5For clarity, we do not rule out the possibility that lower flaring is due to increased venting (which would,
of course be far worse for the environment, given the high potency of methane as a greenhouse gas.
5
www.capterio.comWHY GAS FLARING SHOULD BE IN THE SPOTLIGHT AT COP26
Countries need to make substantial flaring
reduction commitments at COP26
The good news is that our analysis has highlighted that many flare capture projects
not only reduce emissions (of CO2, and most significantly, of methane from
incomplete combustion) but also create value (see our paper “why flare capture
projects make sound ESG investments”).
We are working on a range of attractive and investable flare capture projects that have
intrinsically-investable Intrinsic Rates of Return (IRRs) in the 20-60% range, and each
reduces emissions by up to 1 million CO2-equivalent tonnes per year. These projects
also create much-needed governments revenues, can provide reliable power, create
jobs, reduce air pollution (and hence, save lives), improve countries’ investment
credentials and demonstrate international leadership.
But despite many projects are intrinsically attractive, not enough is happening. We
think this is mainly due to a “market” or “system” with the status quo. Our research
(see “how to fix flaring – survey results”) explored why and identified that flares are
still not sufficiently “on the radar” of operators and governments, there are “perceived
economic challenges” (some of which are just perceptions, and many can be solved
with agile approaches), and the industry has a “lack of (spare) resources”.
So, whilst the industry is facing the challenge of doing more (towards net-zero) with
less (fewer people and lower budgets), we need to rethink how we make flare
reduction happen. The good news is, the world can drive faster change if we:
• Improve focus on data and transparency. Flaring is highly visible, and the
data is in the public domain – so there is nowhere for producers to hide. Given
that what gets measured get bettered, operators and governments need to hold
each other to account to deliver action. RMI’s Climate Action Engine is one such
open-source tool that is already driving action. The companies and countries
that have joined the GGFR’s voluntary Zero Routine Flaring (by 2030) initiative
should be transparently reporting on the delivery of these commitments.
• Increase government commitment, enforced by capable regulators with
material incentives for flaring reduction. Norway has a particularly effective
combination of policy and financial penalties that has led to very low flaring
(see “lessons on flaring from the North Sea”). Russia and Nigeria, on the other
hand, have regulations which are largely unenforced.
• Unlock funding, speeding up the approval processes and ensure timely
execution of flare capture projects. Financing groups and regulators need to
streamline processes. Those international or multilateral finance groups that
6
www.capterio.comWHY GAS FLARING SHOULD BE IN THE SPOTLIGHT AT COP26
are committed to selectively investing in gas decarbonisation projects can play
a leadership role here.
• Promote new operating models to deliver scalable flare capture projects,
including innovative technologies or commercial structures. Developed
countries can provide technical assistance and know-how. Companies such as
Capterio bring technical solutions and funding (enabling flare capture projects
to be delivered without drawing on the operators’ limited budgets or scarce
technical skills). Algeria’s recent New Hydrocarbon Law helps to facilitate this
innovation.
• Ensure that buyers are empowered to choose between low- and high-
flaring sources of production, applying consumer pressure to upstream
operators. Players like MIQ (www.miq.org) are setting the standard for low
methane gas – and this transparency also needs to apply to flaring. Companies
and countries that do not deliver low flaring gas will find themselves
disadvantaged either on pricing or market access.
The above five recommendations are practical and straightforward. Taking the heat
out of flaring is not rocket science. But only by delivering on the above will we deliver
the 90% reduction in flaring by 2030 required for IEA’s Sustainable Development
Scenario (see article).
The prize is clear – and flare capture projects really do make sound ESG investments.
COP26 is the moment for governments to raise ambitions. COP26 should also be a
key milestone – if not a forcing mechanism – for real change. By focussing on this
issue now, with luck, the industry can showcase some ground-breaking flare capture
programmes in Glasgow in November. By materially upping the commitments and
showing a credible plan to deliver these commitments, countries with significant gas
flaring can show international leadership.
Let’s ensure that gas flaring (“the world’s 5th largest country”) is in the spotlight at
COP26.
Capterio would like to acknowledge many individuals from the World Bank, the Global
Gas Flaring Reduction (GGFR) programme, EBRD, IFC, OGCI, IEA, CCAC, MIQ, RMI, EDF,
the Payne Institute, the Colorado School of Mines, SYSTEMIQ and many IOC and NOC
companies and other institutions for many lively discussions which have contributed to
this paper. The views and any errors or omissions are, however, our own.
About Capterio: Capterio is an agile and specialist project developer focused on
monetising waste gas in oil & gas energy systems. We bring together assets with
technologies, know-how and financing to deliver on-the-ground, real-world, safe and
reliable solutions. We support our work with our unique Global Flaring Intelligence Tool
(GFIT), which provides real-time insights into flaring for every asset, operator and non-
operated partner worldwide.
7
www.capterio.comYou can also read