Effects of fuel cost and driving behaviors on operational costs of gasoline and electric vehicles in the US - IOPscience
←
→
Page content transcription
If your browser does not render page correctly, please read the page content below

ARTICLE • OPEN ACCESS

Effects of fuel cost and driving behaviors on operational costs of
gasoline and electric vehicles in the US
To cite this article: Isaac Schmidt and Emily Grubert 2021 IOPSciNotes 2 034001

View the article online for updates and enhancements.

                              This content was downloaded from IP address 46.4.80.155 on 13/07/2021 at 19:42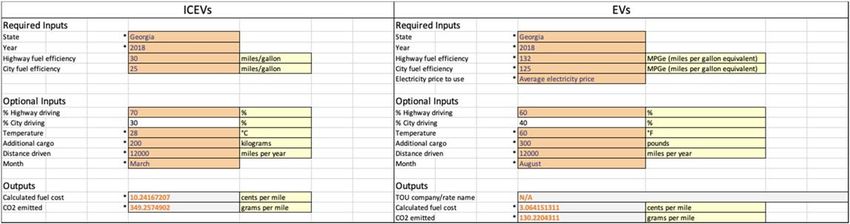
IOP SciNotes 2 (2021) 034001                                                                   https://doi.org/10.1088/2633-1357/ac10bd

                              ARTICLE

                              Effects of fuel cost and driving behaviors on operational costs of
OPEN ACCESS
                              gasoline and electric vehicles in the US
RECEIVED
9 May 2021
                              Isaac Schmidt and Emily Grubert∗
REVISED
                              School of Civil and Environmental Engineering, Georgia Institute of Technology, Atlanta, Georgia, United States of America
18 June 2021                  ∗
                                Author to whom any correspondence should be addressed.
ACCEPTED FOR PUBLICATION
1 July 2021                   E-mail: gruberte@gatech.edu
PUBLISHED
                              Keywords: electric vehicles, fuel cost, macro-energy systems, decarbonization, energy burden
12 July 2021
                              Supplementary material for this article is available online
Original content from this
work may be used under
the terms of the Creative
Commons Attribution 4.0       Abstract
licence.                      Internal combustion engine vehicles have long dominated personal vehicle sales in the United States.
Any further distribution of
this work must maintain
                              As electric vehicles gain market share, understanding fuel costs of gasoline versus electric vehicles
attribution to the            (EVs) is increasingly relevant for potential buyers and for researchers. In particular, understanding the
author(s) and the title of
the work, journal citation    influence of fuel price volatility on fuel costs is of interest. Although it is well known that fueling an EV
and DOI.
                              is cheaper than fueling a gasoline vehicle, costs are less commonly expressed in explicit spatially and
                              temporally resolved terms. This note presents an Excel model that includes state-specific gasoline and
                              residential electricity price data for US states between 2015–2020, including both average overall
                              electricity prices and lowest-cost time-of-use electricity rates (measured over a consecutive 8-hour
                              potential residential charging period) for each state. This model, which we call the Fuel Cost
                              Calculator, also allows users to evaluate the impact of several major external and driver behavior
                              factors on fuel costs for gasoline versus electric vehicles. These combinations of these factors result in
                              unique scenarios which make price differences for the fuel costs more variable. With the Fuel Cost
                              Calculator, the user can create specific scenarios reflecting potential real-world conditions to create
                              cost estimates for gasoline and residential EV fueling over user-determined time periods and distances.
                              Fuel costs for gasoline vehicles are generally higher than for electric vehicles in the US, consistent with
                              prior studies. We also explicitly show that fuel cost budgets are much more volatile for gasoline versus
                              electric vehicles charged at a residence, given the much less stable price of oil versus electricity. This
                              volatility is sufficiently large so as to be relevant for vehicle owner budgets. The FCC also shows carbon
                              dioxide (CO2) emissions associated with vehicle use, resolved at the state level.

                              Nomenclature
                              EV                  electric vehicle
                              FCC                 Fuel Cost Calculator
                              GHG                 greenhouse gas
                              ICEV                internal combustion engine vehicle
                              kWh                 kilowatt hour
                              MPG                 miles per gallon
                              MPGe                miles per gallon equivalent
                              TCO                 total cost of ownership
                              TOU                 time-of-use
                              US                  United States

                              © 2021 The Author(s). Published by IOP Publishing Ltd
IOP SciNotes 2 (2021) 034001 I Schmidt and E Grubert
Figure 1. Fuel Cost Calculator for ICEVs and EVs in the US, User Inputs.
1. Introduction
Today, there are roughly one million personal automobile EVs on the road in the US. By 2030, this number is
expected to reach almost 20 million, which would account for about 7% of vehicles on the road [1]. Many vehicle
manufacturers have already made plans to slow down or completely stop their production of ICEVs in the
future. For example, General Motors plans to end the sale of gasoline and diesel engine vehicles by 2035 [2], and
Volkswagen plans to have half of its US vehicle sales be EVs by 2030 [3]. EVs are rapidly gaining market share and
could become the dominant type of vehicles on the road within many of our lifetimes.
EVs are important because of their long term economic and environmental impacts [4]. Decarbonization is
one major motivation for vehicle electrification, particularly because EV GHG emissions decline as the grid
decarbonizes. Today, EVs are more expensive than ICEVs largely due to their batteries [5]. However, battery
prices have fallen rapidly and are expected to continue to fall [6], which could make EVs more affordable and
potentially cheaper than standard ICEVs.
As production costs of EVs approach the retail prices of ICEVs, fuel costs become more significant when
comparing life cycle costs of EVs and ICEVs. EVs are more energy-efficient since they proportionally convert
more energy from electricity to wheel power than ICEVs convert from gasoline. EVs can convert over 75% of the
electrical energy they consume to power at the wheels, while ICEVs can only convert 12%–30% of the energy in
gasoline [7]. This results in EVs having higher MPGe fuel efficiencies than ICEVs. Since EVs are more energy-
efficient, this results in cheaper fuel costs than ICEVs for a given travel distance. However, fuel costs do not
influence customers as much as TCO when deciding which vehicle to buy [8]. While some customers may not
recognize how fuel cost financially impacts the TCO, fuel costs play a significant role in TCO over the long
term [9].
External conditions and driving habits can affect the fuel efficiency of vehicles, with an impact on fuel costs.
External conditions include the year, month, state, and temperature. Driving habits are more specific to a given
user, such as additional cargo added or the split between highway and city driving. Combinations of all of these
factors can create scenarios that are unique to an individual, and can have an impact on the fuel costs associated
with driving a certain vehicle type.
One underinvestigated issue related to fuel costs for EVs versus ICEVs is that when EVs are charged with
electricity at residential rates, EV fuel costs are not only lower, but also much more predictable than ICEV fuel
costs, given that gasoline prices are far more volatile than electricity prices. They tend to fluctuate throughout the
year essentially unpredictably, which can make it difficult to budget for ICEV fuel costs. Electricity prices tend to
remain stable throughout the year, but general prices can vary depending on what type of payment plan the
customer is on. In most states, users can select a TOU electricity rate plan, which provides cheaper electricity
rates during certain ‘off-peak’ hours of the day. If the customer decides to charge their EV during these off-peak
hours, they can save even more money on fueling their vehicle. Some utilities even offer plans specifically for
electric vehicle owners, which can even further reduce the costs of fueling.
This note introduces a Fuel Cost Calculator (FCC) that compares the costs of gasoline and residential electric
vehicle fueling in the US, based on real fuel costs for 2015–2020, included as the Supplementary Information
(SI). The remainder of this note describes the FCC and potential applications.
2. Methods
The Fuel Cost Calculator is an Excel workbook that includes a user-manipulable input sheet, historical data, and
calculations. For this study, data were collected per state and per year (2015-2020) for average gasoline prices
[10], average retail kWh prices [11], and residential TOU rates and utility names [12] if available. Out of the 300
2IOP SciNotes 2 (2021) 034001 I Schmidt and E Grubert
Figure 2. Waterfall graph showing drivers of differences between costs under user input conditions and lowest-cost conditions.
residential TOU rates possible, 95 were not available for a specific state and year and could not be included in the
calculator. As the calculator includes example rates by state rather than utility for consistency with available
gasoline price data, states with multiple utilities with TOU use rates were assigned the utility and rate with the
lowest rate over at least eight consecutive hours of the day, based on an approximation of overnight residential
EV charging. These data are included in the SI on the sheet titled ‘Data’. Assumptions used in this study are listed
in the sheet titled ‘Assumptions’. Calculations are performed on a hidden sheet titled ‘Calculations.’ On the
‘Inputs & Outputs’ sheet (figure 1), users can adjust assumptions and compare estimated vehicle costs between
ICEVs and EVs, but also for selected versus lowest-cost conditions. Users are also able to select metric or US
customary units for data display. Although much of the model is locked to prevent accidental overriding of
formulas, there is no password.
Trends for factors that have an effect on the fuel costs of EVs and ICEVs were also researched and collected.
These factors include temperature changes [13–15], cargo added [16], and month [17, 18]. The calculator also
includes CO2 emissions factors per gallon of gasoline or per kWh by state, which allows one to see how their
driving conditions and vehicle type impact climate change [19, 20]. The FCC prioritized fuel cost drivers that are
measurable, have a meaningful impact on fuel efficiencies, and can be approximated relatively easily. There are
some factors that have an effect on fuel efficiencies but were excluded because they do not have a consistent,
meaningful effect or are hard to approximate. Examples of some excluded factors are rapid acceleration and
braking, driving with the windows down, driving with the air conditioning on, and driving on sloped surfaces.
While these factors all have effects on fuel efficiencies, they are hard to record and measure and/or would not
significantly affect the fuel efficiencies or fuel costs.
3IOP SciNotes 2 (2021) 034001 I Schmidt and E Grubert
Figure 3. Graph comparing the volatility of monthly fuel costs for ICEV and EV users in the United States from 2015 to 2020 based on
simple average fuel costs across states and default driving assumptions.
Each trend collected is convertible to a percent change in original fuel efficiency, all of which can be summed
to create a total percent change in fuel efficiency. This was used to calculate new fuel efficiencies for EVs and
ICEVs based on their inputted fuel efficiencies. The new fuel efficiencies and the selected gasoline or electricity
price for a given year and state allows for the calculation of fuel cost, given in a price per distance or price per time
format.
3. Products
The FCC enables the user to compare fuel costs and GHG impacts of EVs and ICEVs, assuming either residential
charging or gasoline fueling, by inputting specific driving conditions.
The required inputs for the FCC are state, year (2015-2020), highway fuel efficiency, and city fuel efficiency.
For ICEVs, the user must input fuel efficiency in units of MPG, and for EVs, the user can choose between units of
kWh/100 miles, miles/kWh, and MPGe. For EVs, the user is also required to select which electricity price to use,
being either the average residential kWh price or the cheapest standard/TOU electricity rate. Optional inputs for
the FCC include percentage split between highway and city driving, temperature (°F or °C), additional cargo
(pounds or kilograms), distance driven (miles/kilometers per year/month), and month. The outputs of the
FCC are fuel cost and CO2 emissions. The user has the option to display fuel cost in cents per mile, cents per
kilometer, or dollars per month (only if the user inputted a distance driven). CO2 emissions can be displayed in
grams per mile, grams per kilometer, and kilograms per month (only if the user inputted a distance driven).
Below the outputs, the FCC will display the ideal conditions for the cheapest fuel cost. Below that, there are
waterfall graphs showing the fuel cost under lowest-cost versus input conditions listed and in the units that the
user selected (figure 2).
The extensive historical data for US fuel costs (gasoline and electricity) by state for 2015–2020 also enables
users to construct estimates of monthly fuel budgets under various driving conditions. Figure 3 shows an average
expected monthly cost as an example.
4. Discussion
The FCC is an accessible Excel-based tool designed to enable users to easily evaluate the effect of variable fuel
pricing on fuel costs for ICEVs and EVs in the United States. The large number of spatially resolved, historical
fuel price time series in particular enables deep investigation of potential fuel costs. Researchers studying the
effects of specific conditions on the fuel costs of ICEVs and EVs can easily look at real-world historical fuel cost
data in the context of conditions they might be studying. Potential vehicle purchasers can use the FCC to
evaluate how their needs and behaviors might translate to fuel costs, enabling better budget planning. People
4IOP SciNotes 2 (2021) 034001 I Schmidt and E Grubert
preparing to move to another state can compare fuel costs in states side by side for either type of vehicle. Also,
users looking to become new vehicle owners can directly compare the fuel costs of ICEVs and EVs over the same
conditions, which can assist them in making the most holistic decision. One limitation is that we investigate
residential charging only, with potentially meaningful differences for those who cannot or do not charge at
home [21, 22].
Data availability statement
All data that support the findings of this study are included within the article (and any supplementary files).
ORCID iDs
Emily Grubert https://orcid.org/0000-0003-2196-7571
References
[1] Rudman K 2018 EEI Celebrates 1 Million Electric Vehicles on U.S. Roads Edison Electric Institute (https://eei.org/resourcesandmedia/
newsroom/Pages/Press%20Releases/EEI%20Celebrates%201%20Million%20Electric%20Vehicles%20on%20U-S-%
20Roads.aspx)
[2] Hirsch J 2021 GM Plans To Phase Out Gas And Diesel Cars By 2035 Forbes Wheels (https://forbes.com/wheels/news/gm-phase-out-
gas-diesel-cars-2035/)
[3] Beresford C 2021 VW Expands EV Offensive with Plans for Six Battery Factories Car And Driver (https://caranddriver.com/news/
a35840783/vw-plans-for-six-battery-factories/)
[4] Figenbaum E, Kolbenstvedt M and Elvebakk B 2014 Electric vehicles-environmental, economic and practical aspects. as seen by
current and potential users The Research Council of Norway Transnova 54–80 (https://toi.no/getfile.php/1337250-1411472277/
Publikasjoner/T%C3%98I%20rapporter/2014/1329-2014/1329-2014-el.pdf)
[5] Duffner F, Wentker M, Greenwood M and Leker J 2020 Battery cost modeling: a review and directions for future research Renew.
Sustain. Energy Rev. 127 109872
[6] Shankleman J 2017 Electric Cars Soon Will Cost Less Than Gasoline Autos, Research Shows IndustryWeek (https://industryweek.
com/technology-and-iiot/energy/article/22017905/electric-cars-soon-will-cost-less-than-gasoline-autos-research-shows#:~:
text=Research%20from%20Bloomberg%20New%20Energy,Europe%20as%20soon%20as%202025.&text=Battery%20powered%
20cars%20will%20soon,to%20drivers%2C%20new%20research%20shows)
[7] Miller M, Holmes A, Conlon B and Savagian P 2011 The GM ‘Voltec’ 4ET50 multi-mode electric transaxle SAE Int. J. Engines 4
1102–14 (https://sae.org/publications/technical-papers/content/2011-01-0887/)
[8] Dumortier J et al 2015 Effects of providing total cost of ownership information on consumers’ intent to purchase a hybrid or plug-in
electric vehicle Transportation Research Part A: Policy and Practice 72 71–82
[9] Weldon P, Morrissey P and O’Mahony M 2018 Long-term cost of ownership comparative analysis between electric vehicles and
internal combustion engine vehicles Sustainable Cities and Society 39 578–91
[10] GasBuddy 2021 Gas Price Charts GasBuddy (https://gasbuddy.com/charts)
[11] EIA 2020 State Electricity Profiles U.S. Energy Information Administration (https://eia.gov/electricity/state/archive/2018/)
[12] OpenEI 2021 U.S. Utility Rate Database Open Energy Information (https://openei.org/wiki/Main_Page)
[13] Oak Ridge National Laboratory 2019 Estimates of the effect of cold temperatures on conventional and hybrid vehicle fuel economy
[14] AAA 2019 AAA Electric Vehicle Range Testing American Automobile Association (https://aaa.com/AAA/common/AAR/files/AAA-
Electric-Vehicle-Range-Testing-Report.pdf)
[15] Lohse-Busch H et al 2013 Ambient temperature (20°F, 72°F and 95°F) impact on fuel and energy consumption for several conventional
vehicles, hybrid and plug-in hybrid electric vehicles and battery electric vehicle SAE Technical paper (https://sae.org/publications/
technical-papers/content/2013-01-1462/)
[16] Vehicle Technologies Office 2013 Gas Saving Tips U.S. Department of Energy | Energy Efficiency & Renewable Energy (https://afdc.
energy.gov/files/u/publication/gas-saving_tips_july_2013.pdf)
[17] EIA 2021 Weekly U.S. Regular All Formulations Retail Gasoline Prices (Dollars per Gallon) U.S. Energy Information Administration
(https://eia.gov/dnav/pet/hist/LeafHandler.ashx?n=PET&s=EMM_EPMR_PTE_NUS_DPG&f=W)
[18] EIA 2021 table 5.3. Average Price of Electricity to Ultimate Customers U.S. Energy Information Administration (https://eia.gov/
electricity/monthly/epm_table_grapher.php?t=epmt_5_03)
[19] EPA 2021 Greenhouse Gases Equivalencies Calculator - Calculations and References United States Environmental Protection Agency
(https://epa.gov/energy/greenhouse-gases-equivalencies-calculator-calculations-and-references#:~:text=In%20the%20preamble
%20to%20the,emissions%20per%20gallon%20of%20gasoline)
[20] EIA 2020 How much carbon dioxide is produced per kilowatthour of U.S. electricity generation?U.S. Energy Information
Administration (https://eia.gov/tools/faqs/faq.php?id=74&t=11)
[21] Lee J H, Chakraborty D, Hardman S J and Tal G 2020 Exploring electric vehicle charging patterns: mixed usage of charging
infrastructure Transportation Research Part D: Transport and Environment 79 102249
[22] Traut E J, Cherng T C, Hendrickson C and Michalek J J 2013 US residential charging potential for electric vehicles Transportation
Research Part D: Transport and Environment 25 139–45
5You can also read