Comparison of hydrogen and battery electric trucks - Methodology and underlying assumptions - Transport ...
←
→
Page content transcription
If your browser does not render page correctly, please read the page content below
Comparison of hydrogen and
battery electric trucks
Methodology and underlying assumptions
June 2020

                                         1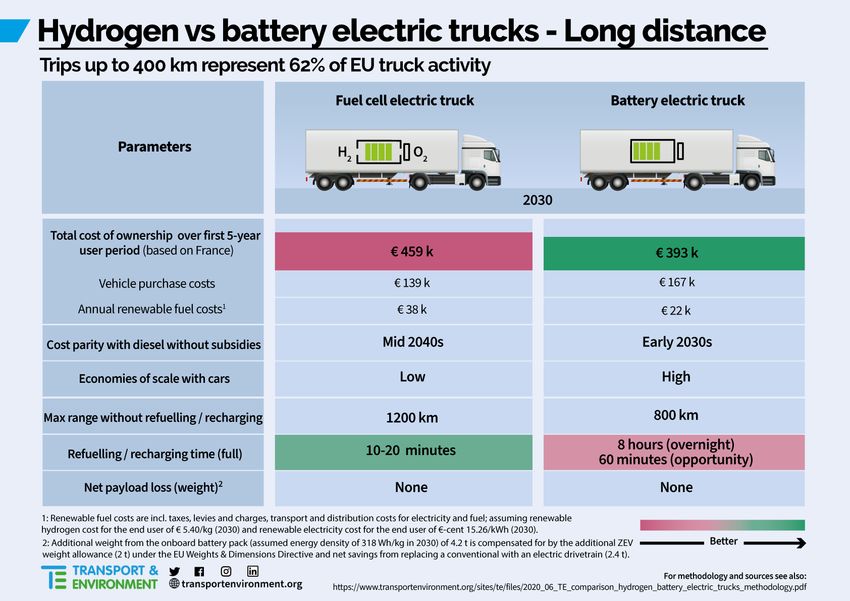
1. Vehicle characteristics
The sample vehicle for both the regional delivery and long-haul duty cycle is a typical tractor-trailer
under type-approval in the European Union. It has a gross combined vehicle weight (GCVW) of 40
tonnes, a vehicle curb weight of 14 tonnes and a resulting maximum payload of 26 tonnes. Both the fuel
cell electric (FCEV) as well as the battery electric vehicle (BEV) have an electric drivetrain with a
combined rated power output of 350 kW.

The FCEV features a fuel cell stack, compressed hydrogen storage tank and a smaller onboard battery
pack to buffer for engine peak loads. The BEV has a large onboard battery pack whose usable capacity
is capped at 80% to ensure long-term durability. The main criterion for determining the onboard energy
storage for the FCEV and BEV is that the respective vehicle reaches the required operational range
without the need for refuelling or recharging in between.

                                                                                                  2
The energy consumption values are based on Earl et al.1 They take into account vehicle efficiency
improvements due to reduced rolling resistance and aerodynamic drag on a 40-tonnes tractor-trailer
cruising at EU-specific highway speeds of 80 km/h (50 mph) and represent a reasonable mean value
between industry announcements and various literature sources. Moultak et al. and Sharpe estimate
an approximate energy demand at the wheels of 1.6 kWh/km in 2020 and 1.45 kWh/km in 2030 at a U.S.-
specific highway speed of 65 mph (105 km/h).2 , 3 Tesla has announced an energy consumption of its
Semi truck of ‘less than 1.24 kWh/km’ (also at 65 mph).4 The energy demand at the wheels is identical
for both the FCEV and BEV as they share the same vehicle characteristics and drivetrain components.
The efficiency differences between them is solely due to the additional conversion loss when converting
the hydrogen in the fuel cell to electricity (54% conversion efficiency rate in 2020 and 56% in 2030).5
Regional delivery Long-haul
Parameters FCEV BEV FCEV BEV
2020 2030 2020 2030 2030
Annual mileage 80,000 km 120,000 km
Energy consumption at 2.53 1.95 1.44 1.15 1.95 1.15
the wheels in kWh/kmi
Max. range without 400 km 1,200 km 800 km
refuelling / recharging
H2 fuel tank size 30 kg H2 23 kg H2 - 70 kg H2 -
(compressed at 700 bar)
Battery size (usable 70 kWh 720 kWh 575 kWh 70 kWh 1,150 kWh
capacity capped at 80%)
i
Energy consumption at the wheels determines the onboard energy storage capacity which is required to
reach the max. range without refuelling / recharging. To calculate the electricity consumption (i.e. fuel
costs) of the BEV, additional charging losses need to be taken into account. The respective energy
consumption values measured from the grid are 1.52 (2020) and 1.21 (2030).
32. Duty cycles
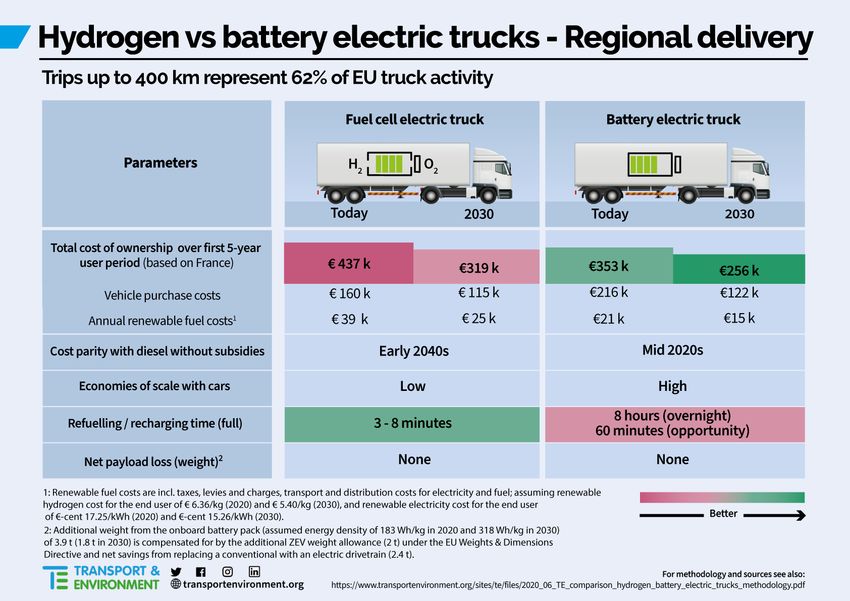
The regional delivery duty cycle is characterised by single trip lengths of up to 400 km and the vehicle's
return to the depot overnight which is located outside of urban areas. 62% of EU truck activity measured
(in tonne-kilometres) comprises trips of less than 400 km.6 The average annual mileage is set at 80,000
km based on the European Commission.7
The long-haul duty cycle involves multi-day intercity travel with maximum daily trip lengths of up to
800 km if the vehicle is equipped with one driver. The trip length is aligned with EU rules on driving
times and rest periods which foresee maximum daily driving periods of 9 hours (which can go up to 10
hours).8 At an 80 km/h average vehicle speed, this amounts to 800 km per day. 78% of EU truck activity
comprises trips of less than 800 km. The average annual mileage is set at 120,000 km also based on the
European Commission.9
3. Total cost of ownership
The total cost of ownership (TCO) comprises all vehicle costs, fuel costs, infrastructure costs as well as
all taxes, levies and road charges as they would occur if the vehicle was owned and operated in France.
The taxation schemes are somewhat different among the EU Member States and France represents a
good proxy among them in terms of tax and excise duty rates. In a broader sense, the TCO describes the
total expenses for a haulier. The TCO comprises nominal prices for a first vehicle use period of 5 years
(including the vehicle's residual value and excluding VAT and financing costs).
3.1. Vehicle costs
The vehicle costs are based on Kühnel et al. (except for battery costs) which undertook a bottom-up
cost estimation for the different vehicle components and included a mark-up factor of 1.4 to determine
the net retail price after manufacturing and distribution costs.10 The cost assumptions are based on the
German cost level. Since the price level and purchase power in the two countries are broadly similar,
the costs should be comparable.
The total net retail price (excl. VAT and financing costs) include the applicable costs due to the vehicle
glider, electric motor, inverter, gearbox, fuel cell stack, hydrogen storage tank and battery pack.
Maintenance and repair costs refer to costs due to general servicing over the first use period. The taxes
on vehicle purchase and operation include the French-specific one-time registration tax and additional
parafiscal charge as well as the annual special tax on certain motor vehicles.11
4Regional delivery Long-haul
Vehicle costs
2020 2030 2030
BEV Retail price € 215,795 € 122,432 € 167,274
Maintenance & repairs € 8,400 p.a. € 8,400 p.a. € 12,600 p.a.
Vehicle taxes € 573 p.a. € 573 p.a. € 573 p.a.
FCEV Retail price € 159,956 € 114,651 € 138,958
Maintenance & repairs € 15,400 p.a. € 10,960 p.a. € 16,440 p.a.
Vehicle taxes € 573 p.a. € 573 p.a. € 573 p.a.
The battery pack costs are based on BloombergNEF and include the same mark-up factor of 1.4 as for
the vehicle costs to determine the pack's retail price after manufacturing and distribution costs. 12 The
battery pack density values are the low assumptions on the potential for future technological
improvement taken by Ricardo Energy & Environment.13
Battery pack costs 2020 2030
Net costs per kWh € 135 € 56
Retail costs per kWh € 188 € 78
Energy density (battery pack level) 183 Wh/kg 318 Wh/kg
3.2. Renewable electricity and fuel costs
It should be noted that both the FCEV and BEV are fuelled with renewable hydrogen and renewable
electricity respectively. This has been a deliberate choice in order to provide for a level playing field and
compare two technologies which can ensure zero well-to-wheel GHG emissions (though not lifecycle
5GHG emissions). Depending on the electricity or fuel origin and production method, the TCO and the
moment of cost parity with diesel can vary significantly (see also section 3.5 below).
The Agora PtG/PtL calculator was used to calculate the levelised cost of electricity (LCOE) and the
levelised cost of hydrogen (LCOH) produced from additional renewable electricity capacity.14 The
electricity generation and fuel production facilities are either based in the North Sea or in North Africa.
The calculated costs are based on the reference scenario of the Agora PtG/PtL calculator. The chosen
weighted average cost of capital (WACC) is 6%. The renewable electricity for the BEV is produced from
offshore wind in the North Sea. The load factor was set at 4,000 full-load hours per year. Resulting in a
final renewable electricity price for the end user of €-cent 17.25/kWh (see table below) in 2020, this is
higher than the current average grid electricity price for non-household consumers of €-cent 12.71/kWh
in France.ii , 15
The renewable hydrogen is produced from solar PV in North Africa. The MENA region is considered to
provide for one of the most cost-effective means to produce hydrogen from renewable electricity
through electrolysis. The load factor was set at 2,344 full-load hours. The same is the case for the high-
temperature SOEC electrolysis (81% conversion efficiency rate in 2020 and 84% in 2030). Resulting in a
final renewable hydrogen for the end user of € 6.36/kg in 2020 (see table below), this is considerably
higher than today's fossil hydrogen final cost without CCUS (€ 1.83/kg) and with CCUS (€ 1.94/kg).iii , 16
Grid connection fees are included in the LCOE for renewable electricity. In addition, it includes the Tarif
d'utilisation du réseau public d'électricité (TURPE) to account for electricity network distribution costs
in France. The renewable hydrogen takes into account costs due to liquefaction, transport via tanker
from North Africa to France (Marseille) and domestic distribution via high-pressure tube trailer until the
refuelling station. For the renewable electricity, the Contribution tarifaire d'acheminement (CTA),
Contribution au Service Public d’Electricité (CSPE) and Taxes sur la Consommation Finale d’Electricité
(TCFE) is added. The current tax exemption for hydrogen used as transport propellant in France is
maintained.
ii
The electricity price for non-household consumers refers to an annual consumption between 20 and 500
MWh and including taxes except for VAT and other recoverable levies as of the second half of 2019.
iii
Based on fossil hydrogen production costs using natural gas in Europe with and without CCUS and
adding domestic distribution costs.
6Electricity produced €-cent/kWhel Hydrogen produced €/kgH2
from offshore wind in from solar PV in North
the North Sea 2020 2030 Africa 2020 2030
LCOE 9.22 7.23 LCOH 3.39 2.73
- - - Liquefaction 2.03 1.73
Transport to FR Grid connection fees Transport to FR 0.14 0.14
included in LCOE
Distribution in FR 4.40 4.40 Distribution in FR 0.80 0.80
Total 13.62 11.63 Total 6.36 5.40
Total incl. taxes & levies 17.25 15.26 Total incl. taxes & 6.36 5.40
levies
3.3. Infrastructure configurations and costs
The estimated infrastructure costs are also based on Kühnel et al.17 They take into account the size and
power of the refuelling and charging stations, the utilisation rate, service life, capital expenditure
(CAPEX), operational expenses (OPEX) and the number of supplied vehicles per refuelling / recharging
station. It should be noted that refuelling and recharging cost estimations are to an extent speculative
as the technologies are not yet (fully) commercialised or scaled up on the market.
Refuelling infrastructure for FCEVs
Parameters 2020 2030
Specifications of a Total refuelling capacity 5,468 kgH2
7hydrogen refuelling Mean refuelling quantity per vehicle 33 kgH2
station (disregarding vehicle duty cycle)
Dispenser flow rate 3.6 - 7.2 kgH2/min
Supplied vehicles per day 110
Service life 15 years
Capital expenditure € 7.0 million € 5.6 million
Operational expenses per year € 69,652 p.a. € 56,128 p.a.
Total infrastructure costs per vehicle per year (full utilisation) € 4,855 p.a. € 3,912 p.a.
Charging infrastructure for BEVs
Parameters 2020 2030
Specifications of a mega Charging time 60 minutes for 800 km range
charger for long-haul (1.2 MW)
Supplied vehicles per day 20
Service life 15 years
Capital expenditure - € 364,000
Operational expenses per year - € 3,640 p.a.
Specifications of a rapid Charging time 60 minutes for 400 km range
charger for regional delivery
(600 kW) Supplied vehicles per day 20
8Service life 15 years
Capital expenditure € 222,857 € 193,143
Operational expenses per year € 2,229 p.a. € 1,931 p.a.
Specifications of an overnight Charging time 8 hours for 800 km range
charger for long-haul (150 kW)
Supplied vehicles per night 0.91
Service life 15 years
Capital expenditure - € 65,000
Operational expenses per year - € 650 p.a.
Specifications of an overnight Charging time 8 hours for 400 km range
charger for regional delivery
(75 kW) Supplied vehicles per day 0.91
Service life 15 years
Capital expenditure € 42,000 € 35,000
Operational expenses per year € 420 p.a. € 350 p.a.
Total infrastructure costs per vehicle per year for long-haul - € 5,691 p.a.
(full utilisation)
Total infrastructure costs per vehicle per year for regional € 3,670 p.a. € 3,063 p.a.
delivery (full utilisation)
93.4. Road charges
In line with 2018 road charge estimations by the Comité National Routier, an average road toll cost of
€-cent 10.64 per vehicle kilometre driven was assumed for the long-haul duty cycle. For the regional
delivery cycle, a lower average road toll cost of €-cent 7.70 per vehicle kilometre driven was used.18 No
reduced charges or toll exemptions were applied to the FCEV or BEV compared to diesel vehicles.
Regional delivery Long-haul
Annual road charges
2020 2030 2030
BEV € 6,160 € 12,768
FCEV € 6,160 € 12,768
3.5. Fuel cost sensitivity
The estimated cost parity with diesel takes into account the above TCO cost components and compares
them to the equivalent vehicle with an internal combustion engine running on diesel in France. It should
be noted that this comparison excludes any potential subsidies or policy incentives for the FCEV or BEV
except for what is already provided for today (excise duty exemption for hydrogen). Today's level of
taxes, levies and charges in France remain the same and are kept constant until 2030.
The calculated cost parity is subject to greater or lesser variability, depending on the assumed costs,
their projections for the future and whether any potential subsidies are included. For example, carrying
out a cost sensitivity analysis by using fossil hydrogen with or without CCUS instead of renewable
hydrogen to fuel the vehicle would significantly improve the TCO and bring forward cost parity with
fossil diesel of both the regional delivery and long-haul FCEV to the early 2020s.19 Potential reductions
on road charges for ZEVs, as they are currently being discussed on EU-level or already implemented at
national level, would also bring forward the date when FCEVs and BEVs will become cheaper to own
and operate than diesel trucks.
104. Refuelling and recharging times
The refuelling and recharging times are based on the onboard storage configuration and the respective
refuelling capacity or recharging power output.
Recharging times are aligned with EU rules on driving times and rest periods. They foresee maximum
daily driving periods of 9 hours (10 hours in exceptional cases) and minimum resting periods of (at least)
9 hours.20 At an 80 km/h average vehicle speed, this amounts to a maximum of 800 km per day. In
addition, mandatory breaks of at least 30 minutes every four and a half hours are legally required. Based
on the above, one driver can therefore perform a single distance of not more than 360 km between
mandatory breaks. The high-power mega charger (1.2 MW) can charge a range of 400 km for the long-
haul BEV in around 30 minutes. Likewise, the high-power rapid charger (600 kW) can charge a range of
200 km for the regional delivery BEV in around 30 minutes. The overnight chargers (150 kW and 75 kW)
can fully charge the onboard battery of the regional and long-haul BEV in around 8 hours.
The range of the hydrogen dispenser flow rate is estimated to be between 3.6 and 7.2 kgH2 per minute
which ensures refuelling times of no more than 20 minutes if the onboard tank of the FCEV is completely
empty.21
5. Payload losses
It is often claimed that BEVs need to account for reduced payload capacity due to the significant weight
of the onboard battery pack. Depending on the battery pack's gravimetric energy density and capacity,
this can indeed be the case, particularly with respect to today's battery technology.
However, the additional weight due to the onboard battery pack (assumed energy density of 183 Wh/kg
in 2020 and 318 Wh/kg in 2030) is compensated for by the additional ZEV weight allowance (2 t) under
the EU Weights & Dimensions Directive and net savings from replacing a conventional with an electric
drivetrain (2.4 t). The illustrative calculation below outlines this for the long-haul BEV in 2030.
Parameter Formula Value Source
A Energy consumption at the wheels in 2030 1.15 kWh/km Earl et al. (2018)
B Nominal range 800 km Kühnel et al. (2018)
11C Usable battery capacity 80% Tesla (no date)
D Required battery pack size in 2030 AxB/C 1,150 kWh -
E Battery pack energy density in 2030 0.318 Ricardo Energy &
kWh/kg Environment (2019)
F Battery pack weight D/E 3,616 kg -
G Weight of electric motor, inverter and 600 kg Hall et al. (2019)22
gearbox
H Total weight of battery and electric engine F+G 4,216 kg -
I Weight of conventional drivetrain and fluids 3,000 kg Sharpe (2019)
in diesel tank
J Net additional weight of battery electric H-I 1,216 kg -
tractor-trailer
K Max. additional ZEV weight allowance under 2,000 kg European Union
the EU Weights & Dimensions Directive (2019)23
L Net payload loss of battery electric tractor- J-K - 784 kg -
trailer type-approved in the EU
Illustration based on Sharpe (2019)
Further information
Fedor Unterlohner
Freight & Investment Officer
Transport & Environment
fedor.unterlohner@transportenvironment.org
Mobile: +32 (0)485 63 94 92
12References
1
Earl et al. (2018). Analysis of long haul battery electric trucks in the EU. Marketplace and technology,
economic, environmental, and policy perspectives. Amended paper originally presented at the 8th
Commercial Vehicle Workshop in Graz, 17-18 May 2018. Retrieved from
https://www.transportenvironment.org/sites/te/files/publications/20180725_T%26E_Battery_Electric_Tru
cks_EU_FINAL.pdf, page 7.
2
Moultak et al. (2017). Transitioning to zero-emission heavy-duty freight vehicles. Retrieved from
https://theicct.org/sites/default/files/publications/Zero-emission-freight-trucks_ICCT-
whitepaper_26092017_vF.pdf
3
Sharpe (2018). Zero-emission tractor-trailers in Canada. Retrieved
fromhttps://theicct.org/sites/default/files/publications/ZETractorTrailers%20Working%20Paper042019.pd
f, page 3-4.
4
Tesla (no date). Tesla Semi. Retrieved from https://www.tesla.com/semi
5
National Research Council (2013). Transitions to Alternative Vehicles and Fuels, The National Academies
Press, Washington, DC/US, page 33. Retrieved from https://www.nap.edu/catalog/18264/transitions-to-
alternative-vehicles-andfuels, page 50.
6
Transport & Environment (forthcoming). T&E in-house analysis from an update of the ETISPLUS European
project database.
7
European Commission (2018). Annexes to the Proposal for a Regulation of the European Parliament and
of the Council setting CO2 emission performance standards for new heavy-duty vehicles. Retrieved from
https://eur-lex.europa.eu/resource.html?uri=cellar:f38df734-59da-11e8-ab41-
01aa75ed71a1.0001.02/DOC_2&format=PDF, page 6.
8
European Union (2019). Regulation (EU) 561/2006 of the European Parliament and of the Council.
Retrieved from https://eur-lex.europa.eu/resource.html?uri=cellar:5cf5ebde-d494-40eb-86a7-
2131294ccbd9.0005.02/DOC_1&format=PDF
9
European Commission (2018).
10
Kühnel et al. (2018). Oberleitungs-Lkw im Kontext weiterer Antriebs- und Energieversorgungsoptionen
für den Straßengüterfernverkehr. Ein Technologie- und Wirtschaftsvergleich. Retrieved from
https://www.oeko.de/fileadmin/oekodoc/StratON-O-Lkw-Technologievergleich-2018.pdf
11
ACEA (2019). ACEA tax guide 2019 edition. Retrieved from
https://www.acea.be/uploads/news_documents/ACEA_Tax_Guide_2019.pdf, page 86-97.
12
BloombergNEF (2019). Battery pack prices fall as market ramps up with market average at $ 156/kWh in
2019. Retrieved from https://about.bnef.com/blog/battery-pack-prices-fall-as-market-ramps-up-with-
market-average-at-156-kwh-in-2019/
13
Ricardo Energy & Environment (2019). Circular economy perspectives for the management of batteries
used in electric vehicles. Retrieved from
https://publications.jrc.ec.europa.eu/repository/bitstream/JRC117790/jrc117790_jrc_circular_econ_for_e
v_batterie s_ricardo2019_final_report_pubsy_online.pdf, page 248.
14
Agora Energiewende (2018). PtG/PtL calculator. Retrieved from https://www.agora-
energiewende.de/en/publications/ptgptl-calculator/
1315
Eurostat (2017). ‘Electricity prices for non-household consumers - bi-annual data (from 2007 onwards)’.
Retrieved from https://ec.europa.eu/eurostat/web/energy/data/database.
16
International Energy Agency (2019). The Future of Hydrogen. Seizing today’s opportunities. Retrieved
from https://www.iea.org/reports/the-future-of-hydrogen; 2018 currency exchange rate is taken from
European Central Bank (2018). Euro reference exchange rate: US dollar (USD). Retrieved from
https://www.ecb.europa.eu/stats/policy_and_exchange_rates/euro_reference_exchange_rates/html/euro
fxref-graph-usd.en.html
17
Kühnel et al. (2018).
18
Comité National Routier (2019). Enquête CNR longue Distance. Retrieved from
http://www.cnr.fr/fr/Publications-CNR/Enquete-CNR-longue-Distance-2018, page 11.
19
International Energy Agency (2019).
20
European Union (2006). Regulation (EU) 561/2006 of the European Parliament and of the Council.
Retrieved from https://eur-lex.europa.eu/resource.html?uri=cellar:5cf5ebde-d494-40eb-86a7-
2131294ccbd9.0005.02/DOC_1&format=PDF
21
U.S. Department of Energy (2018). Hydrogen Refueling Analysis of Fuel Cell Heavy-Duty Vehicles Fleet.
Retrieved from https://www.energy.gov/sites/prod/files/2018/08/f54/fcto-truck-workshop-2018-9-
elgowainy.pdf, page 7.
22
Hall et al. (2019). Estimating the infrastructure needs and costs for the launch of zero-emission trucks.
Retrieved from
https://theicct.org/sites/default/files/publications/ICCT_EV_HDVs_Infrastructure_20190809.pdf, page 19.
23
European Union (2019). Regulation (EU) 2019/1242 of the European Parliament and of the Council.
Retrieved from https://eur-lex.europa.eu/legal-content/EN/TXT/PDF/?uri=CELEX:32019R1242&from=EN
14You can also read