Investors Presentation - June 2019 - SGX

Page created by Michael Barnett
 
CONTINUE READING
Investors Presentation - June 2019 - SGX
Investors Presentation
June 2019
Investors Presentation - June 2019 - SGX
Disclaimer
This presentation shall be read in conjunction with A-HTRUST’s Annual Report for the financial year ended
31 March 2019 (“FY2018/19”), and Unaudited Financial Results for the Fourth Quarter ended 31 March
2019 (“4Q FY2018/19”), copies of which are available on www.sgx.com or www.a-htrust.com.

This presentation may contain forward-looking statements that involve risks and uncertainties. Actual
future performance, outcomes and results may differ materially from those expressed in forward-looking
statements as a result of a number of risks, uncertainties and assumptions. Representative examples of
these factors include (without limitation) general industry and economic conditions, interest rate trends
and foreign exchange rate trends, cost of capital and capital availability, competition from similar
developments, shifts in expected levels of average daily room rates and occupancy, changes in operating
expenses, including employee wages, benefits and training, property expenses and governmental and
public policy changes and the continued availability of financing in the amounts and the terms necessary
to support future business. Investors are cautioned not to place undue reliance on these forward looking
statements, which are based on the Managers’ current view of future events.

The Australian Dollar, Chinese Renminbi, Japanese Yen, Korean Won and Singapore Dollar are defined
herein as “AUD”, “RMB”, “JPY”, “KRW” and “SGD” or “S$”, respectively.

Any discrepancies in the figures included herein between the individual amounts and total thereof are
due to rounding.

                                                                                                       2
Investors Presentation - June 2019 - SGX
CONTENTS
1. Overview of A-HTRUST
2. Strategies
3. Financial Performance
Appendix
• 4Q FY2018/19 Results
• Portfolio Summary
• Acquisitions in 2018
Investors Presentation - June 2019 - SGX
1
Overview of A-HTRUST
Investors Presentation - June 2019 - SGX
Overview of Ascendas Hospitality Trust

  S$1,023 million
  Market capitalisation
  as at 31 May 2019

                                                                                       SEOUL
  S$1,822 billion                                            • The Splaisir Seoul Dongdaemun   TOKYO
  Portfolio valuation                                       • ibis Ambassador Seoul Insadong   • Hotel Sunroute Ariake
  as at 31 March 20191                                                                         OSAKA
                                                                                               • Hotel Sunroute Osaka Namba
                                                                                               • Hotel WBF Kitasemba West
  14                                                                                           • Hotel WBF Kitasemba East
  Hotels                                                                                       • Hotel WBF Honmachi

  4,744                                                               SINGAPORE
  Rooms
                                                         • Park Hotel Clarke Quay
                                                                                                BRISBANE
  4                                                                                             • Pullman & Mercure Brisbane King George Square
  Countries                                                                                     SYDNEY
                                                                                                • Pullman Sydney Hyde Park
                                                                                                • Novotel Sydney Central
  7                                                                                             • Novotel Sydney Parramatta
  Cities                                                                                        • Courtyard by Marriott Sydney-North Ryde
                                                                                                MELBOURNE
                                                                                                • Pullman & Mercure Melbourne Albert Park

1. Based on A-HTRUST’s interest in each of the hotels.

                                                                                                                                        5
Investors Presentation - June 2019 - SGX
Unique Structure
                                                                Stapled Securityholders

 Perpetual (Asia) Limited
 (Trustee of A-HREIT)                   Ascendas Hospitality                                                                   Ascendas Hospitality
                                                                         Stapling       Ascendas Hospitality
                                        Real Estate Investment                                                                 Trust Management Pte.
                                                                           Deed         Business Trust
                                        Trust                                                                                  Ltd.
 Ascendas Hospitality Fund                                                              (A-HBT)                                (Trustee-Manager of A-HBT)
                                        (A-HREIT)
 Management Pte. Ltd.
 (Manager of A-HREIT)

                    Park Hotel Clarke          Hotel Sunroute                       Pullman Sydney            Novotel Sydney            Novotel Sydney
                    Quay                       Ariake                               Hyde Park                 Central                   Parramatta

                                                                                                              Pullman and               Pullman and
                    Hotel WBF                  Hotel WBF                            Courtyard by Marriot
                                                                                                              Mercure Melbourne         Mercure Brisbane
                    Kitasemba East             Kitasemba West                       Sydney - North Ryde
                                                                                                              Albert Park               King George Square

                    Hotel WBF                                                       Hotel Sunroute            The Splaisir Seoul        Ibis Ambassador
                    Honmachi                                                        Osaka Namba               Dongdaemun                Seoul Insadong

                                                                   A-HREIT          A-HBT
Primarily hotels with master lease arrangement as A-HREIT is subject to 10%         Primarily hotels with management contract where A-HBT undertake active
                           limit on non-passive income under the regulation         operation by entering into hotel management contract with an operator

                                                                                                                                                            6
Investors Presentation - June 2019 - SGX
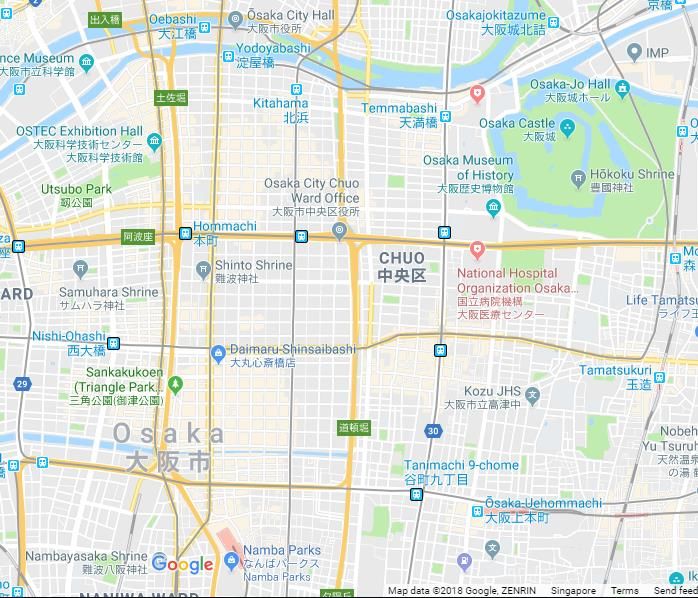
Strength in diversity

                        1. Geography

             3. Hotel
           segments &
            Operators
                                       2. Income
                                        Stream

                                                   7
Investors Presentation - June 2019 - SGX
Well diversified portfolio mitigates concentration risks
                                                                 AUSTRALIA                                         33.6%
                                                                 Pullman Sydney Hyde Park                           8.6%
                            Tokyo                                Novotel Sydney Central                             8.8%
                            17.8%                                Novotel Sydney Parramatta                          2.4%
                                                                 Courtyard by Marriott Sydney-North Ryde            2.9%
                                                    Osaka        Pullman and Mercure Melbourne Albert Park          6.0%
                                                    20.3%
                                                                 Pullman and Mercure Brisbane King George Square    4.9%
       Sydney               Portfolio
       22.7%             Valuation as at                         JAPAN                                             38.1%
                          31 Mar 2019:                           Hotel Sunroute Ariake                             17.8%
                          S$1,822.5 m1                Seoul      Hotel Sunroute Osaka Namba                        13.2%
                                                      10.5%      Hotel WBF Kitasemba East                           2.4%
           Melbourne
             6.0%
                                                                 Hotel WBF Kitasemba West                           2.4%
                Brisbane           Singapore                     Hotel WBF Honmachi                                 2.4%
                  4.9%               17.8%
                                                                 SOUTH KOREA                                       10.5%
                                                                 The Splaisir Seoul Dongdaemun                      5.1%
                                                                 ibis Ambassador Seoul Insadong                     5.3%

                   Australia                       South Korea   SINGAPORE                                         17.8%
                   Japan                           Singapore
                                                                 Park Hotel Clarke Quay                            17.8%

                                                                 Total                                             100.0%

1.   Based on A-HTRUST’s interest in each of the properties

                                                                                                                            8
Investors Presentation - June 2019 - SGX
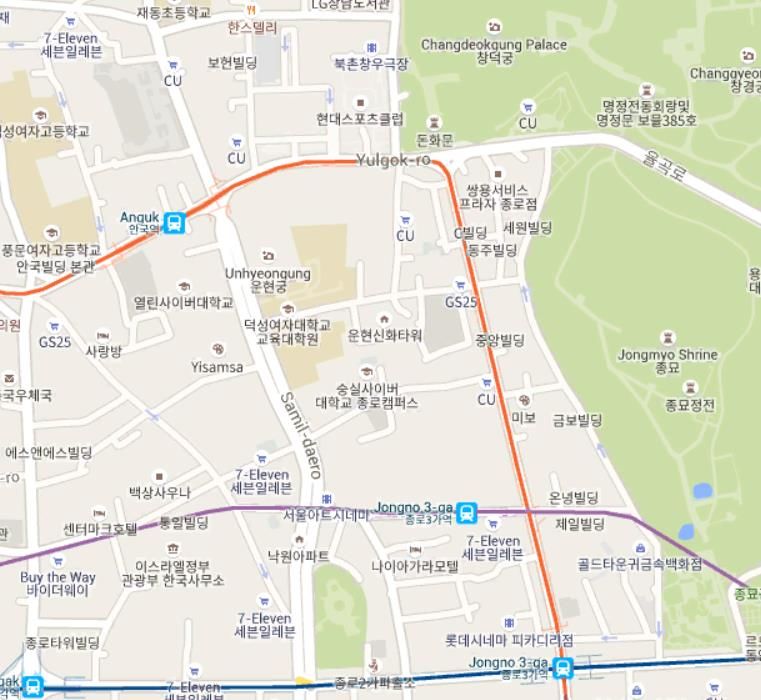
Stable income with upside potential

 Management Contracts:
                 48%                       China
                                            2%

                                                        Japan
                         Australia                       31%
                           47%        FY2018/19
                                     Net Property
                                       Income

                                                     Korea
                                                      5%
                                         Singapore
                                            15%
                                                                Master Lease:
                                                                52%

                                                                                9
Investors Presentation - June 2019 - SGX
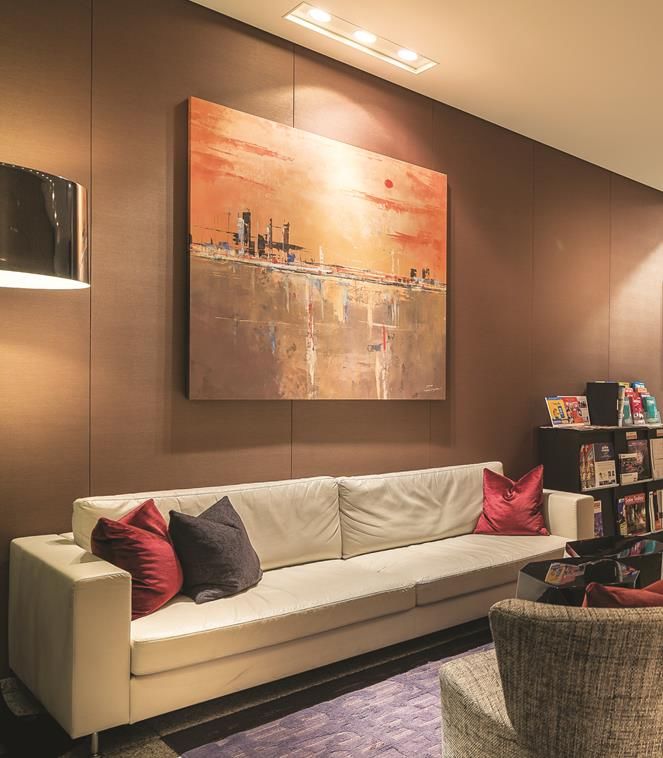
Diversified hotel segments caters to different guests

  Economy: 53%

                                               Midscale: 34%

                            4,744
                           Rooms

         Upscale: 13%

                                                               10
Improving income stability and further diversification
  Master Lease:                                                                Master Lease:
           17%                                                                          52%

                    Japan                                                                    Singapore
                     17%                                                                        15%
                                                                                         South
           China                                                                         Korea
            5%             FY2012/13                              Improved                5%       FY2018/19        Australia
                          Net Property                             Income                         Net Property        47%
                            Income                                 Stability                        Income

                                                                                           Japan
                                    Australia                                               31%
                                      78%                                                                  China
                                                                                                            2%
                                                Management Contract:                                                       Management Contract:
                                                83%                                                                        48%

                                                                                               Singapore
                  Japan                                                                           18%
                   24%                                                                                             Australia
                             Initial                                                    South                        34%
                           Portfolio                             Increased                            Portfolio
                                                                                        Korea       Valuation as
           China
                           Valuation                            Geographical             10%        at 31 March
                             at IPO                                Spread
            9%                                                                                          2019
                          (July 2012) Australia
                                        67%
                                                                                                     Japan
                                                                                                      38%

                                                                                                                                    11
2
Strategies
Executing strategies effectively to deliver long term value

    Active Asset   Work towards improving the value of its
    Management
     Strategy      hotels and enhance growth potential

     Acquisition   Pursue and acquire properties that can improve the
      Growth
      Strategy     overall quality of the portfolio

     Capital and
        Risk       Manage exposures to risks, maintain a prudent level of
     Management    borrowings and strong balance sheet
      Strategy

                                                                            13
Creating value for stapled securityholders
 Hotel Sunroute              ▪     Hotel Sunroute Osaka Namba      ▪     On 18 May 2018, A-
                                                                                                                                      Novotel Beijing
 Osaka Namba                       underwent a three-month               HTRUST divested the
                                                                                                                                      Sanyuan
                                   JPY1,135 million makeover             two Beijing hotels
                                   and reopened in April 2016            for     RMB1,156.4
                                                                         million
                             ▪     New 10-year master lease
                                   commenced on 1 January          ▪     The net proceeds
                                   2016 with improved rent               were substantially
                                   structure, based on higher of         used for acquisitions
                                                                                                                 ibis Beijing
                                   (i) fixed rent; or (ii)               and to pare down
                                                                                                                    Sanyuan
                                   percentage of gross revenue           borrowings

                                                       19,700
                                                                                                                                            1,156 2
   + JPY10,800m                        17,575
         121.3%                                                                               + RMB740m               + RMB582m
                         + JPY8,675m
                         97.5%                                                                178.0%                  101.5%
     (JPY m)

                                                                          (RMB m)
                   8,900                                                                                          574
                                                                                          416 1

               Acquisition Price       Valuation      Valuation                     Acquisition Price          Valuation                  Sale Price
                (Apr 2014)              (as at 31     (as at 31                      (IPO Jul 2012)             (as at 31                 (Jan 2018)
                                       Mar 2016)      Mar 2019)                                                Oct 2017)
                                                                   1.   Based on the property component of the aggregate purchase price for the Beijing hotels
                                                                   2.   Excluding the look fee of RMB23.6 million

                                                                                                                                                      14
Active FY2018/19 - Growing and enhancing the portfolio
                          20 December 2018
               Acquired Hotel WBF Honmachi
                       ▪ Freehold asset in a
                               good location
                          ▪ Master lease to             12 December 2018
                       provide stable income            Acquired ibis Ambassador Seoul Insadong
                                                                                                  1   Entry into growth market
                                                       ▪ Expand presence in
                                                         improving market
                         28 September 2018               with a strategically
         Acquired Hotel WBF Kitasemba East               locate hotel
                                                                                                  2   Further diversification
            and Hotel WBF Kitasemba West
                                                       ▪ Freehold hotel augment income
                     ▪ Freehold assets in a
                                                         stability through master lease
                             good location                                                        3   Added income stability
                   ▪ Master leases provide              21 May 2018
                             stable income              Acquired The Splaisir Seoul Dongdaemun
                                                       ▪ Freehold hotel at
                                                                                                  4   Overall younger portfolio
                                                         excellent location
                                                         in improving
                                 18 May 2018             market                                   5   >90% freehold properties
                      Divested China portfolio
                                                       ▪ Potential upside from repositioning
                         ▪ Substantial value
                    realised, exit yield 3.6%1
                     ▪ Proceeds effectively
                       recycled to grow and
                           enhance portfolio

1.   Based on the net property income of the China portfolio for FY2017/18.

                                                                                                                          15
1   Entry into the improving Korean market
    ▪      Over the past ten years, inbound arrivals to South Korea has generally been on a steady uptrend, with the
           exception of 2015 and 2017.
    ▪      Inbound to South Korea recovered in 2018 with a y-o-y increase of 15.1%, and saw growth from most of
           its source markets, inbound YTD April 2019 was 16.6% higher y-o-y

    International visitors to South Korea (millions)1
                                                                                                17.2
                                                                                                                    15.3   2009 – 2018
                                                                      14.2        13.2                   13.3
                                                         12.2                                                              CAGR: 7.8%
                                               11.1
                      8.8           9.8
          7.8
                                                                                                                                       4.7       5.5

         2009        2010           2011       2012      2013         2014     2015             2016     2017       2018             2018
                                                                                                                                      YTD      2019
                                                                                                                                               YTD Apr
                                                                                                                                     Apr 18      19
    Arrivals from top 10 source markets in 2018 (millions)1
             14.9%
              4.8
          4.2
                            27.6%
                             2.9
                         2.3
                                              20.5%        11.4%           3.9%             12.1%          2.6%         41.0%      24.5%
                                           0.9 1.1      0.9 1.0         0.7 0.7
                                                                                                                                                 11.9%
                                                                                         0.5 0.6        0.4 0.5      0.3 0.5    0.3 0.4       0.3 0.3

           China            Japan          Taiwan     United States    Hong Kong         Thailand      Philipines    Vietnam    Malaysia      Russia

                                                                             2017        2018
    1.   Source: Korea Tourism Organization.

                                                                                                                                                         16
2   Further diversify the portfolio
    ▪    The acquisitions are consistent with the objective of A-HTRUST to invest in a well-diversified portfolio as
         it strives to deliver stable and sustainable returns to the Stapled Securityholders.
    ▪    With a diversified nature of the portfolio, A-HTRUST is likely to be less affected by both the
         macroeconomic and microeconomic conditions of any single market.

    Before the transactions                                    After the transactions

                           China                                                  South
                           7.3%                                                   Korea
                                                                                  10.5%
                                                                                                      Japan
                          Portfolio       Japan                                       Portfolio       38.1%
                        Valuation as      32.4%                                     Valuation as
           Australia
            41.1%       at 31 March                                                 at 31 March
                           2018 of                                    Australia        2019 of
                         S$1,634m                                      33.6%         S$1,822m

                              Singapore                                                   Singapore
                                19.2%                                                       17.8%

                                                                                                                  17
3    Added income stability
     ▪    The two hotels in Beijing which were divested were both on management contract arrangements.
     ▪    The Splaisir Seoul Dongdaemun, ibis Ambassador Seoul Insadong and the three WBF-branded hotels are
          all on master leases, further improving the income stability of the portfolio.

    Before the transactions                                       After the transactions

    Master Lease:                                                 Master Lease:
             40%                                                           52%

                      Singapore                                                    Singapore
                         14%                                                          15%
                                                                              South
                                                                              Korea
                                                                               5%                        Australia
                          Net Property   Australia
                                                                                          Net Property
              Japan         Income                                                          Income         47%
                                           51%
               26%         FY2017/18                                                       FY2018/19

                                                                                  Japan
                         China                                                     31%
                          9%                                                                    China
                                                                                                 2%

                                           Management Contract:                                          Management Contract:
                                           60%                                                           48%

                                                                                                                     18
4        5     Younger portfolio with higher % of freehold assets
    ▪        The hotels in Beijing which were divested were built approximately 10 years ago, and both on leasehold
             land expiring in 2044.
    ▪        The five hotels acquired in FY2018/19 are all freehold properties and had an average age of less than 3
             years as of 31 March 2019, with the three WBF-branded hotels in Osaka only completed in 2018.

    Average Age of A-HTRUST Portfolio (years)1                   Proportion of freehold hotels in Portfolio (%)
                     23                                                                               93%

                                            18                               73%

         Portfolio as at 31 Mar    Portfolio as at 31 Mar           Portfolio as at 31 Mar   Portfolio as at 31 Mar
                  2018                      2019                             2018                     2019

    1.   Based on year of build.

                                                                                                                       19
Mitigating currency and interest rate risks

     1   Foreign currency hedging policy for distribution
           Systematic hedging approach using currency forwards up to 15 months (5
           quarters) in advance to smoothen volatility.

     2   Foreign currency hedging policy for balance sheet
           To protect the capital values of foreign assets against foreign currencies
           movements, borrowings are matched in the same currencies of these assets
           to achieve a natural hedge.
           The balance equity in these foreign assets are not hedged due to the high
           costs involved to take on long-term hedging on equity position.

     3   Interest rate hedging policy
           More than 50% of borrowings are on fixed rate so as to mitigate interest rate
           volatility.

                                                                                           20
Strategies premised on prudent capital management
 Debt Profile as at 31 March 2019                                               Balance Sheet Hedging as at 31 March 2019

           KRW                                                                        JPY                                                54%
                                                       Floating
          10.6%            AUD                          17.7%
                          27.2%
               Debt                                            Interest         KRW                                        33%
             Currency         SGD                                Rate
              Profile         0.9%                              Profile

         JPY                                                            Fixed    AUD                                 27%
        61.3%                                                           82.3%

 Healthy Balance Sheet                                                          Debt Maturity Profile
                                                      As at 31 March 20191                   350
                                                                                                    No significant
                                                                                             300    refinancing
  Gearing                                                       33.2%                                                            312
                                                                                             250    requirements

                                                                                S$ million
  Interest Cover                                             12.7 times                      200    until 2020             70
  Average interest rate                                         2.0%                         150
                                                                                             100                           146
  Weighted average debt to maturity                           3.8 years
                                                                                             50           75
                                                                                                    5                                   38
  Net asset value per stapled security                         S$1.02                          0
                                                                                                   2019   2020   2021   2022     2023   2024

   1.    On a combined basis for A-HTRUST (comprising A-HREIT and A-HBT).                                  Bank Loans   MTN

                                                                                                                                             21
3
Financial Performance
Distribution track record for past five years
     Distributable Income1 (S$ m)                                                     Distribution per Stapled Security1 (cents)

                                                                                                                                   6.03
                                                                  68.5
                                                    66.2                                                               5.86
                                      63.9                                                                   5.68
                        60.5                                                                       5.41
          56.3
                                                                                          5.06

       FY14/15       FY15/16       FY16/17        FY17/18       FY18/19                 FY14/15   FY15/16   FY16/17   FY17/18   FY18/19

1.    Net of retention of income for working capital purposes from FY15/16 onwards.

                                                                                                                                          23
Steady portfolio growth since IPO

  Portfolio valuation (S$ million)

                                                                                             1,822
                                                                     1,624       1,634
                                                         1,525
                                             1,373
                                 1,297
       1,057        1,045

        IPO       31 Mar 2013 31 Mar 2014 31 Mar 2015 31 Mar 2016 31 Mar 2017 31 Mar 2018 31 Mar 2019
    (July 2012)

                                                                                                        24
Appendix
4Q FY2018/19 Results
Results Summary – 4Q FY2018/19
                                            4th Quarter

 S$’ million                     FY2018/19              FY2017/18              Change1
                                                                                                              • Full quarter contribution
 Gross                                                                                                          from all five newly acquired
                                     49.0                   49.7                (1.4)%
 Revenue2                                                                                                       hotels
                                                                                                              • Partially offset by lower
 Net Property
                                     22.9                   22.0                 4.1%                           contribution from Singapore
 Income2                                                                                                        hotel and Australia portfolio
                                                                                                                exacerbated by weaker AUD
 NPI Margin (%)                      46.6                   44.1                 2.5pp                          against SGD

 Income available                                                                                             • Mainly attributed to lower
                                     21.6                   21.1                 2.4%
 for distribution                                                                                               finance costs and partial
                                                                                                                distribution of the proceeds
 Adjusted Income                                                                                                from the divestment of the
 available for                       20.1                   19.5                 3.5%                           two hotels in Beijing
 distribution3                                                                                                  (“Divestment’), partially
                                                                                                                offset by the absence of look
                                                                                                                fee received in 4Q FY2017/18
 DPS (cents)3                        1.77                   1.72                 2.9%                           in connection to the
                                                                                                                Divestment

 1.   Save for DPS, percentage changes are based on figures rounded to nearest thousands.
 2.   Excluded contribution from the China portfolio, which was divested on 18 May 2018. Including contribution from the China portfolio, gross revenue
      and NPI for 4Q FY2017/18 were S$54.7 million and S$23.7 million, respectively.
 3.   Net of retention of distributable income for working capital purposes. Retention of distributable income was 6.8% and 7.8% for 4Q FY2018/19 and
      4Q FY2017/18, respectively.

                                                                                                                                                     26
Results Summary – FY2018/19
                                              Full Year

 S$’ million                     FY2018/19              FY2017/18              Change1

 Gross                                                                                                        • Mainly due to lower
                                    190.5                   203.3               (6.3)%                          contribution from Australia
 Revenue2
                                                                                                                portfolio which was also
                                                                                                                impacted by unfavourable
 Net Property                                                                                                   movement in AUD
                                     85.2                   87.2                (2.3)%
 Income2

 NPI Margin (%)                      44.7                   42.9                 1.8pp
                                                                                                              • Mainly attributed to lower
 Income available                                                                                               finance costs, tax expenses
                                     73.6                   71.3                 3.2%                           and partial distribution of the
 for distribution
                                                                                                                proceeds from the
                                                                                                                Divestment, partially offset
 Adjusted Income                                                                                                by the absence of look fee
 available for                       68.5                   66.2                 3.4%                           received in FY2017/18 in
 distribution3                                                                                                  connection to the
                                                                                                                Divestment
 DPS (cents)3                        6.03                   5.86                 2.9%

 1.   Save for DPS, percentage changes are based on figures rounded to nearest thousands.
 2.   Excluded contribution from the China portfolio, which was divested on 18 May 2018. Including contribution from the China portfolio, gross revenue
      and NPI for FY2018/19 were S$193.8 million and S$86.7 million, respectively, and gross revenue and NPI for FY2017/18 were S$224.7 million and
      S$95.7 million, respectively.
 3.   Net of retention of distributable income for working capital purposes. Retention of distributable income was 7.0% and 7.1% for FY2018/19 and
      FY2017/18, respectively.

                                                                                                                                                     27
Performance by Country
 ▪            Full quarter contribution from newly acquired hotels in Seoul and Osaka
 ▪            Lower contribution from Australia portfolio and Singapore hotel

                                   Gross Revenue                                                         Net Property Income

              40.0     6.7%
                                                                                          15.0
                     37.1
                            34.6
                                                                                                   16.5%
                                                                                                 11.6
              30.0
                                                                                                        9.7
                                                                                          10.0
                                                                                                                        20.6%
                                                                                                                             8.1
 S$ million

                                                                             S$ million
              20.0                                                                                                     6.7

                                              1.5%                                         5.0                                                    13.9%
                                                                                                                                                3.7
              10.0                          8.9 9.1                                                                                                   3.2
                                                                     13.8%
                                   5.0                                                                        1.7                      1.9
                                                                   3.7 3.2
                                                          2.1

               0.0                                                                         0.0
                     Australia      China    Japan     Korea    Singapore                        Australia     China    Japan      Korea     Singapore

                             4Q FY17/18               4Q FY18/19                                         4Q FY17/18                4Q FY18/19

                                                                                                                                                            28
Australia portfolio – Challenges persist
                         Net Property Income in AUD                                                         Net Property Income in S$
                                                             -10.3%                                         SGD/AUD:                -16.5%
              15.0                                                                              17.5                                                    1.200
                                                                                                               1.0381
                                                                                                                                                        SGD/AUD:
                                                                                                15.0
                                                                                                                                                        0.9651 (-7%)
                                              11.2
                                                                            10.0                12.5                    11.6
              10.0                                                                                                                                      0.800
AUD million

                                                                                                                                                                SGD / AUD
                                                                                                                                                  9.7

                                                                                   S$ million
                                                                                                10.0

                                                                                                 7.5
               5.0                                                                                                                                      0.400
                                                                                                 5.0

                                                                                                 2.5

               0.0                                                                               0.0                                                    0.000
                      1Q       2Q      3Q      4Q       1Q      2Q     3Q   4Q                         1Q   2Q    3Q    4Q     1Q    2Q      3Q    4Q

                                FY17/18                           FY18/19                                   FY17/18                   FY18/19

       ▪ While average occupancy rate for the hotels in Sydney is maintained at a healthy rate of close to 90%, the hotels’
         performance was affected by lower average room rates.
       ▪ The hotel in Melbourne saw higher demand for residential conference while the Brisbane hotel benefitted from
         higher occupancy.
       ▪ Overall RevPAR for 4Q FY2018/19 decreased by 3.2% y-o-y.
    1.         Based on average rate used for the respective quarter

                                                                                                                                                            29
Japan portfolio – Acquisitions drive income
                             Net Property Income in JPY                                                          Net Property Income in S$
                                                               +19.8%                                           JPY/SGD:               +20.6%
              800.0                                                                                 11.0
                                                                                                                  0.0121                                     SGD/JPY:
                                                                                                    10.0
              700.0                                                                                                                                          0.0121 (+1%)
                                                                               658.2                 9.0
                                                                                                                                                     8.1
              600.0                                                                                  8.0                                                   0.010
                                               549.6
                                                                                                     7.0                    6.7
JPY million

                                                                                       S$ million

                                                                                                                                                                   SGD / JPY
              500.0                                                                                  6.0

              400.0                                                                                  5.0
                                                                                                     4.0                                                   0.005
              300.0                                                                                  3.0
                                                                                                     2.0
              200.0
                                                                                                     1.0
              100.0                                                                                  0.0                                                   0.000
                        1Q      2Q       3Q      4Q       1Q      2Q      3Q    4Q                         1Q   2Q     3Q   4Q    1Q     2Q     3Q   4Q
                                  FY17/18                           FY18/19                                      FY17/18                  FY18/19

              ▪ Driven by a full quarter contribution from all three WBF-branded hotels acquired in 2018, the net property
                income from the Japan portfolio grew by approximately 20% y-o-y for 4Q FY2018/19.

          1.     Based on average rate used for the respective quarter.

                                                                                                                                                               30
Korea portfolio – Full quarter contribution from both hotels
                          Net Property Income in KRW                                                       Net Property Income in S$
                                                                                                                                    SGD/KRW:
              1,800.0                                                                           2.5                                 0.00121  0.0014
              1,600.0
                                                                         1,600.5
                                                                                                                                             0.0012
              1,400.0                                                                           2.0                                 1.9
                                                                                                                                             0.0010
              1,200.0
KRW million

                                                                                                                                                      SGD / KRW
                                                                                                1.5

                                                                                   S$ million
              1,000.0                                                                                                                        0.0008

               800.0                                                                                                                         0.0006
                                                                                                1.0
               600.0
                                                                                                                                             0.0004
               400.0                                                                            0.5
                                                                                                                                             0.0002
               200.0
                  0.0                                                                           0.0                                          0.0000
                              1Q              2Q             3Q            4Q                         1Q        2Q             3Q   4Q

                                                   FY18/19                                                           FY18/19

         ▪ Income from Korea portfolio was boosted by the contribution from Ibis Ambassador Seoul Insadong which was
           acquired in December 2018.

     1.         Based on average rate used for the respective quarter.

                                                                                                                                                 31
Singapore portfolio – Stable performance
                                                        Net Property Income in S$
                                                                               -13.9%
                                             4.0
                                                                    3.7

                                                                                             3.2

                                             3.0

                               SGD million

                                             2.0

                                             1.0
                                                   1Q    2Q    3Q   4Q    1Q     2Q     3Q   4Q

                                                          FY17/18                 FY18/19

 ▪ Park Hotel Clarke Quay in Singapore experienced weaker demand from transient and corporate segments in 4Q
   FY2018/19.
 ▪ There was also the absence of Singapore Airshow, a biennial event, held in February 2018.

                                                                                                               32
Portfolio valuation as at 31 March 2019
 ▪   Acquisitions boost portfolio valuation

           Portfolio Valuation (S$m)                 Valuation by Country (Local Currency)
                                                                                     34.9%
                                     1,822.5              3.7%                        57.1
                                                  662.7
                       S$188.4m                           638.0
          1,634.1        +11.5%

                                                                              42.3

                                                                                                                3.5%
                                                                                                           314.0 325.0

                                                                                                  159.5

                                                                  574.0

       31 March 2018              31 March 2019    Australia        China           Japan    South Korea   Singapore
                                                  (AUD mn)        (RMB mn)        (JPY bn)    (KRW bn)     (SGD mn)

                                                                  31 March 2018              31 March 2019

                                                                                                                         33
Appendix
Portfolio Summary
Portfolio Summary – Hotels under management contract
                                             Pullman Sydney Hyde Park    Courtyard by Marriott Sydney-
                                             Sydney, Australia           North Ryde
                                                                         Sydney, Australia
                                             241 rooms
                                             AUD 163.0 million1          196 rooms
                                             Freehold                    AUD 54.5 million1
                                                                         Freehold

                                             Novotel Sydney Central      Pullman & Mercure Melbourne
                                             Sydney, Australia           Albert Park
                                                                         Melbourne, Australia
Australia

                                             255 rooms
                                             AUD 168.0 million1          378 rooms
                                             Freehold                    AUD 114.0 million1
                                                                         Freehold

                                             Novotel Sydney Parramatta   Pullman & Mercure Brisbane
                                             Sydney, Australia           King George Square
                                                                         Brisbane, Australia
                                             194 rooms
                                             AUD 45.5 million1           438 rooms
                                             Freehold                    AUD 93.0 million1
                                                                         Freehold

1.          Valuation as at 31 March 2019.

                                                                                                      35
Portfolio Summary – Hotels under master lease
                                         Hotel Sunroute Ariake        Hotel WBF Kitasemba West
                                         Tokyo, Japan                 Osaka, Japan

                                         912 rooms                    168 rooms
                                         JPY 26,700 million1          JPY 3,550 million1
                                         Freehold                     Freehold

                                         Hotel Sunroute Osaka Namba   Hotel WBF Honmachi
                                         Osaka, Japan                 Osaka, Japan

                                         698 rooms                    182 rooms
Japan

                                         JPY 19,700 million1          JPY 3,560 million1
                                         Freehold                     Freehold

                                         Hotel WBF Kitasemba East
                                         Osaka, Japan

                                         168 rooms
                                         JPY 3,540 million1
                                         Freehold

1.      Valuation as at 31 March 2019.

                                                                                                 36
Portfolio Summary – Hotels under master lease
                                                          The Splaisir Seoul Dongdaemun                                                         Park Hotel Clarke Quay
                                                          Seoul, South Korea                                                                    Singapore

                                                                                               Singapore
                                                          215 rooms                                                                             336 rooms
                                                          KRW 79,500 million1,2                                                                 SGD 325.0 million1
                                                          Freehold                                                                              Leasehold expiring Nov 2105
South Korea

                                                          ibis Ambassador Seoul Insadong
                                                          Seoul, South Korea

                                                          363 rooms
                                                          KRW 82,000 million11,3
                                                          Freehold

 1.           Valuation as at 31 March 2019.
 2.           Based on latest available valuation and 100% interest. A-HTRUST owns 98.7% interest in the hotel, with the remaining 1.3% owned by a Sponsor-related entity.
 3.           Based on latest available valuation and 100% interest. A-HTRUST owns 98.8% interest in the hotel, with the remaining 1.2% owned by a Sponsor-related entity.

                                                                                                                                                                              37
Appendix
Acquisitions in 2018
Maiden entry into another gateway city - Seoul
                                                                                                                    ✓     Hotel strategically located in the prominent
                                                                                    Excellent
                                                                                                                          Dongdaemun area
                                                                                    Location                        ✓     Improving hotel market

                                                                                DPS Accretive                       ✓     The acquisition is expected to be DPS
                                                                                 Acquisition                              accretive on pro forma FY2017/18 basis1

                                                                                                                    ✓     Minimal capital expenditure expected in the
                                                                               Relatively New
                                                                                                                          next few years
                                                                               Freehold Asset                       ✓     Adds another freehold asset to the portfolio

                                                                                                                    ✓     Opportunity to enhance asset value from hotel
     The Splaisir Seoul Dongdaemun1 (Previously                               Potential Upside                            rebranding and repositioning under Sotetsu,
     known as KY-Heritage Hotel Dongdaemun)                                                                               an established hotel operator from Japan
     ▪       Number of rooms: 215
                                                                                                                    ✓     20-year master lease agreement to be in
     ▪       Land tenure: Freehold                                               Improved
                                                                                                                          place with effect from 1 July 2018, mitigates
     ▪       Hotel type: Midscale
                                                                              Income Stability                            downside risk and provides potential upside
     ▪       Year of completion: 2015
     ▪       Purchase price: KRW 73.0b2                                            Broaden                          ✓     Diversification of portfolio into another
                                                                                 Earning Base                             gateway city
     ▪       Valuation at acquisition: KRW 75.4b2,3

1.       Please refer to the announcement dated 27 April 2018 for further information on the acquisition of the hotel.
2.       Based on 100% interest in the hotel. A-HTRUST owns 98.7% interest in the hotel, with the remaining 1.3% owned by a Sponsor-related entity.
3.       Valuation as at 30 March 2018.

                                                                                                                                                                  39
The Splaisir Seoul Dongdaemun situated in prime location
                                              Dongdaemun Wholesale and
                                                         Retail Precinct
                                             • Renowned leisure destination
                                             • 2nd most visited destination in
                                                    Seoul by foreign tourists

                                                 Dongdaemun Design Plaza

                                                  • Prominent city landmark
                                          • Comprises museum, conferencing
                                                       and exhibition space

                                            Dongdaemun History & Culture
                                                    Park Subway Station
                                               • Minutes walk from the Hotel
                                          • Provides excellent connectivity to
                                                       other parts of the city

 Source: Google Map.

                                        The Splaisir Seoul Dongdaemun

                                                                           40
Deepens presence in Osaka with acquisition of portfolio

      DPS Accretive                                                                                          Hotel WBF Kitasemba West . Hotel WBF
                                          ✓     The acquisition is expected to be DPS
                                                accretive on pro forma FY2017/18 basis1                      Kitasemba East . Hotel WBF Honmachi1
       Acquisition
                                                                                                             ▪        Total number of rooms: 518
         Strategic                                                                                           ▪        Land tenure: Freehold
                                          ✓     The hotels are strategically located in
         Location                               Osaka, a gateway city                                        ▪        Hotel type: Select service
         of Hotels                                                                                           ▪        Year of completion: 2018
                                          ✓     The hotels were only completed in                            ▪        Aggregate purchase price: JPY10.3b
      New Freehold
                                                2018, and minimal capital expenditure is                     ▪        Aggregate valuation at acquisition: JPY10.6b2
         Hotels                                 expected in the next few years

                                          ✓     The master leases, with 20-year tenor
        Improved
                                                each, will further improve the income
     Income Stability                           stability

                                          ✓     The hotels are managed by White Bear
      Diversify pool
                                                Family, Co., Ltd., an established hotel
      of operators                              operator

                                          ✓     Broadens A-HTRUST’s earning base and
       Broadens
                                                further reducing its reliance on any
      Earning Base                              single property

1.    Please refer to the announcement dated 18 June 2018 for further information on the acquisition of the hotels.
2.    Valuation as at 25 May 2018.

                                                                                                                                                               41
Osaka Portfolio well positioned
                                                 Hotel WBF
                                           Kitasemba West

                                                  Hotel WBF
                                             Kitasemba East

                                                  Osaka Castle
                                    • Iconic landmark of Osaka

                                       Honmachi Metro Station
                                  • Running 3 lines of the Osaka
                                             Municipal Subway

                                     Hotel WBF Honmachi

                                  Hotel Sunroute Osaka Namba
                                   • Another hotel of A-HTRUST

                                                      Dotonbori
                                    • Prominent entertainment
                                                      precinct

Source: Google Map.

                                                            42
Expanding footprints in improving market
                                                                                                                    ✓     Well located to cater to leisure and corporate
                                                                                    Strategic
                                                                                                                          segments
                                                                                    Location                        ✓     Exposure to Improving hotel market

                                                                                DPS Accretive                       ✓     The acquisition is expected to be DPS
                                                                                 Acquisition                              accretive on pro forma FY2017/18 basis1

                                                                               Operator with                        ✓     Master Lessee with strong local knowledge
                                                                               strong domain                              and ability to leverage on AccorHotels
                                                                                 knowledge                                network
     Ibis Ambassador Seoul Insadong1
     ▪       Number of rooms: 363                                                Improved                           ✓     Minimum rent payable helps mitigate
     ▪       Land tenure: Freehold                                            Income Stability                            downside risks with no cap to upside
     ▪       Hotel type: Economy
     ▪       Year of completion: 2013                                           New Freehold                        ✓     Major capital expenditure not expected in the
     ▪       Purchase price: KRW         77.5b2                                    Hotel                                  short term
     ▪       Valuation at acquisition: KRW 80.0b2,3

                                                                                   Broaden                          ✓     Broadens A-HTRUST’s earning base and
                                                                                 Earning Base                             further diversification of portfolio

1.       Please refer to the announcement dated 28 November 2018 for further information on the acquisition of the hotel.
2.       Based on 100% interest in the hotel. A-HTRUST owns 98.8% interest in the hotel, with the remaining 1.2% owned by a Sponsor-related entity.
3.       Valuation as at 27 June 2018.

                                                                                                                                                                 43
Ibis Ambassador Seoul Insadong strategically located
                                                             Bukchon Hanok Village
                                                    • Centuries-old traditional village

                                                             Changdeokgung Palace
                                              • Listed as UNESCO World Heritage site

                                                                   Jongmyo Shrine
                                              • Listed as UNESCO World Heritage site

                                            Ibis Ambassador Seoul Insadong

                                                           Ikseondong Hanok Village
                                          • A popular area with retail shops and cafes

                                                                  Jongno 3-ga Station
                                               • Runs three lines of the Seoul Subway

                                                             Insadong Retail Precinct
                                                       • A popular tourist destination

Source: Google Map.

                                                                             44
Ascendas Hospitality Fund Management Pte. Ltd.
Ascendas Hospitality Trust Management Pte. Ltd.

           Managers of A-HTRUST
        1 Fusionopolis Place, #10-10
         Galaxis, Singapore 138522
             Tel: +65 6774-1033
       Email: info-aht@ascendas.com
             www.a-htrust.com
You can also read