Affordable & Liveable Property Guide - Melbourne Metro 1st Half 2021

Page created by Wanda Webb
 
CONTINUE READING
Affordable & Liveable Property Guide - Melbourne Metro 1st Half 2021
Affordable & Liveable Property Guide
             M e l b o u rne M e tr o 1 s t H a l f 2 0 2 1
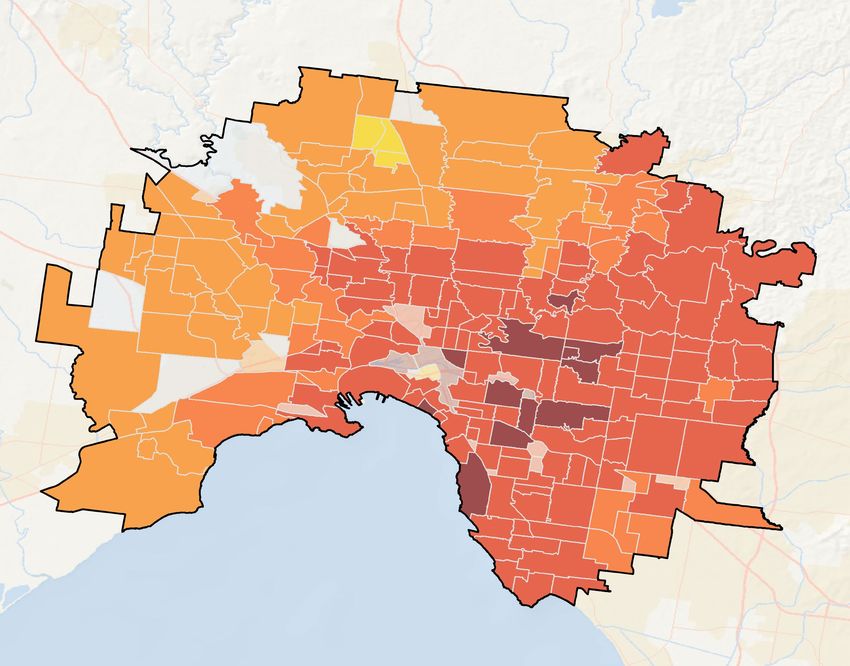
Affordable & Liveable Property Guide - Melbourne Metro 1st Half 2021
MELBOURNE METRO
                                                                                                                                                     Annual Change^

METHODOLOGY                                                                                                                                          Sales

This affordable and liveable property guide for Melbourne Metro analyses all suburbs                                                                 Median Price
within a 20km radius of the Melbourne CBD. The following criteria were considered:
                                                                                                                                                     Rental Price
•    Property trends criteria – all suburbs have a minimum of 20 sales transactions for
     statistical reliability purposes. Based on market conditions suburbs have either
     positive or as close as possible to, neutral price growth between 2019 to 2020/21*.                                                             Sales
•    Investment criteria – as of March 2021, suburbs considered will have an on-par or
     higher rental yield than Melbourne Metro, and an on-par or lower vacancy rate.                                                                  Median Price
•    Affordability criteria – identified affordable and liveable suburbs have a median
     price below a set threshold. This was determined by adding percentage premiums                                                                  Rental Price
     to the Victorian (VIC) average home loan, which was $506,328** as of Q4 2020.
     Premiums of 68% for houses and 24% for units were added, which were below
     those required to reach Melbourne Metro’s median prices (110% for houses and
     24% for units). This places the chosen suburbs below Melbourne’s median prices,                                                      MEDIAN SALE PRICE
     meaning that the suburbs identified within this report are more affordable for buyers.
•    Development criteria – suburbs identified must have a high total estimated value
     of future project development for the 1st half of 2021, as well as a higher proportion
     of commercial and infrastructure projects. This ensures the suburbs show signs of
     sustainable economic growth, in turn, positively affecting the property market.                                                        $1.06M           $630K
•    Liveability criteria – all identified suburbs have low crime rates, availability of
     amenities within a 5km radius (i.e. schools, green spaces, public transport,                                                           HOUSE             UNIT
     shopping centres and health care facilities), and an unemployment rate on-par or
     lower in comparison to the VIC average (as determined by the Department of Jobs                                                      AVERAGE DAYS TO SELL
     and Small Business, December Quarter 2020 release).

RECENT TOP PERFORMERS
                                                                 Median             Median
                                                                                                       Price         Projects
                                                                                                                                             46               59
    Area                  Suburb                  Type            Price              Price
                                                                                                      Growth         2021***
                                                                  2019             2020/21*                                                 HOUSE             UNIT
                      South Yarra                House        $1,681,000 $1,742,000                    3.6%         $256.7M
    Inner
                       Melbourne                   Unit        $485,000            $510,000            5.2%           $2.4B               AVERAGE VENDOR DISC.
                       Brunswick                 House        $1,030,000 $1,100,000                    6.8%          $88.8M
    North
                         Preston                   Unit        $500,000            $550,000           10.0%         $608.6M
                    Caulfield South              House        $1,497,000 $1,672,000                   11.7%          $19.2M
                                                                                                                                            +3.0%            -0.7%
    South
                    Caulfield South                Unit        $719,000            $853,000           18.6%          $19.2M
                         Glen Iris               House        $1,947,000 $2,015,000                    3.5%          $54.2M                 HOUSE             UNIT
     East
                        Blackburn                  Unit        $551,000            $678,000           23.0%          $31.3M
                        Footscray                House         $812,000            $871,000            7.3%           $1.8B
    West
                        Footscray                  Unit        $415,000            $470,000           13.3%           $1.8B               MEDIAN RENTAL PRICE

OVERVIEW
Median property prices in Melbourne Metro increased by 2.4% for houses to
$1,065,000 from Q1 2020 to Q1 2021* and increased by 3.8% for units at $630,000.
Across the same period, total sales in Melbourne Metro increased by 28.6% (to 6,903                                                          $500            $400
sales) for houses, and by 32.2% (to 7,285 sales) for units. Melbourne Metro’s median
price activity has proven to be extremely resilient, considering the severity of COVID-19                                                   HOUSE             UNIT
restrictions that the area has faced since late 2020. A more confident consumer in early
2021, coupled with a low interest rate environment and lenient lending restrictions, have
                                                                                                                                          AVERAGE DAYS TO LET
contributed to the current price growth. $15.8B of development is planned for the 1st
half of 2021. A key focus on commercial projects will rejuvenate business confidence
and economic growth post COVID-19 lock downs and restrictions. This will create jobs
in the construction phase, which will have a snowball effect into the real estate market.
*Median price quoted captures sale transactions from 1st January 2020 to 31st March 2021, or Q1 2020 – Q1 2021. **Average home loan
figure is derived from December Quarter 2020 Housing Affordability Report by the Real Estate Institute of Australia (REIA) and Adelaide
Bank. ***Project development is based on aggregate of estimated construction value for residential, commercial, industrial, mixed-use
                                                                                                                                             26              30
and infrastructure projects scheduled to commence in the 1st half of 2021 as stated by the relevant data authority. ^Annual Change is
reflective of median price change from Q1 2020 to Q1 2021. Figures displayed in infographics are for the period Q1 2020.
Source: APM Pricefinder, REIA, SQM Research, Cordell Connect, Department of Jobs and Small Business. © PRD 2021.
                                                                                                                                            HOUSE             UNIT
Affordable & Liveable Property Guide - Melbourne Metro 1st Half 2021
AVERAGE VENDOR DISCOUNT                                                                                                        KEY COMMENTS
                                                                                                                                            Average vendor discounts between Q1 2020 and Q1
                                    4.0%                                                                                                    2021 for houses have swung to a premium of +3.0%,
                                                                                                                                            while units have continued to tighten to -0.7%. House
Change from Listing to Sale Price

                                    3.0%

                                    2.0%                                                                                                    market conditions in Melbourne Metro have shifted to

                                                                                                                  3.0%
                                                                                                                                            favour vendors, as buyers are willing to offer above
                                    1.0%
                                            1.5%

                                                                                                                                            initial list prices. There are still small discounts for unit
                                    0.0%
                                                                                                                                            buyers, however time to act is of the essence.
                                                   -0.1%

                                                                                                  -0.1%

                                                                                                          -2.4%
                                                                               -2.5%
                                    -1.0%

                                                                                       -2.8%

                                                                                                                         -0.7%
                                                            -3.8%

                                                                    -3.8%

                                    -2.0%
                                                                                                                                            The dominant proportion of homes sold in Melbourne
                                    -3.0%                                                                                                   Metro across 2020/21# were in the premium price
                                    -4.0%                                                                                                   bracket of $1,200,000 and above (40.8%). Units also
                                    -5.0%                                                                                                   recorded a dominant premium price bracket of
                                             Q1 2020        Q2 2020            Q3 2020            Q4 2020          Q1 2021                  $750,000, and above (31.2%). This confirms the market
                                                                    House                       Unit                                        has shifted to a premium market. Affordable options are
                                                                                                                                            available, however, first home buyers must act quickly.
            MARKET PERFORMANCE
                                                                            House Sales                           Unit Sales                         House Median                               Unit Median

                  $1,200,000                                                                                                                                                                                      9,000

                                                                                                                                                                                                                  8,000
                  $1,000,000
                                                                                                                                                                                                                  7,000

                                    $800,000                                                                                                                                                                      6,000

                                                                                                                                                                                                                  5,000
                                    $600,000
                                                                                                                                                                                                                  4,000

                                    $400,000                                                                                                                                                                      3,000

                                                                                                                                                                                                                  2,000
                                    $200,000
                                                                                                                                                                                                                  1,000

                                            $0                                                                                                                                                                    0
                                                           Q1 2020                             Q2 2020                           Q3 2020                        Q4 2020                          Q1 2021

            PRICE BREAKDOWN 2020/21#
               HOUSES SOLD                                                                                                              UNITS SOLD

                                                           10.0%
                                                                                                 Less than $599,999                                                     20.5%                      Less than $449,999
                                                                                                                                                31.2%
                                                                     20.0%                       $600,000 to $799,999                                                                              $450,000 to $549,999
                                       40.8%
                                                                                                 $800,000 to $999,999                                                                              $550,000 to $649,999
                                                                                                                                                                              16.4%
                                                                                                 $1,000,000 to $1,199,999                                                                          $650,000 to $749,999

                                                               16.6%                             $1,200,000 and above                             14.1%                                            $750,000 and above
                                                   12.7%                                                                                                          17.9%

                                                                                               #2020/21 encapsulates sales transactions for Q1 2020 – Q1 2021 (01/01/2020 – 31/03/2021) only.
                                                                                               Source: APM Pricefinder.
                                                                                               © Copyright PRD 2021.
Affordable & Liveable Property Guide - Melbourne Metro 1st Half 2021
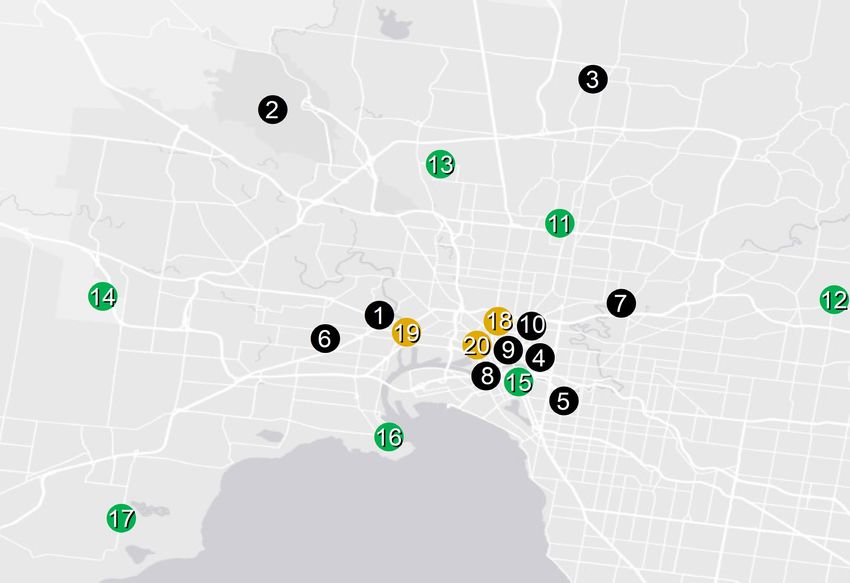
MELBOURNE METRO MEDIAN HOUSE PRICE 2020/21*
20KM FROM CBD

                                                                       1

                                                                                          6
                                                                                                                                 5
                                                                                                                        2
                                                                                                              4

                                                                                                                                             3

                                                                   MELBOURNE AFFORDABLE & LIVEABLE SUBURBS
     LEGEND
                                                                   RENTAL YIELD
                      Data not available
                      $0 - $500,000                                                     Suburb                       House             Suburb       Unit

                      $500,000 - $800,000
                      $800,000 - $1,000,000                            1              Greenvale                      3.6%    4        Northcote     3.6%

                      $1,000,000 - $2,000,000
                                                                       2               Bellfield                     2.8%    5       Lower Plenty   3.5%
                      $2,000,000+
                      20km from CBD
                                                                       3              Mulgrave                       2.7%    6       Pascoe Vale    3.8%
     Translucent colours for
Affordable & Liveable Property Guide - Melbourne Metro 1st Half 2021
RENTAL GROWTH 2020/21 €
In March 2021, house rental yields in Melbourne Metro were recorded at 2.6%. In the 12 months to Q1 2021, the median
house rental price remained stable at $500 per week, while average days on the market declined by -7.1% (to 26 days).
Despite tough COVID-19 lockdowns and restrictions it experienced, Melbourne Metro’s rental market remained resilient.

Three bedroom houses recorded the highest annual rental growth (of +4.4%), to reach $470 per week. A softening in
median unit rental prices was felt mostly in the 1 and 2 bedroom market. This is potentially a consequence of international
border closures, as the Melbourne Metro apartment market was predominately demanded by overseas students.

In March 2021, Melbourne Metro recorded a vacancy rate of 4.4%, which is above that of Sydney Metro (3.4%), and
Brisbane Metro (1.5%). Vacancy rates in Melbourne Metro sit above the Real Estate Institute of Australia’s (REIA) healthy
benchmark of 3.0%, due to COVID-19 restrictions. However, in the long run, Melbourne Metro Vacancy rates are forecasted
to recover towards healthier levels, as history suggests it has always remained under the REIA healthy benchmark.

      2 Bed House                      3 Bed House                      4+ Bed House                      1 Bed Unit              2 Bed Unit                     3+ Bed Unit

        +2.0%                            +4.4%                                0.0%                          -7.1%                  -6.7%                           0.0%
       $510                             $470                                 $550                         $340                    $420                           $560

RENTAL VACANCY RATES 2021
5.0%

4.5%

4.0%

3.5%

3.0%

2.5%

2.0%

1.5%

1.0%

0.5%

0.0%
           Mar-18

                         Jun-18

                                       Sep-18

                                                      Dec-18

                                                                    Mar-19

                                                                                     Jun-19

                                                                                                Sep-19

                                                                                                              Dec-19

                                                                                                                       Mar-20

                                                                                                                                 Jun-20

                                                                                                                                               Sep-20

                                                                                                                                                        Dec-20

                                                                                                                                                                          Mar-21

                    Sydney Metro                         Melbourne Metro                            Brisbane Metro                 REIA 'Healthy' Benchmark

RENTAL YIELD 2021 §

       2.4%                             2.6%                                 3.8%                         3.5%                   3.3%                    5.2%

       Sydney                          Melbourne                             Brisbane                     Sydney                Melbourne               Brisbane
        Metro                            Metro                                Metro                        Metro                  Metro                  Metro

€ Annual rental growth is a comparison between 2019 and 2020/21 (01/01/2020 – 31/03/2021) house median rent figures.
§ Rental yields shown are as reported at March 2021.
Source: APM Pricefinder, SQM Research. © Copyright PRD 2021.
Affordable & Liveable Property Guide - Melbourne Metro 1st Half 2021
PROPERTY CLOCK - HOUSES
                                                                                                                                                                   Peak

                                                                                                                                Upswing                                                        Downswing

                                                                                                                                                                 Bottom

AFFORDABLE & LIVEABLE HOUSE SUBURBS
       GREENVALE 3059                                                                 BELLFIELD 3081                                                               MULGRAVE 3170

                                                          2 Bed                                                                          2 Bed                                                                         2 Bed
                                                          3 Bed                                                                          3 Bed                                                                         3 Bed
                                                          4+ Bed                                                                         4+ Bed                                                                        4+ Bed

Located about 20.0km from the                                                 Located about 10.0km from the                                               Located about 19.9km from the
Melbourne CBD.                                                                Melbourne CBD.                                                              Melbourne CBD.
Median House Price         $728,000                                           Median House Price          $800,000                                        Median House Price         $850,000
• 2 Bed Median Price $590,000*                                                • 2 Bed Median Price $664,000*                                              • 2 Bed Median Price $626,000
• 3 Bed Median Price $682,000                                                 • 3 Bed Median Price $751,000                                               • 3 Bed Median Price $787,000
• 4+ Bed Median Price $770,000                                                • 4+ Bed Median Price N/A                                                   • 4+ Bed Median Price $918,000
Greenvale, north of Melbourne CBD,                                            Bellfield is the closest affordable and                                     Mulgrave is located south-east of
recorded median price growth of                                               liveable suburb to Melbourne CBD. A                                         Melbourne CBD, recording a median
1.1%** from 2019 to 2020/21. It is the                                        house rental yield of 2.8% is attractive                                    house price growth of 1.2%** from
most affordable of the three affordable                                       to many investors in the area,                                              2019 to 2020/21. Mulgrave recorded a
and liveable suburbs chosen. Those                                            particularly as it is accompanied by a                                      vacancy rate of 1.8%, well below
with a property investment, currently                                         low vacancy rate, which at 2.4% is                                          Melbourne Metro’s 4.4%. This shows
benefit from rental yields of 3.6%,                                           significantly lower than Melbourne                                          a healthier rental demand, thus highly
above Melbourne Metro’s 2.6%. This                                            Metro’s 4.4%. Despite being close to                                        conducive for investment. With a
is in conjunction with a lower vacancy                                        the CBD, this indicates a healthier                                         rental yield of 2.7%, above Melbourne
rate of 3.5%, below that of Melbourne                                         rental demand, highly conducive for                                         Metro’s rental yield, and a lower entry
Metro’s 4.4%. Thus, investors can be                                          investment. Bellfield ticks many of the                                     price point, Mulgrave gives more bang
confident of quicker occupancy in the                                         liveability boxes, as it is well                                            for buck. Mulgrave is close to shops,
rental property. $15.3M^ of project                                           positioned within the inner CBD and is                                      medical centres, public transport,
developments is planned in the 1st                                            served by medical centres, schools,                                         parks, schools, and the M1 Highway –
half of 2021, focusing on residential                                         shops, public transport and parks. A                                        which connects to major cities such
projects. Brendan Road Townhouses                                             total of $32.8M^ of projects are                                            as Melbourne and Frankston. $29.9M^
& Residential Subdivision ($3.3M, 15                                          planned in the 1st half of 2021, with a                                     of projects are planned to commence
townhouses and 45 Lots), is a major                                           key focus on infrastructure and                                             in the 1st half of 2021, with a focus on
project which will add townhouses                                             residential projects. This will not only                                    residential and commercial. Only 3
and supply residential lots, allowing                                         improve liveability for residents but                                       townhouses are planned, creating an
first home buyers to enter the market.                                        also create local jobs in the                                               opportunity for boutique developers.
                                                                              construction phase.
^Quoted estimated values of projects are based on reported land/construction values as stated by the relevant data authority and do not signify their commercial/resale value. *Median price is quoted as an indication only
due to having less than 20 sales transactions. **Median price growth quoted captures sale transactions from 1st January 2020 to 31st March 2021, or Q1 2020 – Q1 2021. µ PRD Affordable and Liveable Property Guide
Melbourne 2nd Half 2018 report. € PRD Affordable and Liveable Property Guide Melbourne 1st Half 2019 report. ¥ PRD Affordable and Liveable Property Guide Melbourne 1st Half 2020 report. ₴ PRD Affordable and
Liveable Property Guide Melbourne 2nd Half 2020 report. Source: APM Pricefinder, SQM Research, Cordell Connect, Department of Small Jobs and Business, Google Maps. © PRD 2021.
PROPERTY CLOCK - UNITS
                                                                                                                                                                   Peak

                                                                                                                                Upswing                                                        Downswing

                                                                                                                                                                 Bottom

AFFORDABLE & LIVEABLE UNIT SUBURBS
       NORTHCOTE 3070                                                         LOWER PLENTY 3093                                                               PASCOE VALE 3044

                                                         1 Bed                                                                         1 Bed                                                                        1 Bed
                                                         2 Bed                                                                         2 Bed                                                                        2 Bed
                                                         3+ Bed                                                                        3+ Bed                                                                       3+ Bed

Located about 5.0km from the                                                  Located about 15.0km from the                                               Located about 8.0km from the
Melbourne CBD.                                                                Melbourne CBD.                                                              Melbourne CBD.
Median Unit Price          $595,000                                           Median Unit Price          $630,000                                         Median Unit Price          $630,000
• 1 Bed Median Price $417,000                                                 • 1 Bed Median Price $329,000*                                              • 1 Bed Median Price $200,000*
• 2 Bed Median Price $630,000                                                 • 2 Bed Median Price $533,000                                               • 2 Bed Median Price $590,000
• 3+ Bed Median Price $933,000                                                • 3+ Bed Median Price $817,000                                              • 3+ Bed Median Price $723,000
Northcote is the closest affordable                                           Lower Plenty, north of Melbourne                                            Pascoe Vale recorded a 2.4%**
and liveable suburb to Melbourne                                              CBD, recorded a surge in median                                             median house price growth from 2019
CBD. A unit rental yield of 3.6% is                                           price growth of 12.5%** from 2019 to                                        to 2020/21, which signals a resilient
attractive to investors, as it is higher                                      2020/21. This is the highest median                                         market despite COVID-19 lockdowns
than Melbourne Metro’s and yet close                                          price growth out of the affordable and                                      and restrictions. Current investors are
to the CBD. This is partly due to low                                         liveable suburbs chosen, which shows                                        benefitting from attractive rental yields
vacancy rates, which at 2.7% is well                                          the area’s resilience and potential.                                        of 3.8%. Pascoe Vale recorded 4.0%,
below Melbourne Metro’s 4.4%. There                                           Those with a property investment                                            vacancy rate, just below Melbourne
is a healthier rental demand, which is                                        benefit from rental yields of 3.5%,                                         Metro’s (4.4%), indicating a healthier
conducive for investment. The area                                            above Melbourne Metro’s 3.3%. This                                          rental demand. Pascoe Vale is highly
ticks many liveability boxes, as it is                                        is in conjunction with a lower vacancy                                      liveable for residents as it is in close
well positioned within the inner CBD,                                         rate of 2.1%, well below Melbourne                                          proximity of Essendon Fields Airport,
thus served by medical centres,                                               Metro’s 4.4%, which signals quicker                                         DFO Essendon, and public transport.
schools, shops, public transport and                                          occupancy of rental units. $12.5M^ of                                       $14.1M^ of developments is planned
parks. A total of $10.0M^ of projects                                         project developments is planned in the                                      in the 1st half of 2021, with a main
are set to commence in the 1st half of                                        1st half of 2021, with a main focus on                                      focus on residential and mixed-use
2021, with a key focus on mixed-use,                                          commercial projects. Japara Aged                                            projects. This will create local jobs,
commercial and residential projects.                                          Care ($11.0M) is a major project that                                       which will have a positive effect on
This will not only improve liveability                                        will attract a new demographic into the                                     economic growth. 3 dwellings and 36
aspects but also stimulate economic                                           area and create local employment                                            townhouses are planned, opportune
growth, through local job creation.                                           opportunities.                                                              for first home buyers.

^Quoted estimated values of projects are based on reported land/construction values as stated by the relevant data authority and do not signify their commercial/resale value. *Median price is quoted as an indication only
due to having less than 20 sales transactions. **Median price growth quoted captures sale transactions from 1st January 2020 to 31st March 2021, or Q1 2020 – Q1 2021. µ PRD Affordable and Liveable Property Guide
Melbourne 2nd Half 2018 report. € PRD Affordable and Liveable Property Guide Melbourne 1st Half 2019 report. ¥ PRD Affordable and Liveable Property Guide Melbourne 1st Half 2020 report. ₴ PRD Affordable and
Liveable Property Guide Melbourne 2nd Half 2020 report. Source: APM Pricefinder, SQM Research, Cordell Connect, Department of Small Jobs and Business, Google Maps. © PRD 2021.
PROJECT DEVELOPMENT MAP 1ST HALF 2021*

                                                                                                                                                                                LEGEND
                                                                                                                                                                                    Commercial
                                                                                                                                                                                    Infrastructure
                                                                                                                                                                                    Industrial
                                                                                                                                                                                    Mixed-use
                                                                                                                                                                                    Residential

                                                                                                                                                                      $531.5M

                                                                                                                                                                  $3.0B
                                                                                                                                                                                                     $6.5B

                                                                                                                                                               $3.5B

                                                                                                                                                                                    $2.3B

                                                                                                                                                      Estimated
Location                                     Project£                                                                    T yp e                                                                 Suburb
                                                                                                                                                       Valueµ

   1       Footscray Hospital                                                                                        Commercial                      $1,495,000,000                            Footscray

   2       Seqirus Biotech Manufacturing Facility                                                                    Commercial                       $800,000,000                        Melbourne Airport

   3       New Epping Health Precinct (Former Epping Quarry/Waste Landfill Site)                                     Commercial                       $600,000,000                               Epping

   4       King Street Office Tower (Former Great Western Hotel Site)                                                Commercial                       $250,000,000                             Melbourne

   5       Como Centre South Yarra                                                                                   Commercial                       $236,000,000                            South Yarra

   6       Next Dc M3 - Phase 1                                                                                      Commercial                       $229,771,000                         Footscray West

   7       The Village Alphington Serviced Apartments (Former Amcor Site)                                            Commercial                       $200,000,000                             Alphington

   8       The Walk Arcade Redevelopment Holiday Inn Hotel & Hotel Indigo                                            Commercial                       $200,000,000                             Melbourne

   9       Meriton Hotel                                                                                             Commercial                       $150,000,000                             Melbourne

   10      Meriton Suites Hotel - Duplicate Entry Refer To Id 2124491                                                Commercial                       $150,000,000                             Melbourne
           Bell Street, Cramer Street, Murray Road & Oakover Road Preston Rail Level
   11                                                                                                               Infrastructure                    $564,000,000                               Preston
           Crossing Removal - Mernda Line
   12      Doncaster Busway                                                                                         Infrastructure                    $500,000,000                         Doncaster East

   13      Glenroy Road Rail Level Crossing Removal - Craigieburn Line                                              Infrastructure                    $285,600,000                               Glenroy

   14      Dame Phyllis Frost Womens Prison (Dpfc) 106 Bed Expansion                                                Infrastructure                    $237,000,000                             Ravenhall

   15      Victoria Barracks Melbourne                                                                              Infrastructure                    $230,000,000                             Southbank

   16      Ferguson Street Rail Level Crossing Removal - Williamstown Line                                          Infrastructure                    $192,000,000                           Williamstown

   17      Raaf Base Point Cook                                                                                     Infrastructure                    $160,000,000                             Point Cook

   18      Queens Place Tower Stage 2- (685 Apartments)                                                               Mixed Use                       $750,000,000                             Melbourne

   19      Neilson Place Mixed Use Development - Stage 1- (577 Apartments)                                            Mixed Use                       $180,000,000                             Footscray

   20      The Marker West Melbourne- (207 Apartments)                                                                Mixed Use                       $180,000,000                         West Melbourne

                                                    * Project development map showcases a sample of upcoming projects only, due to accuracy of addresses provided by the data provider for geocoding purposes.
                                                    £ Top Projects are based on suburbs located within a 20km radial distance of the Melbourne CBD.
                                                    µ Estimated value is the value of construction costs provided by relevant data authority, it does not reflect the project’s sale/commercial value.
                                                    Source: Cordell Connect database, ESRI ArcGIS.
                                                    © PRD 2021.
ABOUT PRD RESEARCH
PRD Research Division provides reliable, unbiased, and authoritative
property research and consultancy to clients in metro and regional locations
across Australia

Our extensive research capability and specialised approach ensure our
clients can make the most informed and financially sound decisions about
residential and commercial properties.

OUR KNOWLEDGE
Access to accurate and objective research is the foundation of all good
property decisions.

As the first and only truly knowledge based property services company,
PRD shares experience and knowledge to deliver innovative and effective
solutions to our clients.

We have a unique approach that integrates people, experience, systems                                                                    OUR SERVICES
and technology to create meaningful business connections. We focus on
understanding new issues impacting the property industry; such as the
                                                                                                                                         INCLUDE
environment and sustainability, the economy, demographic and                                                                             •   Advisory and Consultancy
psychographic shifts, commercial and residential design; and forecast future
implications around such issues based on historical data and fact.                                                                       •   Market Analysis including

                                                                                                                                             Profiling and Trends
OUR PEOPLE
                                                                                                                                         •   Primary Qualitative and
Our research team is made up of highly qualified researchers who focus
solely on property analysis.                                                                                                                 Quantitative Research

Skilled in deriving macro and micro quantitative information from multiple                                                               •   Demographic and Target Market
credible sources, we partner with clients to provide strategic advice and
direction regarding property and market performance. We have the added                                                                       Analysis
advantage of sourcing valuable and factual qualitative market research in
order to ensure our solutions are the most well considered and financially                                                               •   Geographic Information Mapping
viable.
                                                                                                                                         •   Project Analysis including
Our experts are highly sought after consultants for both corporate and
government bodies and their advice has helped steer the direction of a                                                                       Product and Pricing
number of property developments and secured successful outcomes for our
                                                                                                                                             Recommendations
clients.
                                                                                                                                         •   Rental and Investment Return
OUR SERVICES
                                                                                                                                             Analysis
Our research services span over every suburb, LGA, and state within
Australia; captured in a variety of standard and customised products.
                                                                                                                                         PRD Research
We have the ability and systems to monitor market movements, demographic                                                                 T +61 7 3229 3344
changes and property trends. We use our knowledge of market sizes, price                                                                 E research@prd.com.au
structure and buyer profiles to identify opportunities for clients and provide
market knowledge that is unbiased, thorough and reliable.                                                                                PRD.com.au

PRD does not give any warranty in relation to the accuracy of the information contained in this report. If you intend to rely upon the
information contained herein, you must take note that the Information, figures and projections have been provided by various
sources and have not been verified by us. We have no belief one way or the other in relation to the accuracy of such information,
figures and projections. PRD will not be liable for any loss or damage resulting from any statement, figure, calculation or any other
information that you rely upon that is contained in the material. Prepared by PRD Research © All medians and volumes are
calculated by PRD Research. Use with written permission only. All other responsibilities disclaimed.
You can also read