Affordable & Liveable Property Guide - Brisbane Metro 2nd Half 2020

 
CONTINUE READING
Affordable & Liveable Property Guide - Brisbane Metro 2nd Half 2020
Affordable & Liveable Property Guide
Brisbane Metro 2nd Half 2020
Affordable & Liveable Property Guide - Brisbane Metro 2nd Half 2020
BRISBANE METRO
                                                                                                                                                     Annual Change^

METHODOLOGY                                                                                                                                          Sales

                                                                                                                                                     Median Price
This affordable and liveable property guide for Brisbane Metro analyses all suburbs
within a 20km radius of the Brisbane CBD. The following criteria were considered:
                                                                                                                                                     Rental Price
•    Property trends criteria – all suburbs have a minimum of 20 sales transactions for
     statistical reliability purposes. Based on market conditions suburbs have either
     positive, or as close as possible to neutral price growth between 2019 to 2020*.                                                                Sales
•    Investment criteria – as of September 2020, suburbs considered will have an on-
     par or higher rental yield than Brisbane Metro, and an on-par or lower vacancy rate.                                                            Median Price
•    Affordability criteria – identified affordable and liveable suburbs have a median                                                               Rental Price
     price below a set threshold. This was determined by adding percentage premiums
     to the Queensland (QLD) average home loan, which was $414,426** as of Q2
     2020. Premiums of 38% for houses and 0% for units were added, which were below
     those required to reach Brisbane Metro’s median prices (64% for houses and 5%
     for units). This places the suburbs below Brisbane’s median prices, meaning that
                                                                                                                                           MEDIAN SALE PRICE
     the suburbs identified within this report are more affordable for buyers.
•    Development criteria – suburbs identified must have a high total estimated value
     of future project development for the 2nd half of 2020, as well as a higher proportion
     of commercial and infrastructure projects. This ensures the suburbs show signs of
     sustainable economic growth, in turn positively affecting the property market.                                                          $678K           $435K
•    Liveability criteria – all identified suburbs have low crime rates, availability of
     amenities within a 5km radius (i.e. schools, green spaces, public transport,                                                            HOUSE            UNIT
     shopping centres and health care facilities), and an unemployment rate on-par or
     lower in comparison to the QLD average (as determined by the Department of Jobs                                                       AVERAGE DAYS TO SELL
     and Small Business, June Quarter 2020 release).

RECENT TOP PERFORMERS
                                                                 Median              Median
                                                                                                        Price         Projects
                                                                                                                                              58              73
    Area                  Suburb                  Type            Price               Price
                                                                                                       Growth         2020***
                                                                  2019               2020*                                                   HOUSE            UNIT
                        New Farm                 House        $1,595,000 $1,632,500                     2.4%          $25.0M
    Inner
                        New Farm                   Unit         $587,000           $650,000            10.7%          $25.0M               AVERAGE VENDOR DISC.
                       Chermside                 House          $605,000           $641,000             6.0%         $223.1M
    North
                      Everton Park                 Unit         $445,000           $475,500             6.9%          $30.7M
                     Logan Central               House          $285,100           $290,000             1.7%         $535.9M
                                                                                                                                             -1.6%           -2.5%
    South
                  Upper Mt Gravatt                 Unit         $413,500           $420,000             1.6%          $43.3M
                    Wynnum West                  House          $540,000           $565,000             4.6%          $26.7M                 HOUSE            UNIT
     East
                         Wynnum                    Unit         $430,000           $510,000            18.6%          $24.6M
                         St Lucia                House        $1,235,000 $1,600,000                    29.6%          $41.2M
    West
                        Enoggera                   Unit         $387,500           $455,000            17.4%          $12.6M               MEDIAN RENTAL PRICE

OVERVIEW
Median property prices in Brisbane Metro increased by 4.3% for houses to $678,000
from 2019 to 2020* and softened by 1.1% for units to $435,000. Limited stock and high
demand has supported median price growth for houses, showing resilience throughout                                                            $470           $395
COVID-19. Brisbane Metro houses have continued to show steady price growth in the
past five years, creating confidence for property owners. On the other hand Brisbane                                                         HOUSE            UNIT
Metro units have marginally softened in median price, suggesting excess stock
continues to be absorbed, as supply has halted due to COVID-19. An estimated $4.9B
                                                                                                                                           AVERAGE DAYS TO LET
of development is planned in the 2nd half of 2020, with a focus on infrastructure
projects. Infrastructure projects will further improve liveability for residents whilst
creating local employment opportunities during the construction phase. This will have a
positive effect on economic growth, with a spill-over effect on the real estate market.
*Median price quoted captures sale transactions from 1st January 2020 to 30th September 2020, or Q1 2020 – Q3 2020. **Average home
loan figure is derived from June Quarter 2020 Housing Affordability Report by the Real Estate Institute of Australia (REIA) and Adelaide
Bank. ***Project development is based on aggregate of estimated construction value for residential, commercial, industrial, mixed-use
                                                                                                                                              20             25
and infrastructure projects scheduled to commence in the 2nd half of 2020 as stated by the relevant data authority. ^Annual Change is
reflective of median price change from Q3 2019 to Q3 2020. Figures displayed in infographics are for the period Q3 2020, except for
median sale price, which is reflective of 1st January 2020 to 30th September 2020, or Q1 2020 – Q3 2020.
                                                                                                                                             HOUSE            UNIT
Source: APM Pricefinder, REIA, SQM Research, Cordell Connect, Department of Jobs and Small Business. © PRD Real Estate 2020.
Affordable & Liveable Property Guide - Brisbane Metro 2nd Half 2020
AVERAGE VENDOR DISCOUNT                                                                                                                            KEY COMMENTS
                                    0.0%                                                                                                                      Average vendor discounts between Q3 2019 and Q3
Change from Listing to Sale Price

                                                                                                                                                              2020 have tightened for both property types, to -1.6%

                                                                                                 -1.3%
                                    -0.5%

                                                                                                                                      -1.6%
                                                                                                                                                              for houses and -2.5% for units. This indicates that

                                                                                                          -2.1%
                                    -1.0%

                                                                                 -2.5%

                                                                                                                                              -2.5%
                                                                                                                                                              Brisbane Metro market provides unique opportunities.

                                                                                                                   -2.7%
                                                                 -2.9%

                                                                                         -3.1%

                                                                                                                           -3.3%
                                    -1.5%
                                                 -3.4%

                                                                         -3.4%
                                                                                                                                                              Sellers can achieve a final sale price closer to their first
                                                         -3.8%

                                    -2.0%                                                                                                                     list price, whilst buyers can still benefit from a discount.
                                    -2.5%
                                                                                                                                                              The dominant proportion of houses sold in Brisbane
                                    -3.0%
                                                                                                                                                              Metro across 2020# were in the lower-middle price
                                    -3.5%                                                                                                                     bracket of $500,000 to $700,000 (35.9%). Units also
                                    -4.0%                                                                                                                     saw high buyer activity within the lower-middle price
                                                 Q2 2019         Q3 2019         Q4 2019         Q1 2020           Q2 2020           Q3 2020                  bracket, of $300,000 to $400,000 (27.4%). Brisbane
                                                                             House                          Unit                                              Metro provides excellent opportunities for first home
                                                                                                                                                              buyers compared with Sydney and Melbourne, in terms
                                                                                                                                                              of comparable affordability.
           MARKET PERFORMANCE
                                                                                 House Sales                                       Unit Sales                         House Median                Unit Median

                $800,000                                                                                                                                                                                            25,000

                $700,000
                                                                                                                                                                                                                    20,000
                $600,000

                $500,000
                                                                                                                                                                                                                    15,000

                $400,000

                                                                                                                                                                                                                    10,000
                $300,000

                $200,000
                                                                                                                                                                                                                    5,000
                $100,000

                                            $0                                                                                                                                                                      0
                                                                  2016                                   2017                                         2018                   2019                  2020#

           PRICE BREAKDOWN 2020#
               HOUSES SOLD                                                                                                                                   UNITS SOLD

                                                  12.1%                                                                                                                         12.0%
                                                                         18.7%                                                                                    21.1%
                                                                                                            Less than $499,999                                                                       Less than $299,999
                                       9.0%
                                                                                                            $500,000 to $699,999                                                                     $300,000 to $399,999

                                                                                                            $700,000 to $899,999                                                         27.4%       $400,000 to $499,999
                                                                                                                                                              13.8%
                                                                                                            $900,000 to $1,099,999                                                                   $500,000 to $599,999
                                      24.3%
                                                                            35.9%                           $1,100,000 and above                                                                     $600,000 and above
                                                                                                                                                                        25.7%

                                                                                                         #2020encapsulates sales transactions for 2020 (01/01/2020 – 30/09/2020) only.
                                                                                                         Source: APM Pricefinder.
                                                                                                         © Copyright PRD 2020.
Affordable & Liveable Property Guide - Brisbane Metro 2nd Half 2020
BRISBANE METRO MEDIAN HOUSE PRICE 2020*
20KM FROM CBD
                                                                                                                4

                                                                                                                     2       1

                                                                                                                         5

                                                               3

                                                                   BRISBANE AFFORDABLE & LIVEABLE SUBURBS
     LEGEND                                                        RENTAL YIELD
                      Data not available
                      $0 - $500,000                                                     Suburb                   House                Suburb     Unit

                      $500,000 - $800,000
                      $800,000 - $1,000,000                            1              Boondall                    3.9%           4    Griffin    6.0%

                      $1,000,000 - $2,000,000
                                                                       2               Taigum                     5.3%           2    Taigum     6.2%
                      $2,000,000+
                      20km from CBD
                                                                       3                Moggill                   4.2%           5   Coorparoo   5.4%
     Translucent colours for
Affordable & Liveable Property Guide - Brisbane Metro 2nd Half 2020
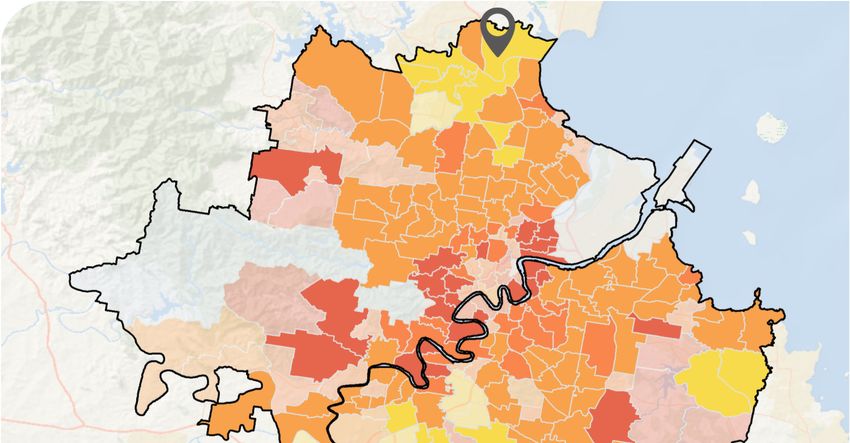
RENTAL GROWTH 2020 €
In September 2020, house rental yields in Brisbane Metro were recorded at 3.7%. In the 12 months to Q3 2020, the median
house rental price grew by 2.2% to $470 per week, while average days on the market declined by 25.9% (to 20 days).
Overall, the Brisbane Metro rental house market has remained resilient throughout COVID-19.

One bedroom units provided the greatest annual rental growth (+3.0%) to reach $340 per week. A softening in the median
rental price for 4+ bedroom houses (-0.9% to $545 per week) is indicative of tightened household finances due to COVID-19
employment conditions. Tenants may be seeking rental properties with fewer bedrooms to reduce their rent outgoings.

In September 2020, Brisbane Metro recorded a low vacancy rate of 2.0%, well below that of Sydney Metro (3.5%) and
Melbourne Metro (3.8%). Vacancy rates in Brisbane Metro are now at a historical three-year low, well below the Real Estate
Institute of Australia’s healthy benchmark of 3.0%, and continuing on a declining trend even amidst COVID-19 conditions.
This confirms there is an ongoing healthy rental demand, which gives investors confidence.

      2 Bed House                      3 Bed House                     4+ Bed House                        1 Bed Unit                 2 Bed Unit               3+ Bed Unit

        +1.3%                            +0.0%                                -0.9%                         +3.0%                      +1.3%                      +2.3%
       $390                             $430                              $545                             $340                       $395                      $450

RENTAL VACANCY RATES 2020
4.5%

4.0%

3.5%

3.0%

2.5%

2.0%

1.5%

1.0%

0.5%

0.0%
           Sep-17

                          Dec-17

                                        Mar-18

                                                       Jun-18

                                                                     Sep-18

                                                                                      Dec-18

                                                                                                  Mar-19

                                                                                                                    Jun-19

                                                                                                                             Sep-19

                                                                                                                                        Dec-19

                                                                                                                                                   Mar-20

                                                                                                                                                               Jun-20

                                                                                                                                                                             Sep-20

                    Sydney Metro                            Brisbane Metro                          Melbourne Metro                        REIA 'Healthy' Benchmark

RENTAL YIELD 2020 §

       3.7%                             2.4%                                  2.6%                         5.2%                       3.5%                  3.6%

      Brisbane                           Sydney                          Melbourne                         Brisbane                   Sydney                Melbourne
       Metro                              Metro                            Metro                            Metro                      Metro                  Metro

€ Annual rental growth is a comparison between 2019 and 2020 (01/01/2020 – 30/09/2020) house median rent figures.
§ Rental yields shown are as reported at September 2020.
Source: APM Pricefinder, SQM Research. © Copyright PRD Real Estate 2020.
Affordable & Liveable Property Guide - Brisbane Metro 2nd Half 2020
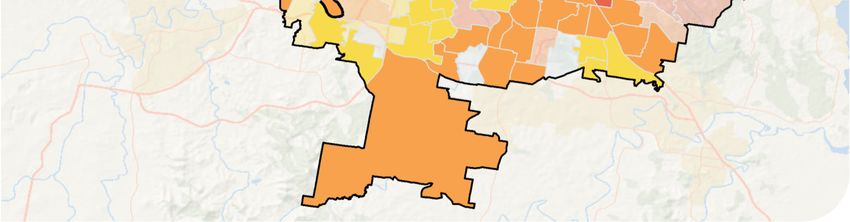
PROPERTY CLOCK - HOUSES
                                                                                                                                                   Peak

                                                                                                                   Upswing                                                  Downswing

                                                                                                                                                 Bottom

AFFORDABLE & LIVEABLE HOUSE SUBURBS
       BOONDALL 4034                                                         TAIGUM 4018                                                       MOGGILL 4070

                                                    2 Bed                                                              2 Bed                                                             2 Bed
                                                    3 Bed                                                              3 Bed                                                             3 Bed
                                                    4+ Bed                                                             4+ Bed                                                            4+ Bed

Located about 11.8km from the                                         Located about 13.1km from the                                        Located about 16.8km from the
Brisbane CBD.                                                         Brisbane CBD.                                                        Brisbane CBD.
Median House Price          $534,000                                  Median House Price        $537,000                                   Median House Price          $570,000
• 2 Bed Median Price $465,000*                                        • 2 Bed Median Price $427,000*                                       • 2 Bed Median Price N/A
• 3 Bed Median Price $510,000                                         • 3 Bed Median Price $520,000                                        • 3 Bed Median Price $735,000*
• 4+ Bed Median Price $590,000                                        • 4+ Bed Median Price $570,000                                       • 4+ Bed Median Price $552,000
Boondall is north of the Brisbane CBD                                 Taigum, also north of the Brisbane                                   Moggill recorded a healthy median
and is the most affordable of the three                               CBD, recorded a median price growth                                  house price growth of 1.6%** amidst
affordable and liveable suburbs                                       of 4.9%** from 2019 to 2020, which is                                COVID-19, from 2019 to 2020. This
chosen. From 2019 to 2020 median                                      the highest growth among the three                                   suggests there is still high demand in
house prices grew by 2.3%**,which                                     chosen suburbs. Taigum records the                                   the area, despite having the highest
suggests continued growth in the                                      highest price growth out of the three                                price out of the three chosen suburbs.
future. Boondall recorded low vacancy                                 affordable and liveable suburbs                                      Investors are benefitting from rental
rates of 0.9%, well below Brisbane                                    chosen, which shows the area’s                                       yields of 4.2%. Moggill recorded a
Metro’s 2.0%. This indicates a                                        strong potential. Investors are                                      record low vacancy rate of 0.5% in
healthier rental demand and is highly                                 currently benefiting from rental yields                              September 2020, well below Brisbane
conducive for investment. Boondall                                    of 5.3%, well above Brisbane Metro’s                                 Metro (2.0%), thus indicating a
ticks many liveability boxes as it is                                 3.7%. This is in conjunction with a                                  healthier rental demand. Moggill is
close to schools, medical centres,                                    significantly low vacancy rate of 0.9%,                              close to the Bellbowrie shopping
public transport, shops, and parks. It                                below Brisbane Metro's 2.0%, thus                                    centre, Moggill State School, public
is also home of the Brisbane                                          solidifying Taigum as an investment                                  transport and the M2 Highway -
Entertainment Centre. About $44.7M^                                   hotspot. About $25.0M^ worth of                                      connecting to Brisbane, Ipswich and
of projects will start in the 2nd half of                             developments are planned in the 2nd                                  Gold Coast. Moggill Village Shopping
2020, with a focus on residential                                     half of 2020, in the form of Handford                                Centre ($30.0M) is a key commercial
projects. This will help first home                                   Road Townhouses, which will create                                   project that will benefit the area, as it
buyers, through accessing multiple                                    105 townhouses over 3 stages. This                                   will create new jobs pre and post-
Federal and State government grants.                                  will include pool and BBQ facilities.                                construction.

^Quoted estimated values of projects are based on reported land/construction values as stated by the relevant data authority and do not signify their commercial/resale value. *Median price is quoted as
an indication only due to having less than 20 sales transactions. **Median price growth quoted captures sale transactions from 1st January 2020 to 30th September 2020, or Q1 2020 – Q3 2020.
Source: APM Pricefinder, SQM Research, Cordell Connect, Department of Small Jobs and Business, Google Maps. © PRD Real Estate 2020.
Affordable & Liveable Property Guide - Brisbane Metro 2nd Half 2020
PROPERTY CLOCK - UNITS
                                                                                                                                                   Peak

                                                                                                                   Upswing                                                  Downswing

                                                                                                                                                 Bottom

AFFORDABLE & LIVEABLE UNIT SUBURBS
             TAIGUM 4018                                                    GRIFFIN 4503                                                     COORPAROO 4151

                                                    1 Bed                                                              1 Bed                                                             1 Bed
                                                    2 Bed                                                              2 Bed                                                             2 Bed
                                                    3+ Bed                                                             3+ Bed                                                            3+ Bed

Located about 13.1km from the                                         Located about 18.8km from the                                        Located about 3.3km from the
Brisbane CBD.                                                         Brisbane CBD.                                                        Brisbane CBD.
Median Unit Price         $325,000                                    Median Unit Price           $334,000                                 Median Unit Price         $415,000
• 1 Bed Median Price N/A                                              • 1 Bed Median Price N/A                                             • 1 Bed Median Price $310,000*
• 2 Bed Median Price $300,000*                                        • 2 Bed Median Price N/A                                             • 2 Bed Median Price $379,000
• 3+ Bed Median Price $325,000                                        • 3+ Bed Median Price $295,000*                                      • 3+ Bed Median Price $520,000
Taigum is featured twice in the 2nd                                   Griffin is north of Brisbane’s CBD, and                              Coorparoo is the closest affordable
half of 2020 guide as an affordable                                   has an attractive median unit price                                  and liveable suburb to the Brisbane
and liveable suburb, for houses and                                   whilst ticking all the liveability factors                           CBD. From 2019 to 2020 median unit
units. Taigum recorded median unit                                    such as with schools, parks, public                                  prices grew by 6.1%**. A unit rental
price growth of 1.0%** from 2019 to                                   transport options, and a large                                       yield of 5.4% (as of September 2020),
2020 and has the most affordable                                      shopping centre (Westfield North                                     above Brisbane Metro’s (5.2%), has
median unit price out of the three                                    Lakes). Investors benefited from                                     attracted many investors into the
chosen suburbs. Investors benefit                                     attractive unit rental yields of 6.0%,                               area, due to its proximity to the CBD.
from extraordinary unit rental yields of                              above the Brisbane Metro’s 5.2%. It                                  Vacancy rates are 1.6%, which is
6.2%, which is well above Brisbane                                    has a significantly low vacancy rate of                              lower than Brisbane Metro’s 2.0%.
Metro’s 5.2%. This combined with a                                    0.8%, much lower than Brisbane                                       This indicates a healthier rental
low vacancy rate of 0.9%, well below                                  Metro’s 2.0%, which makes Griffin an                                 demand, which is highly conducive for
Brisbane Metro's 2.0%, makes                                          ideal investment suburb.                                             investment. Coorparoo ticks many
Taigum an ideal investment suburb.                                    Approximately $27.5M^ worth of                                       boxes as it is well serviced with
The 2nd half of 2020 will see                                         developments are planned in the 2nd                                  medical centres, schools, shops,
approximately $25.0M^ worth of                                        half of 2020, with a main focus on                                   public transport options and parks.
project developments, with a focus on                                 residential projects. A key project is                               Work on a total of $31.9M^ of
residential projects. This will help first                            the Goodrich Road East Townhouses                                    developments is set to commence in
home buyers own a home, through                                       ($22.5M), adding 75 townhouses in 2                                  the 2nd half of 2020, with a large
accessing multiple Federal and State                                  stages, including a swimming pool,                                   focus on mixed use and residential
government grants.                                                    recreation area, and BBQ patios.                                     projects.

^Quoted estimated values of projects are based on reported land/construction values as stated by the relevant data authority and do not signify their commercial/resale value. *Median price is quoted as
an indication only due to having less than 20 sales transactions. **Median price growth quoted captures sale transactions from 1st January 2020 to 30th September 2020, or Q1 2020 – Q3 2020.
Source: APM Pricefinder, SQM Research, Cordell Connect, Department of Small Jobs and Business, Google Maps. © PRD Real Estate 2020.
Affordable & Liveable Property Guide - Brisbane Metro 2nd Half 2020
PROJECT DEVELOPMENT MAP 2ND HALF 2020*

                                                                                                                                                          $275.4M

                                                                                                                                                                                              $1.1B

                                                                                                                                                         $2.1B                                 $794.8M

                                                                                                                                                                                   $593.3M

                                                                                                                                                      Estimated
Location                                       Project£                                                                  Type                                                                  Suburb
                                                                                                                                                       Valueµ

   1       Cross River Rail (RIS Package)                                                                           Infrastructure                   $1,000,000,000                           Bowen Hills

   2       Logan Water Infrastructure Program Partnership                                                           Infrastructure                    $520,000,000                          Logan Central

   3       Ozcare Newstead                                                                                           Commercial                       $200,000,000                             Newstead

   4       Lake@Waterfront Precinct                                                                                   Mixed-Use                       $200,000,000                             Newstead

   5       Woolworths Distribution Facility Heathwood                                                                Commercial                       $148,000,000                            Heathwood

   6       Oxley Creek Revitalisation - Overall Project                                                             Infrastructure                    $100,000,000                               Rocklea

   7       Neville Bonner Bridge                                                                                    Infrastructure                    $100,000,000                         South Brisbane

   8       Ann Street Office Tower                                                                                   Commercial                        $86,600,000                         Fortitude Valley

   9       Aveo Carindale Retirement Village Redevelopment Remaining Stages                                          Commercial                        $80,000,000                              Carindale

   10      Hope Street Mixed Use Building (128 Units)                                                                 Mixed-Use                        $75,000,000                         South Brisbane

   11      Silk Mixed Use Development Building 1 (178 Units)                                                          Mixed-Use                        $75,000,000                         Woolloongabba

   12      Bernborough Ascot Stages 2-4                                                                              Commercial                        $74,000,000                                Ascot

   13      Coles Distribution Facility                                                                               Commercial                        $60,000,000                              Redbank

   14      Northern Transitway                                                                                      Infrastructure                     $53,000,000                             Chermside

   15      Redbank Motorway Estate Logistics Facility                                                                  Industrial                      $50,000,000                              Redbank

   16      Dexus Industrial Estate Richlands                                                                           Industrial                      $50,000,000                             Richlands

   17      Kedron To Chermside Northern Transitway Bus Lane                                                         Infrastructure                     $50,000,000                             Chermside

   18      Wickham Street Mixed Use Development (136 Units)                                                           Mixed-Use                        $50,000,000                         Fortitude Valley

   19      Thomas & Charlotte Streets Mixed Use Development (143 Units)                                               Mixed-Use                        $44,000,000                             Chermside

   20      Boggo Road Gaol Precinct                                                                                 Infrastructure                     $42,100,000                            Dutton Park

                                                    * Project development map showcases a sample of upcoming projects only, due to accuracy of addresses provided by the data provider for geocoding purposes.
                                                    £ Top Projects are based on suburbs located within a 20km radial distance of the Brisbane CBD.
                                                    µ Estimated value is the value of construction costs provided by relevant data authority, it does not reflect the project’s sale/commercial value.
                                                    Source: Cordell Connect database, ESRI ArcGIS
                                                     © PRD Real Estate 2020.
Affordable & Liveable Property Guide - Brisbane Metro 2nd Half 2020
ABOUT PRD RESEARCH
PRD Research Division provides reliable, unbiased, and authoritative
property research and consultancy to clients in metro and regional locations
across Australia

Our extensive research capability and specialised approach ensures our
clients can make the most informed and financially sound decisions about
residential and commercial properties.

OUR KNOWLEDGE
Access to accurate and objective research is the foundation of all good
property decisions.

As the first and only truly knowledge based property services company,
PRD shares experience and knowledge to deliver innovative and effective
solutions to our clients.

We have a unique approach that integrates people, experience, systems                                                                    OUR SERVICES
and technology to create meaningful business connections. We focus on
understanding new issues impacting the property industry; such as the
                                                                                                                                         INCLUDE
environment and sustainability, the economy, demographic and                                                                             • Advisory and consultancy
psychographic shifts, commercial and residential design; and forecast future
implications around such issues based on historical data and fact.                                                                       • Market Analysis including

                                                                                                                                           profiling and trends
OUR PEOPLE
                                                                                                                                         • Primary qualitative and
Our research team is made up of highly qualified researchers who focus
solely on property analysis.                                                                                                               quantitative research

Skilled in deriving macro and micro quantitative information from multiple                                                               • Demographic and target market
credible sources, we partner with clients to provide strategic advice and
direction regarding property and market performance. We have the added                                                                     Analysis
advantage of sourcing valuable and factual qualitative market research in
order to ensure our solutions are the most well considered and financially                                                               • Geographic information mapping
viable.
                                                                                                                                         • Project Analysis including product
Our experts are highly sought after consultants for both corporate and
government bodies and their advice has helped steer the direction of a                                                                     and pricing recommendations
number of property developments and secured successful outcomes for our
                                                                                                                                         • Rental and investment return
clients.
                                                                                                                                           analysis
OUR SERVICES
Our research services span over every suburb, LGA, and state within
                                                                                                                                         PRD Research
Australia; captured in a variety of standard and customised products.
                                                                                                                                         T +61 7 3229 3344
We have the ability and systems to monitor market movements, demographic                                                                 E research@prd.com.au
changes and property trends. We use our knowledge of market sizes, price
structure and buyer profiles to identify opportunities for clients and provide                                                           PRD.com.au
market knowledge that is unbiased, thorough and reliable.

PRD does not give any warranty in relation to the accuracy of the information contained in this report. If you intend to rely upon the
information contained herein, you must take note that the Information, figures and projections have been provided by various
sources and have not been verified by us. We have no belief one way or the other in relation to the accuracy of such information,
figures and projections. PRD will not be liable for any loss or damage resulting from any statement, figure, calculation or any other
information that you rely upon that is contained in the material. Prepared by PRD Research © All medians and volumes are
calculated by PRD Research. Use with written permission only. All other responsibilities disclaimed.
Affordable & Liveable Property Guide - Brisbane Metro 2nd Half 2020
You can also read