2020 Presidential Election Outlook - October 2019 - Stable ...

Page created by Mark Pierce
 
CONTINUE READING
2020 Presidential Election Outlook - October 2019 - Stable ...
2020 Presidential
                                                               Election Outlook
                                                                              October 2019

    PRIVATE AND CONFIDENTIAL. This document is being distributed to you for your information only as a
    client of Goldman Sachs and should not be distributed to others. This document is not a product of
    Goldman Sachs Global Investment Research. The material contained herein has been prepared and is
1   based on information obtained by us from publicly available sources.
2020 Presidential Election Outlook - October 2019 - Stable ...
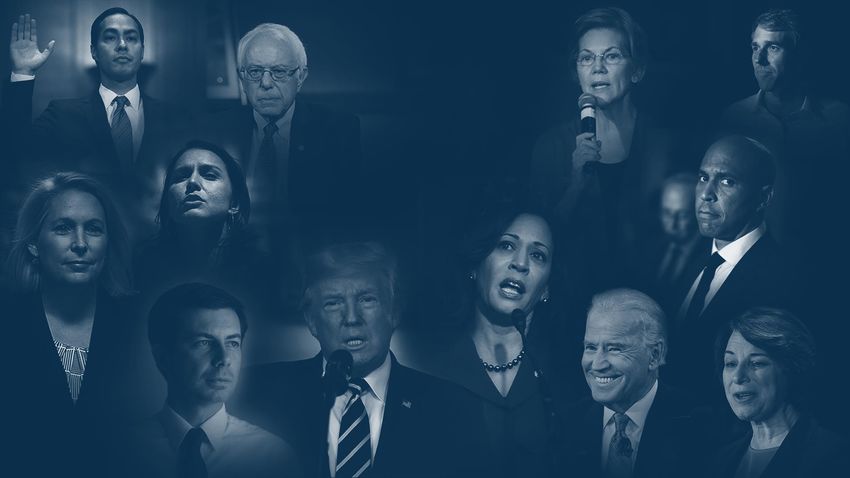
2020 Presidential Election:
    The Democratic Field                                                                                                                                                                            Candidates who have
                                                                                                                                                                                                    qualified for the fourth debate

         Bernie Sanders                    Joe Biden                     Elizabeth Warren                   Joe Sestak           Marianne Williamson                 Tom Steyer                     Amy Klobuchar
           78 yo. Senator                77 yo. Fmr. VP                    70 yo. Senator           67 yo. Fmr. Congressman              66 yo. Author           62 yo. Fmr. CEO/Activist              59 yo. Senator
                VT                            DE                                MA                             PA                            TX                           CA                               MN

         John Delaney                  Michael Bennet                    Kamala Harris                Steve Bullock                 Cory Booker                   Beto O’Rourke                      Julian Castro
      56 yo. Fmr. Congressman            55 yo. Senator                    55 yo. Senator              53 yo. Governor               50 yo. Senator            47 yo. Fmr. Congressman           45 yo. Fmr. HUD Secretary
               MD                            CO                                CA                             MT                            NJ                           TX                                TX

                            Tim Ryan                 Wayne Messam                       Andrew Yang                  Seth Moulton                    Tulsi Gabbard                Pete Buttigieg
                      45 yo. Congressman                  44 yo. Mayor                 44 yo. Businessman           41 yo. Congressman            38 yo. Congresswoman               37 yo. Mayor
                                OH                            FL                              NY                          MA                              HI                                IN

2
2020 Presidential Election Outlook - October 2019 - Stable ...
The First Tier

Second Quarter Fundraising                                                                      National Democratic Primary

1.               Buttigieg $24.9 Million                                                        1.       Biden 31%

2.               Biden $22.0 Million                                                            2.       Warren 25%

3.               Warren $19.2 Million                                                           3.       Sanders 14%

4.               Sanders $18.0 Million                                                          4.       Buttigieg 7%

5.               Harris $11.8 Million                                                           5.       Harris 5%

6.               Booker $4.5 Million                                                            6.       Yang 4%
3 | Source: Federal Election Commission; NBC News / Wall Street Journal Poll (September 2019)
2020 Presidential Election Outlook - October 2019 - Stable ...
National Depth of Support

                                                  First Choice                             +   Second Choice   =   TOTAL

                Warren                                        25%                          +       21%         =    46%

                Biden                                         31%                          +       11%         =    42%

                Sanders                                       14%                          +       16%         =    30%

                Buttigieg                                      7%                          +       12%         =    19%

                Harris                                         5%                          +        8%         =    13%

4 | Source: Federal Election Commission; NBC News / Wall Street Journal Poll (July 2019)
2020 Presidential Election Outlook - October 2019 - Stable ...
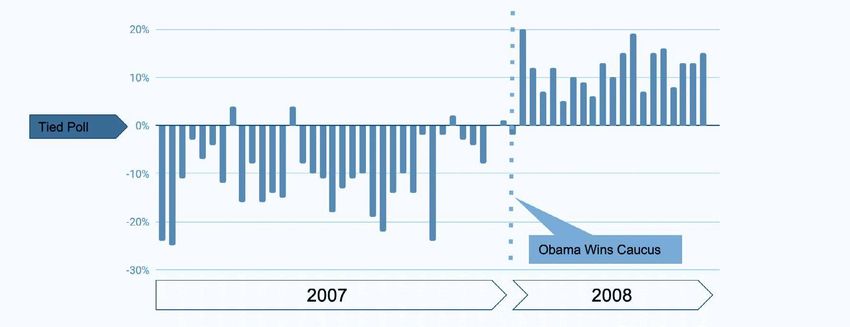
The Ideological Divide

Liberal Democrats                                  Moderate and Conservative Democrats
(~48% of primary voters)                           (~49% of primary voters)

1.                Warren 36%                       1.      Biden 42%

2.                Biden 19%                        2.      Warren 15%

2.                Sanders 19%                      3.      Sanders 7%

4.                Harris 7%                        4.      Buttigieg 7%

5 | Source: NBC News / WSJ Poll (September 2019)
2020 Presidential Election Outlook - October 2019 - Stable ...
The Generational Divide

   18-34 Year Olds                                                       35-49 Year Olds

     Sanders                   Warren                Yang       Biden     Biden      Warren   Sanders     Buttigieg
      33%                      25%                  11%        10%       28%         24%      17%          9%

   50-64 Year Olds                                                       65+ Year Olds

      Biden                    Warren              Buttigieg   Sanders    Biden      Warren   Buttigieg   Sanders
      39%                      25%                  6%          3%       46%         25%       7%          2%

6 | Source: NBC News / WSJ Poll (September 2019)
2020 Presidential Election Outlook - October 2019 - Stable ...
The Racial Divide

White Voters                                       Black Voters

1.                Warren 28%                       1.      Biden 49%

2.                Biden 27%                        2.      Warren 13%

3.                Sanders 14%                      3.      Harris 10%

4.                 Buttigieg 8%                    4.      Sanders 5%

5.                Harris 5%                        5.      Buttigieg 3%

7 | Source: NBC News / WSJ Poll (September 2019)
2020 Presidential Election Outlook - October 2019 - Stable ...
Policy Priorities

                         Top Three issues for All Voters                 Top Three issues for Democratic Voters

        24%                                  18%           14%        36%               20%                 12%
          Health                        Immigration    Job creation   Health             Climate          Job creation
           care                          and border   and economic     care              change          and economic
                                          security       growth                                             growth

8 | Source: NBC News / WSJ Poll (May 2019)
2020 Presidential Election Outlook - October 2019 - Stable ...
A Majority of Democratic Voters Prefer a
                   Candidate Who Proposes Large-Scale Policies

Q. [Among registered Democratic voters] Do you prefer a nominee who proposes larger
   scale policies that might cost more and be harder to pass but could still result in major
                                                                                                54%                      41%
   change or a nominee who pushes for smaller-scale policies that cost less and might           A nominee who proposes   A nominee who proposes
   be easier to pass but that bring less change?                                                large-scale policies     small-scale policies

Democratic voters who prefer a candidate                                                Democratic voters who prefer a candidate
who champions large-scale policies                                                      who champions small-scale policies

              Warren 32%                                                                       Biden 43%

              Biden 21%                                                                        Warren 17%

              Sanders 19%                                                                      Harris 9%

9   | Source: NBC News / Wall Street Journal Poll (September 2019)
2020 Presidential Election Outlook - October 2019 - Stable ...
The View from General Election Voters on
                   Hot Button Democratic Primary Issues

Medicare for All                                               Wealth tax ($1m income +)
       Good idea: 40%                          Bad idea: 55%       Good idea: 61%            Bad idea: 34%

Decriminalizing illegal border crossings                       $15 minimum wage
       Good idea: 27%                          Bad idea: 67%       Good idea: 55%            Bad idea: 34%

National health insurance for illegal immigrants               Green New Deal
       Good idea: 32%                          Bad idea: 62%       Good idea: 60%            Bad idea: 34%

Reparations for slavery                                        Free college tuition for public colleges
       Good idea: 26%                          Bad idea: 63%       Good idea: 51%            Bad idea: 45%

10 | Source: NPR/PBS/Marist Poll (July 2019)
New Dynamics

                    Early Voting                                 First Ballot at
                    Some notable primary states, such            Convention
                    as California, have expanded early           Super delegates are not allowed to
                    voting to one month prior to the             vote if a candidate does not have
                    primary election. California will begin      a majority of pledged delegates,
                    early voting the same day as the             meaning super delegates will not
                    Iowa caucus.                                 be able to decide the winner on the
                                                                 first ballot.

                    Delegate Math                                Super Tuesday is more
                    3,768 pledged delegates are                  super than usual
                    proportionally awarded based on              15 primaries and caucuses will be held
                    candidate performance in each state.         on Super Tuesday, including primaries
                    A candidate must accumulate a majority       in California (416 pledged delegates)
                    (1,885+) in order to win on the first        and Texas (223 pledged delegates).
                    ballot. If no candidate has a majority of    In total, 1,361 pledged delegates will
                    delegates on the first ballot, 715 super     be awarded on March 3, representing
                    delegates (“free agents”) will be eligible   36% of all pledged delegates.
                    to vote on the second ballot.

11
2020 Early State Primary Calendar

February                            March

          Iowa Caucus                    Super Tuesday
     3    (41 pledged delegates)
                                     3   (1,361 pledged delegates)

          New Hampshire Primary
     11   (24 pledged delegates)

          Nevada Caucus
     22   (36 pledged delegates)

          South Carolina Primary
     29   (54 pledged delegates)

12
The Democratic Electorate:
                   First Four Presidential Primary Contests

                                  % White                  % Women            % Bachelor’s +   % 50+   % Liberal   2016 Democratic
                                                                                                                       Primary

                                                                                                                      Clinton
      National                  59%                        56%                 39%             47%     46%          +12.1%
                                                                                                                      Clinton
        Iowa                    91%                        57%                 50%             58%     68%          +0.25%
     New                                                                                                             Sanders
   Hampshire                    93%                        55%                 60%             51%     68%          +22.5%
                                                                                                                      Clinton
      Nevada                    59%                        56%                 46%             58%     70%          +47.4%
      South                                                                                                           Clinton
     Carolina                   35%                        61%                 40%             55%     54%           +5.3%

13 | Source: Pew Research; Gallup; 2016 CNN Exit Polls; Des Moines Register
Iowa Caucus

History of the Caucus                                                     How the Caucus worked in 2016                           New 2020 Caucus Dynamics
• The Iowa caucus dates back to the 1840s                                 • 171,000 Iowa Democratic voters participated in        • Three Reporting Metrics
                                                                            1,683 precinct caucuses at over 1,000 locations
• Since 1972, Iowa has held the distinction of hosting                      in 2016 , reflecting a decline of 69,000 from the
  the first-in-the-nation Democratic caucus. The                            record turnout in 2008 (240,000)
  Republican Party followed suit in 1976.                                                                                         Past Winners
                                                                          • 15% viability threshold after round one.
• The Iowa caucus gained national notoriety in 1976                         Supporters of candidates below 15% at the             • 2016: Clinton
  when “Jimmy Who” leveraged a second place finish                          caucus location re-aligned to viable candidates for
  (behind “uncommitted”) to win the Democratic                              the second and final round. The results were then     • 2008: Obama
  nomination and the general election.                                      tallied.
                                                                                                                                  • 2004: Kerry
• Since 1972, the top vote-getter in the Democratic                       • Only a single metric was reported on caucus night
  caucus has gone on to win the nomination in eight                         which was the share of state delegates that each      • 2000: Gore
  of ten contested races                                                    candidate was able to win through the caucus
                                                                                                                                  • 1992: Harkin
                                                                            process and NOT the raw votes
                                                                                                                                  • 1988: Gephardt
                                                                          • 27 delegates were proportionally awarded based
                                                                            on performance in each of the four congressional
                                                                            districts. 14 delegates were awarded based on
                                                                            delegate support at state convention

14 | Source: Des Moines Register; Iowa Public Television; NPR; AP; Huffington Post
Iowa Democratic Caucus State of Play

First Choice                                                   Second Choice               Net Favorability
            Warren                         Biden                   Warren      Sanders          Warren        Buttigieg
            22%                            20%                     20%         10%              +58           +56
            Sanders                        Buttigieg               Harris      Buttigieg        Harris        Biden
            11%                            9%                      10%         9%               +39           +37
            Harris                                                 Biden                        Sanders
            6%                                                     8%                           +22

*No other candidates above 3%

Only 20% of Iowa Democratic caucusgoers say they have locked in their support for a particular candidate

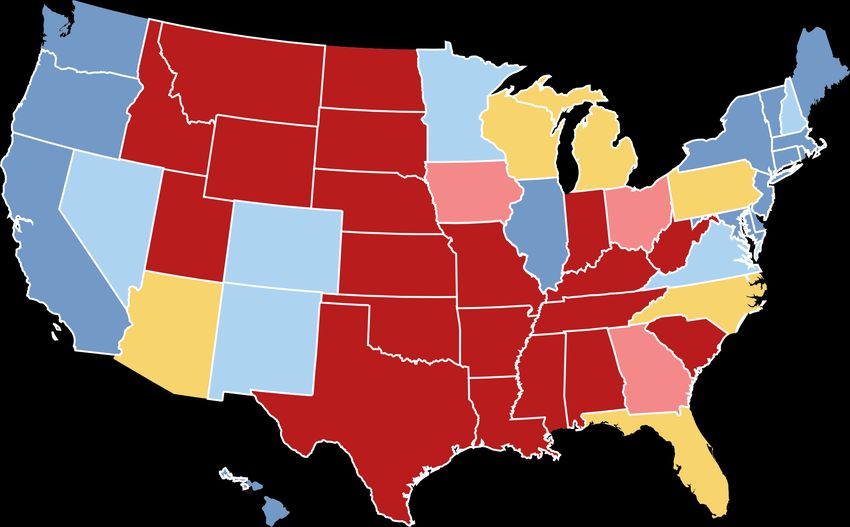
15 | Source: CNN / Des Moines Register Poll (September 2019)
The Iowa Bounce:
                     2008 Obama South Carolina Polling Trend

        Obama’s South South Carolina Polling Margin (2007-2008)

16 | Source: Real Clear Politics
New Hampshire Primary

New Hampshire
24 Pledged Delegates   NH Primary: Feb 11                                                                   Past Winners
                       • The New Hampshire first-in-the-nation primary dates back to 1920                   • 2016: Sanders
                       • 251,000 New Hampshire voters participated in the 2016 Democratic primary, a
                                                                                                            • 2008: Clinton
                         36,000 vote drop from the 2008 record turnout of 287,000
                       • Modified open primary, meaning registered Democrats and Independents may           • 2004: Kerry
                         vote in the primary. Same day voter registration
                                                                                                            • 2000: Gore
                       • Independents represented 40% of New Hampshire Democratic primary voters
                         in 2016. If the Republican primary is not competitive, Independents will be very   • 1992: Tsongas
                         influential in the Democratic primary
                                                                                                            • 1988: Dukakis
                       • 16 delegates proportionally awarded based on candidate performance in the two
                         congressional districts

                       • 8 delegates proportionally awarded based on candidate performance statewide
                       • Since 1972, the winner of the Democratic primary has gone on to become
                         the nominee in five out of ten contested races. Of note, four out of the five
                         New Hampshire winners who became the nominee also won Iowa – the lone
17                       exception was Dukakis in 1988
New Hampshire Democratic Primary State of Play

First Choice                                          Net Favorability
           Warren                         Biden            Warren        Buttigieg

           27%                            25%              +55           +50
                                                           Biden         Sanders
           Sanders                        Buttigieg
           12%                            10%              +42           +35

           Harris                                          Harris

           3%                                              +40

No other candidates above 2%

When it comes to health care, a majority (56%) of New Hampshire Democratic primary voters favor a system
that would allow people to either opt into Medicare or keep their private coverage

18 | Source: Monmouth Poll (September 2019)
Nevada and South Carolina

Nevada                                                                   South Carolina
36 Delegates                                                             54 Delegates
NV Caucus: Feb 22                                      Past Winners      SC Primary: Feb 29                                      Past Winners
• The Nevada caucus became an early nominating         • 2016: Clinton   • South Carolina’s “First in the South” primary began   • 2016: Clinton
  contest in 2008                                                          in 1992
                                                       • 2008: Clinton                                                           • 2008: Obama
• 84,000 Nevada Democrats participated in the 2016                       • 369,000 South Carolinians voted in the 2016
  caucus, a decline of 34,000 from 2008 (118,000)                          Democratic primary, a 161,000 vote drop-off from
                                                                           the record turnout in 2008 (530,000)
• Caucus with 15% viability threshold. Supporters of
  candidates below 15% at the caucus location will                       • Open primary, meaning any registered voter can
  re-align to viable candidates                                            participate
• Must be a registered Democrat to vote (must                            • 35 delegates proportionally awarded based on
  register by caucus day)                                                  candidate performance in the seven congressional
                                                                           districts
• 23 delegates proportionally awarded based on
  performance in each of the four congressional                          • 19 delegates proportionally awarded based on
  districts                                                                candidate performance statewide
• 13 delegates awarded based on delegate support                         • Since 1992, the winner of the Democratic primary
  at state convention                                                      has gone to become the nominee in four out of five
                                                                           contested primaries
19
Nevada Democratic Caucus State of Play

               Democratic Caucus               Among White Voters                  Among Non-White Voters
                                                (59% of electorate)                  (41% of electorate)
                                   Joe                      Joe                                    Bernie
               22%                 Biden       21%          Biden                    29%           Sanders

                                   Bernie                   Elizabeth                              Joe
               22%                 Sanders     20%          Warren                   28%           Biden

                                   Elizabeth                Bernie                                 Elizabeth
               18%                 Warren      19%          Sanders                   8%           Warren

                                   Kamala                   Pete                                   Kamala
                5%                 Harris      6%           Buttigieg                 8%           Harris

                                   Pete                     Kamala                                 Pete
                4%                 Buttigieg   4%           Harris                    1%           Buttigieg

The Nevada caucus became an early nominating contest in 2008. Only 84,000 Nevada Democrats participated in the
2016 caucus, a decline of 34,000 from 2008 (118,000)
20 |Source: CNN (September 2019)
South Carolina Democratic Primary State of Play

               Democratic Primary                  Among Black Voters                       Among White Voters
                                                    (61% of electorate)                      (35% of electorate)
                                   Joe                           Joe                                       Joe
               37%                 Biden          45%            Biden                      29%            Biden

                                   Elizabeth                     Bernie                                    Elizabeth
               16%                 Warren         13%            Sanders                    28%            Warren

                                   Bernie                        Kamala                                    Pete
               11%                 Sanders         6%            Harris                      8%            Buttigieg

                                   Pete                          Elizabeth                                 Bernie
                4%                 Buttigieg       4%            Warren                      8%            Sanders

                3%                 Kamala
                                   Harris
                                                   0%            Pete
                                                                 Buttigieg                    1%           Kamala
                                                                                                           Harris

“Of all the contested Democratic primaries held in the state since it first adopted a primary in 1992, only one winner —
South Carolina-born John Edwards (2004) — did not go on to win the party’s nomination” (NBC News)

20 |Source: CNN (September 2019)
March 3rd: Super Tuesday

     California
     416 Delegates
                                                     Alabama
                                                     52 Delegates
                     North Carolina   Minnesota                     Maine
                                                                    24 Delegates
                     110 Delegates    75 Delegates

                                                     Oklahoma       Vermont
                                                     37 Delegates   16 Delegates

     Texas           Virginia         Colorado
     223 Delegates   99 Delegates     67 Delegates   Arkansas
                                                     31 Delegates   American Samoa
                                                                    6 Delegates

                     Massachusetts                   Utah
                                      Tennessee      29 Delegates
                     92 Delegates     64 Delegates
21
Trump’s Positioning
     for Re-Election

22
Direction
                  of Country                                                                                                                    Right Direction                               Wrong Direction

                                                             62%
60%                                        60%                            59%
        57%                                                                             57%                                                                                                   57%        57%
                                                                                                                            55%                 55%                     55%
                      54%                                                                               53%
50%

40%                                                                                                     40%                 40%
                      37%                                                                                                                       37%                     37%                   38%
                                                                                        36%                                                                                                              36%
        32%                                                               33%
                                           31%
30%                                                          30%

      Jan. 2017     Apr. 2017          Jul. 2017           Oct. 2017    Jan. 2018     Apr. 2018       Jul. 2018           Oct. 2018           Jan. 2019               Apr. 2019           Jul. 2019    Aug. 2019

                                Obama | Direction of Country
                                70%
                                                                             60%                                                                                                    62%
                                                                                              55%

                                40%                                                           40%
                                                                            30%                                                                                                     31%

                                10%
                                       Jan. 2009            Jan. 2010     Jun. 2011       Nov. 2012           Nov. 2013           Nov. 2014               Nov. 2015               Nov. 2016

23                                    | Source: Real Clear Politics
Presidential                                                    Historical Comparison             H.W. BUSH       W. BUSH     CLINTON     REAGAN        TRUMP          OBAMA

                                                                                                                      66%             50%        48%         47%            43%
                    Approval Rating                                                             @978 Days                                                                                  41%

As of September 9, President Trump’s job approval rating stood at 43%                                                                                   Approve                Disapprove
60%

                                                                    55%               56%
                                                54%                                                    54%                                                                                   54%
                                                                                                                    53%                                        53%            53%
                                                                                                                                     52%          52%
50%                           50%

           44%                                                                                                      43%              43%          43%          44%            44%            43%
                              42%                                                                      41%
40%                                             40%
                                                                                      39%
                                                                    38%

        Jan. 2017          Apr. 2017          Jul. 2017           Oct. 2017         Jan. 2018        Apr. 2018    Jul. 2018        Oct. 2018    Jan. 2019    Apr. 2019      Jul. 2019      Aug. 2019

                                                                          Own Party Approval for the Start of Year 3 in Office

            W. BUSH               TRUMP                   NIXON               JFK               EISENHOWER       OBAMA            H.W. BUSH      REAGAN           CLINTON         CARTER

             90                     88                    88                  86                  86             83                 82             68              66               55
24 | Source: Real Clear Politics, Gallup, Quinnipiac
The Resistance

                                                                       Trump’s Historically Strong Opposition

        Donald                        Barack                      George W.                           Bill               George H.W.              Ronald                 Jimmy
        Trump                         Obama                         Bush                            Clinton                 Bush                  Reagan                 Carter

        May 2019                      May 2011                       May 2003                      March 1995             February 1991           April 1983            June 1979

       54%                            38%                           31%                            37%                      21%                   36%                   30%
   Def vote against in            Def vote against in            Def vote against in           Def vote against in       Def vote against in   Def vote against in   Def vote against in
     next election                  next election                  next election                 next election             next election         next election         next election

25 | Source: CNN, Quinnipiac, Garth Analysis, George Washington University, Ipsos, Marist, Los Angeles Times, CBS News
General Election
     Demographic Trends

26
Racial and Age Composition
                     2012 – 2018

Racial Composition of US Electorate 2012-2018
80%                                                                      75%                                                                          Asian   D+54
                 72%                                                                     71%                                                  72%
                                           3% White Voter Increase
                                                 Pres. to Midterm year
                                                                                                               1% White Voter Increase
                                                                                                                      Pres. to Midterm year
                                                                                                                                                      Hispanic D+40
60%
                                                                                                                                                      Black   D+81

40%                                                                                                                                                   White   R+10

20%              13%                                                     12%             12%                                                  11%
               10%                                                       8%                                                                   11%
                                                                                         11%
                  3%                                                 3%                  4%                                                   3%
0%
               2012                                                2014                 2016                                            2018
            Presidential                                          Midterm            Presidential                                      Midterm

Age Composition of US Electorate 2008-2016
                                                                                                                                                      65+      R+2
60%
                                                                                                                                                      45-65    R+1
                                                                         43%
                                                                                         40%                                                  39%
                 38%
40%                                                                                                                                                   30-44   D+19
                                                                                                    9% Cumulative Decline 30-44 & 18-29
                 27%          11% Cumulative Decline 30-44 & 18-29                                                    Pres. to Midterm year     26%
                                                 Pres. to Midterm year         22%       25%
                 19%                                                                     19%                                                    22%   18-29   D+35
20%                                                                 22%

                 16%                                                                     16%
                                                                         13%                                                                  13%

0%
               2012                                                2014                 2016                                            2018
            Presidential                                          Midterm            Presidential                                      Midterm
27 | Source: CNN Exit Polls
Voting Preference by Race
                   2012 – 2018

                              White                  Black          Hispanic

                                      R+10   D +81           D+40
                              2018                   2018            2018

                                      R+20   D +81           D+38
                              2016                   2016            2016

                                      R+22   D +79           D+26
                              2014                   2014            2014

                                      R+20   D+87            D+44
                              2012                   2012            2012

28 | Source: CNN Exit Polls
Voting Preference by Age
                   2012 – 2018

                       65+           45-64                  30-44          18-29

                              R+2             R+1    D+19           D+35
                     2018            2018                   2018           2018

                              R+7              R+8   D+10           D+19
                     2016            2016                   2016           2016

                              R+16            R+8    D+2            D+11
                     2014            2014                   2014           2014

                              R+12             R+4   D+7            D+23
                     2012            2012                   2012           2012

25 | Source: CNN Exit Polls
Geographic Split
        2012 – 2018

            Urban                Suburban          Rural

     D+33                  D+0                             R+14
            2018                   2018            2018

     D+26                                   R+2            R+27
            2016                   2016            2016

     D+14                                   R+12           R+21
            2014                   2014            2014

     D+26                                   R+2            R+20
            2012                   2012            2012

26
White Voter Education Divide
                   2012 – 2018

Party Preference                                                           Share of Electorate
White College Grads vs. Non-College Grads 2008-2016                        White College Grads vs. Non-College Grads 2008-2016
50                                                             College     50                                                     College

40                                          37                             45
30         26
                                     30                                    40                       39                            41
                                                               24
                                                                                                                      37
                                                                                  1306              36
20                                                                         35                                         34
                                     16
           14
10                                                                         30                                                     31

                                            3
0                                                                          25
                                                                                2012               2014              2016        2018
-10                                                            -8

          2012                   2014     2016                2018

                                                       College-Educated White Women

    D+7                                          D+2                                               D+20

                              2014                                       2016                                         2018

31 | Source: CNN Exit Polls
Trial Heats Among College and
                    Non-College Educated White Voters

Trump’s General Election Margins Among                             Trump’s General Election Margins Among        Non-
College-Educated White Voters                                      College Educated White Voters

           Trump +3% vs.                 Hillary Clinton in 2016          Trump +37% vs.        Hillary Clinton in 2016

           Trump -5% vs.                 Joe Biden                        Trump +8% vs.         Bernie Sanders

           Trump +3% vs.                 Bernie Sanders                   Trump +10% vs.        Joe Biden

           Trump +3% vs.                 Pete Buttigieg                   Trump +15% vs.        Elizabeth Warren

           Trump +4% vs.                 Elizabeth Warren                 Trump +17% vs.        Kamala Harris

           Trump +5% vs.                 Kamala Harris                    Trump +17% vs.        Pete Buttigieg

32 | Source: Fox News Poll (June 2019)
Electoral College Map &
     Congressional Election Outlook

33
2020
                   Electoral College

 ELECTORAL VOTE
                                                                                                       101 Electoral Votes
Democratic
                                                                                                          Up for Grabs
186 Solid / 47 Lean = 233 Total
                                          270
                                                                                                                                              4
Republican                                                                                                             10    16

164 Solid / 40 Lean = 204 Total                                                                                    6                     20
                                                                                              6                                   18

                                          270                                                              9
                                                                                                                                         13

Democratic (186)                 Republican (164)              Up for Grabs (101)                                                        15
California, Connecticut,         Alabama, Alaska, Arkansas,    Florida (29), Pennsylvania         11   5
Delaware, Hawaii,                Idaho, Indiana, Kansas,       (20), Michigan (16), North
Illinois, Maine, Maryland,       Kentucky, Louisiana,          Carolina (15), Arizona (11),                                        16

Massachusetts, New York, New     Mississippi, Missouri,        and Wisconsin (10)
Jersey, Oregon, Rhode Island,    Montana, Nebraska, North
Vermont and Washington           Dakota, Oklahoma, South
                                 Carolina, South Dakota,                                                                                29
Lean Democratic (47)
                                 Tennessee, Texas, Utah,
Virginia (13), Minnesota (10),
                                 West Virginia and Wyoming
Colorado (9), Nevada (6), New
Mexico (5), New Hampshire (4)    Lean Republican (40)
                                 Ohio (18), Georgia (16) and
                                 Iowa (6)
34
Core Battleground States

     Pennyslvania        Michigan           Arizona            Florida       North Carolina      Wisconsin

     % Non-College     % Non-College     % Non-College     % Non-College     % Non-College     % Non-College
        White             White             White             White             White             White

        40%               42%               36%               27%               33%              47%
       2016 Trump        2016 Trump        2016 Trump        2016 Trump        2016 Trump        2016 Trump

      48.0%             47.5%             49.0%             49.0%             50.5%             47.0%
     2016 Republican   2016 Republican   2016 Republican   2016 Republican   2016 Republican   2016 Republican
        Generic %         Generic %         Generic %         Generic %         Generic %         Generic %

      54.0%             49.0%             52.0%             54.0%             53.0%             47.0%
     2018 Republican   2018 Republican   2018 Republican   2018 Republican   2018 Republican   2018 Republican
        Generic %         Generic %         Generic %         Generic %         Generic %         Generic %

      45.0%             45.0%             49.0%             52.0%             51.0%             46.0%
     Generic Decline   Generic Decline   Generic Decline   Generic Decline   Generic Decline   Generic Decline

      -9.0%             -4.0%             -3.0%             -2.0%             -2.0%             -1.0%
35
Trump’s Path
               to Re-Election

                                   REPUBLICAN                                  LEAN REPUBLICAN
                                        164                                          40
0                                                                                                                                        270
                                                TRUMPS BASE                                                   TRUMPS NEEDS
                                        204 ELECTORAL VOTES                                              66 ELECTORAL VOTES

Step 1                                                          Step 2
3 must-win                                                      3 paths
states                                                                   #1                        #2                           #3
                                                                         WIN                       WIN                          TIE

         Florida       North Carolina                 Arizona
          29       +        15                +           11     Pennsylvania                    Michigan                    Wisconsin
                                                                         20                        16                           10

                         = 259
36
2020 Outlook: US House

                           Republicans need a net gain of 19 seats to win back control of the House, an unlikely feat in a presidential race.
Democratic                           In fact, the last time the House changed hands in a presidential election cycle was 1952.                                   Republican
235                                                                                    218   1 independent                                                              199

31 Democrats                                                                                                 3 Republicans
Represent districts won by Trump in 2016                                                                     Represent districts won by Clinton in 2016

                                     House Democrats represent          House Democrats               90 percent of House Republicans are
       54%                 20%       54 percent of the American         represent 79 percent of
                                                                        all Asian residents of
                                                                                                      White men, compared to just 38 percent         90%               38%
                                     population but just 20 percent                                   of House Democrats. This is the widest
                                     of America’s land area             the U.S., 72 percent of       demographic gap in history.
                                                                        Latinos and 66 percent
                                                                        of African-Americans,
House Democrats represent 78 percent of all Whole Foods Market                                                                                    A record 102 women serve
                                                                        but just 45 percent of
locations but just 27 percent of all Cracker Barrel Old Country Store                                                                             in the House (89 Democrats /
                                                                        non-Hispanic whites.
locations. Of the 43 districts Democrats flipped from Republican                                                                                  13 Republicans), including 36
control, 69 percent contain a Whole Foods Market.                                                                                                 freshmen Members.
37 | Source: Cook Political Report
2020 Outlook: US Senate

                                       Democrats need a net gain of 3-4 seats (depending on presidential outcome) to win control.
Democratic                                                                                                                                                 Republican
47                                                                                          50
                                                                                                                                                                    53

Races to Watch 34 Senate seats (22R / 12D) are up in 2020 with Republicans largely on defense:

        Alabama                        Arizona            Colorado                    Maine       North Carolina             Georgia
        (D-Jones)                    (R-McSally)         (R-Gardner)                (R-Collins)      (R-Tillis)         (R-Isakson Open)

There are a dozen incumbents whose seats are up                 In 2020, there will be 22              There are 25 women serving in the Senate, reflecting the highest
in 2020 who will be 70 or older by Election Day—                                                       number ever. Six states have two female senators: Arizona,
                                                                Republican US Senate seats
five Democrats and seven Republicans. Two of the                                                       California, Minnesota, Nevada, New Hampshire and Washington
Republicans, Sens. Alexander (R-TN) and Roberts (R-KS),         up for election. 18 of them
have already announced their retirements.                       are from states Trump won.

                                                                (source: Washington Post)

38 | Source: Cook Political Report
You can also read