Learning Management System Analysis | Recommendation - BYU-Idaho
←
→
Page content transcription
If your browser does not render page correctly, please read the page content below
Learning Management System Analysis |
Recommendation
Introduction
Over the past few years, BYU-Idaho has made significant investments in learning management systems
(LMS). In August 2014, BYU-Idaho evaluated multiple LMS vendors including Moodle, Blackboard,
Desire2Learn (D2L), and Instructure (Canvas), and after a pilot offering, the university decided to
implement the product D2L. Initial analysis and pilot studies showed that some aspects of D2L were
problematic, and unfortunately, despite BYU-Idaho’s efforts to partner with D2L to resolve these
challenges, D2L has still not delivered essential product usability improvements. In Spring 2017, a faculty
survey revealed that 62% of those polled desired to transition to a better LMS.
Based on D2L’s lack of improvement and the survey results, BYU-Idaho decided to conduct a formal LMS
analysis. In October 2017 an LMS Analysis Committee was formed, which included thirty faculty members
(on campus and online), a large team of critical stakeholders, curriculum designers, technologists,
students, and support staff. In November 2017, the committee voted unanimously to narrow the search
for a possible LMS to Canvas. A small LMS Analysis Core Team (also consisting of faculty, technologists,
students, and support staff) was formed to assess the LMS and offer a final recommendation of whether
to move to Canvas or remain with D2L.
Recommendation
The LMS Analysis Core Team recommends moving to Canvas starting in Fall 2018 for three key reasons:
(1) the faculty (on campus and online) overwhelmingly prefer Canvas, (2) the students prefer Canvas in
both desktop and mobile formats, and (3) BYU-Idaho’s business/technical needs are met by Canvas.
FACULTY & TA FEEDBACK
● Faculty in the pilot overwhelmingly preferred Canvas in all three surveys given in Winter 2018. In
the final survey, 100% of pilot faculty indicated a desire to use Canvas over D2L.
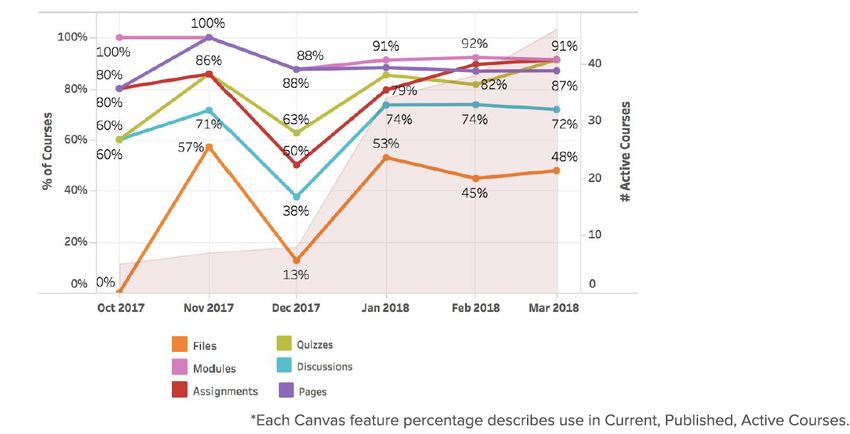
● Course activity reports show that faculty in the pilot fully utilized various course features (e.g.,
modules, quizzes, assignments, discussions, etc.), and this suggests that their positive user
feedback about grading, organizing, and setting up courses is based on robust user experience.
● Faculty who used the sandbox in March - April 2018 also overwhelmingly preferred Canvas. Of
the 205 faculty who responded, 79.5% indicated a desire to use Canvas over D2L.
● Teaching assistants who participated in the pilot also responded to the survey, and 83.33%
preferred Canvas over D2L.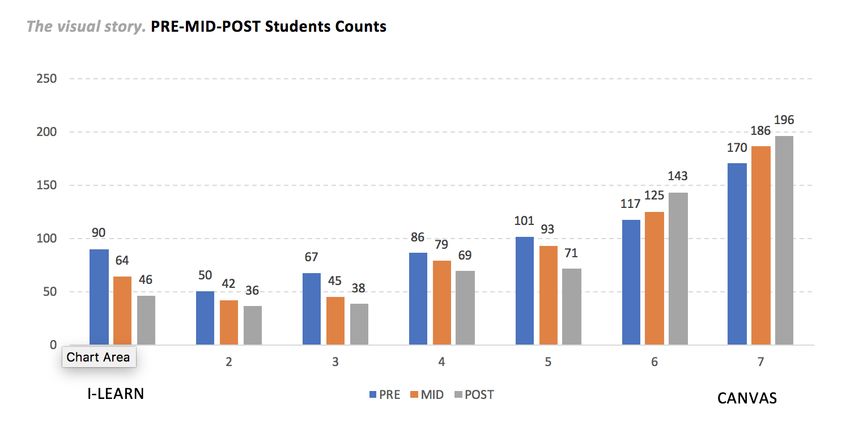
STUDENT FEEDBACK
       ●   Students in the pilot preferred Canvas over D2L in all three surveys conducted in Winter 2018. In
           the final survey, 68% of the pilot students indicated a desire to use Canvas over D2L.
       ●   Students in the pilot did not initially prefer Canvas as much as faculty, but over time, their average
           preference increased consistently and significantly.
       ●   Students who participated in the usability study were able to navigate the course and complete
           tasks within the LMS with little to no help. They reported a preference for Canvas over D2L with
           high learnability and memorability.
       ●   Student focus groups who tested the mobile app preferred Canvas over D2L.

BUSINESS & TECHNICAL NEEDS
       ●   Canvas is available as a SaaS solution hosted by Instructure, and this model fits BYU-Idaho’s
           technology strategy of buying off-the-shelf software.
       ●   Canvas data accessibility is improved over D2L. Despite some challenges in accessing course
           outcomes, Canvas still seems to be the more robust option (see Data and BI section in
           appendices).
       ●   Canvas supports BYU-Idaho’s technical standards for content, purchasing, and security.
               ○   Authentication – Canvas shows flexible compatibility by leveraging several standard protocols.
                   The authentication flow appears to be secure and flexible.
               ○   Learning Tools Integration – Configuration of learning tools interoperability (LTI) is simple and
                   flexible in Canvas; however, securing access to LTI is not as easy as D2L. Administration and
                   auditing of the LTIs is improved. Canvas supports API integration as well.
               ○   Application Administration – From a technical administrative perspective, the application is intuitive
                   and easy to use. Logging/reporting is greatly improved over what is available in D2L. However, the
                   security model is not as granular and could require more support time to secure apps and services.

Summary
Overall the LMS Analysis Core Team feels confident in recommending Canvas as the best LMS for BYU-
Idaho. The faculty and students prefer Canvas over D2L, and the data from the pilot, academic
discussions, usability study, and focus groups clearly demonstrate that Canvas offers a superior user
experience. Given that Canvas also meets the business and technical needs of our university, we hope
that the administration will move forward with contract negotiations and make it possible for faculty and
students to begin using Canvas in Fall 2018.

Committee Members
LMS Analysis Core Team
Role                       Name

Faculty Team Members       David Ashby, Alan Holyoak, Christopher Lowry, Yohan Delton, Diantha Smith, and Garth Miller
(on campus and online)

Information Technology     Kent Barrus, Mike Wegner, Joe McWilliams, Dean Allen, Rene Eborn, Troy Martin, and Roy Sleight

Online/Pathway/Academic    Cary Johnson, Jed Rhien, Jerrod Guddat, Eric Karl, Corey Moore, Arlen Wilcock, Matthew Anderson,
Support & Staff            Micah Murdock, Brian Pope, Aaron Ball, Connor Spurling, and Jordan Davidson

For more information regarding this recommendation, please see the appendices and/or contact your
faculty representative on the LMS Analysis Committee (https://www.byui.edu/lms-evaluation).

© 2018 Brigham Young University-Idaho | LMS Analysis Final Recommendation Report
                                                                                                                              1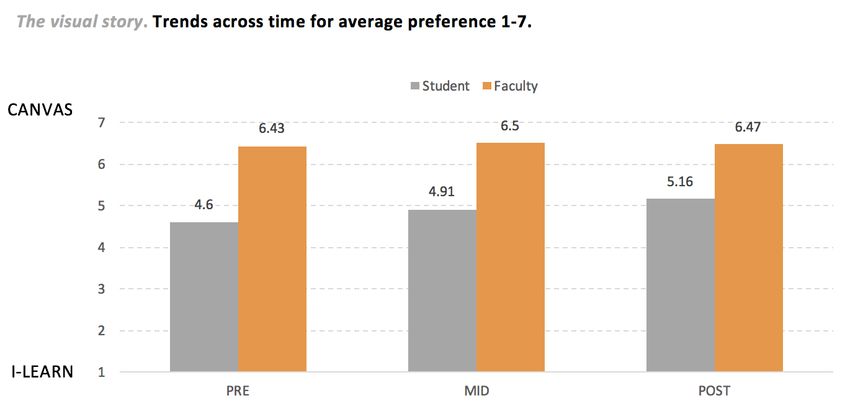
Appendices: Overview of Research Results
FACULTY & STUDENT SURVEY DATA

Purpose. This summary facilitates the decision-making process by capturing preference for I-
LEARN and CANVAS.

Procedure. We chose a PRE-MID-POST design to see the evolution of preference across the
Winter 2018 semester. We used the same survey for PRE-MID-POST-SANDBOX to allow for
straight comparisons. The survey included quantitative and qualitative data. The Sandbox
survey was aimed at faculty using the Sandbox version of CANVAS and was administered only
once. PRE was administered three weeks into the semester, MID was administered mid-
semester, POST and SANDBOX were administered on the last week of the semester. We
chose to use actual counts instead of percentages in the charts because some sample sizes are
below 100 and could thus mislead the chart reader.

Demographics. PRE included 727 participants (22 faculty and 705 students). MID included 680
participants (20 faculty and 660 students). POST included 643 participants (24 faculty and 619
students). The SANDBOX included 267 faculty.

Results. The faculty overwhelmingly prefers CANVAS over I-LEARN. There is a greater
variability among students in preference; they, however, also prefer CANVAS.

Recommendation. We recommend using CANVAS.

Interpretation. This question was built on a Semantic Differential scale, which is the industry
standard for measuring attitudes. The closer to “1” the more I-Learn is preferred, the closer to 7
the more CANVAS is preferred. The number “4” should be interpreted as having “No
Preference.” The best measuring point of preference is to use the latest data point in time
which, in this case, is the POST and the SANDBOX surveys.

The overall averages show CANVAS as the perceived better alternative to I-Learn. It should be
noted that the faculty experienced a greater preference for CANVAS than the students, although
students also prefer CANVAS over I-Learn.

© 2018 Brigham Young University-Idaho | LMS Analysis Final Recommendation Report
                                                                                                 2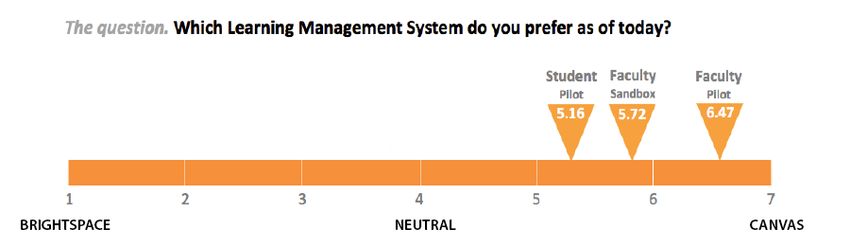
Interpretation. The closer to “1” the more I-Learn is preferred, the closer to 7 the more CANVAS
is preferred. The number “4” should be interpreted as having “No Preference.” The faculty had
previous experience with I-Learn and had used CANVAS for three weeks by the time we
administered the PRE-survey. At the outset, the faculty preferred CANVAS. When only looking
at the blue bars, then the orange bars, one can see that with use, the faculty’s preference for
CANVAS increases. When looking at the grey bars, the majority of faculty prefer CANVAS, but
there seem to have been an adjustment from MID to POST.

Interpretation. The closer to “1” the more I-Learn is preferred, the closer to 7 the more CANVAS
is preferred. The number “4” should be interpreted as having “No Preference.” The faculty using
SANDBOX overwhelmingly prefers CANVAS.

© 2018 Brigham Young University-Idaho | LMS Analysis Final Recommendation Report
                                                                                               3
Interpretation. The closer to “1” the more I-Learn is preferred, the closer to 7 the more CANVAS
is preferred. Most survey participants prefer CANVAS. The number “4” should be interpreted as
having “No Preference.” The students show more variability in their preferences but prefer
CANVAS. There is also a tendency for students to increase their preference for CANVAS over
time.
Interpretation. The closer to “1” the more I-Learn is preferred, the closer to 7 the more CANVAS
is preferred. The faculty show a steady preference for CANVAS with an effect size of .32
showing a slight increase in time. There is a statistical difference between how much the Faculty
and the Students like CANVAS. The main message is that both prefer CANVAS when looking at
the averages, and the faculty prefers it even more. Students show an increasing preference for
CANVAS with an effect size of .99 showing a strong and steady linear increase across PRE-
MID-POST.
© 2018 Brigham Young University-Idaho | LMS Analysis Final Recommendation Report
4FACULTY COURSE ACTIVITY REPORT
Interpretation. The pilot faculty were not required to use a specific number of tools, but it is clear
that they chose to utilize a high percentage of Canvas features throughout their teaching
experience. This suggests that their positive user feedback is based more on actual experience
than a “novelty effect” (i.e., we like it just because it’s new and different). It also suggests that
feedback from faculty in the pilot represents a robust user experience, rather than a limited user
experience where a teacher may only use one or two LMS features.
© 2018 Brigham Young University-Idaho | LMS Analysis Final Recommendation Report
5STUDENT USABILITY REPORT
We completed a usability study that focused on main navigation within Canvas and completing
typical student tasks within Canvas. There were over a dozen participants in the usability study,
from different user groups, including campus day students, Pathway Connect, online only, and
non students. We found a number of items that were confusing to students because they were
not consistent across all tools. Even so, students were still able to complete the tasks with very
little prompting from the facilitators and said that after one time that they could easily remember
how to complete the task in the future, so learnability and memorability scores were high for
these participants. Additionally, the participants that have experience with both the current LMS
and this exposure to Canvas said they prefer Canvas over the current product.
Part of the usability testing was also included examining the page and activity templates through
the eyes of new users. We learned that the page hierarchy has some challenges that we are
working through with our tech and design teams to improve the overall experience.
In addition to one-on-one usability testing, the Faculty Technology Center also facilitated three
one-hour student-facing focus groups. There were a total of 22 participants across the three
groups. All of the participants were participating in the pilot in campus courses.
While there were many things discussed about Canvas in the three focus groups, almost all
of the students thought the LMS had a nice feel to it, it was more professional and would be
worth switching to. Generally the feedback received from the focus groups was positive. Many
of the “favorite” features were brought up each night but the common favorites were:
● the to-do list
● the simplified view
● the easy-to-find gradebook and feedback
● the ease of navigation
● the messaging tool
● the app
Many of the negative comments from students pertain mostly to the set-up of their course(s).
For example, some assignments don’t have due dates, the gradebook is out of order, some
functions weren’t used as much in the course, items in the modules are out of order, etc. These
were noted as issues that could be fixed by the instructor given the knowledge of the different
settings in Canvas. Comments that came up that didn’t fall under things the instructors could
fix/change were:
● submitting assignments is confusing
● quizzes don’t allow for different values for each option
● assignments don’t automatically go away after completing them
● the icons are confusing
● discussion boards don’t have much functionality
© 2018 Brigham Young University-Idaho | LMS Analysis Final Recommendation Report
6The Canvas app was one of the features that the students liked most. One statement made
(that consensus agreed upon) was, “Switching to Canvas would be worth it for the app.” The
students most liked how the app allows them to quickly and easily complete their assignments
and check their grades. Students noted that it was much easier to submit assignments and take
quizzes from within the app. They agreed that the app layout is similar to the desktop version
and that navigating the app was easy.
Even though the majority liked the app there were some issues that emerged while it was in
use. The most notable issues were with the discussion boards. Some of the text in the
discussion boards gets cut off (zooming in and out does not help), responding to discussion
boards is difficult and confusing for some, and when multiple people respond to a discussion
board at once the app crashes. Other issues that were found were individualized to the part of
the app that the student was trying to use. These issues were:
● functionality issues for iPhone 4 and 5 users
● videos have problems loading
● to-do list is missing
● no back button for some
● quizzes sometimes reprompt for a login
TECHNICAL / BUSINESS REVIEW
Authentication - Canvas shows flexible compatibility by leveraging several standard protocols,
making it a good candidate for SSO and 2FA. Depending on the direction of CES as a whole, or
even where Pathway will fall on dependencies to the University, the abilities to support multiple
Identity Providers on a single tenant as well as cross-tenant trust configurations are conducive
to a "more-than-just-BYUI-students" approach. While this will simplify the area of authentication,
it could complicate authorization pieces in regard to class resources, LTI integrations, and API
integrations as they currently are implemented. The authentication flow, as a whole, put in place
by Canvas appears to be secure yet flexible.
LTI and API Integration – Based on our current experience, Canvas is as compliant with LTI
standards as other LMS vendors. Configuration of LTIs in Canvas is flexible and simpler than
they are in Brightspace. An exception is that securing access to LTIs in Canvas is less flexible
than in Brightspace. However, administering and auditing LTIs is greatly improved. Canvas has
a non-traditional approach to throttling API methods; we have to write additional code to track
and accommodate for this throttling.
Application Administration – The application design from a technical administrative
perspective is intuitive and easy to use. Logging and reporting is greatly improved over what is
available in Brightspace. The security model is not as granular and could introduce more
© 2018 Brigham Young University-Idaho | LMS Analysis Final Recommendation Report
7support time to secure apps and services, however, Canvas will be updating how permissions
are managed in the next six months, which could help.
Business Intelligence (BI) and Data-- The BI and Data review focused primarily on how
Canvas will meet the university’s reporting needs. There are three main areas in which we have
considered data available for analysis purpose: outcomes and assessment data, BI data
extraction, and warehouse integration.
Canvas provides a broad and robust set of data. We feel that for the most part we are in a better
situation with it than we were with D2L for data accessibility. One gap that should be noted is
course outcomes data is not currently in Canvas data portal. Canvas has told us that they plan
to add this data to their data portal in the future. The main risk if this does not happen is
extracting outcomes data for our data warehouse will be concededly harder.
From our analysis, the course outcomes module of Canvas has some challenges. One of the
main challenges is Canvas does not understand the university to program to course hierarchy.
We would have to be creative with our implementation or manage this hierarchy outside of
Canvas. Additionally, instructors are not able to create their own outcomes in Canvas; this could
be a plus or a minus, and we would need to manage outcomes at a higher level. Outcomes
managed at a higher level would allow department chairs to bring a greater uniformity to their
outcomes. The downside is instructors may not have the same level of flexibility.
There are three different methods that Canvas offers for extracting data: web APIs, Canvas data
portal, and Amazon Redshift. We feel that with these three methods we can successfully
catalog information to our LMS data warehouse. One of the main challenges the BI team will
have with the move to Canvas is they will have to architect the LMS data warehouse. The
estimate for this project is a six-month project at 450 hours. The main risks with this is we may
not be able to use our course assessment tools, online instructor assessment tools, and student
success tools as quickly as we would like. One of the services that would help us make building
these tools considerably easier would be purchasing the Amazon Redshift Service.
The chart on page 9 lists all LMS Instructor Activity metrics stored in the data warehouse (from
BrightSpace Data Sets) and whether they will be available in Canvas. In our investigation, all
metrics were available in Canvas, with two important notes explained in the “Notes, Applicable
to Canvas” section.
© 2018 Brigham Young University-Idaho | LMS Analysis Final Recommendation Report
8Currently Available Available in Notes, Applicable to Canvas
Canvas
Number of ✔
Announcements
Number of Content Topics ✔
Number of Content Topics ✔ Could exclude content topics only visited once or twice. The more an
Visited* instructor visits a content page, the more likely it is to be captured in the
“request” table.
Percent Content Visited ✔
Number of Dropboxes ✔
Number of Dropbox ✔
Submissions Commented
On
Number of Grade Items ✔
Number of Graded Grade ✔
Items
Number of Discussion ✔
Posts
Number of Discussion ✔
Posts Authored
Percent Discussion Posts ✔
Authored
Number of Logins To The ✔
System
Last Announcement ✔
Modified Date
Last Modification Of A ✔
Grade Item
Last Discussion Post Date ✔
Last Access To Course ✔ This field is continuously incremented when an instructor has a course
Offering page open in their browser. It is not a timestamp of when the instructor
navigated to their course, but a timestamp closer to when they navigated
away from their course.
Last Access To Course ✔ Could exclude “short” sessions. In most cases, instructors log in to the
Offering Content* LMS and navigate to several different content pages before leaving. If
cases where they only visit one page, chances are higher that the
session is not recorded, but this is rare.
Last Sent Mail Date ✔
*There are a few metrics that will require a certain “request” table in Canvas Data. This table keeps track of all browser HTTP
requests made by all Canvas users, but documentation warns that the table is a “’best effort’ attempt” and that it is not always
completely accurate. In our tests, we did find that a small number of requests were missing. This may hinder the accuracy of the two
marked metrics in the table below, but only in certain conditions.
© 2018 Brigham Young University-Idaho | LMS Analysis Final Recommendation Report
9GRADE SUBMIT
Faculty had different experiences with the grade submission process. For some, it “worked like
a dream” while for others, there were errors and it was problematic. While there were
challenges for some faculty, the IT group feels that “Canvas improves our situation for grade
submit, dramatically.” As this is the first time for integrating the grade submit from Canvas to the
student information system, we learned more about how grades are calculated in Canvas as
well as how we need to effectively extract them. We will need to work with Instructure to
optimize the experience and load test so that submitting grades will be a smoother process as
we prepare to scale.
D2L AND CANVAS FEATURE COMPARISON
Research completed by the LMS team has found that there is around 50 to 60% functionality
overlap between the two platforms. We found this to be true through the transition process for
the four online and eighteen campus courses that were transitioned for the pilot. During the
transition process, there were only minor necessary adjustments, all of which were made easier
by the user friendly atmosphere of Canvas.
Canvas does have some weaker tools on its platform, namely its quizzes, gradebook, and
content. The quizzes feature has fewer options available and is less suited for STEM courses;
the gradebook, while providing an easier grading process for instructors, has fewer grading
options for course design; and content pages that are less customizable in favor of a simpler,
more functional design. Instructure has already released in beta form a new quizzing platform
and we are seeing regular releases to the gradebook that improve its functionality. Despite its
shortcomings, the Canvas Platform is easy to transition to from D2L.
For a more in-depth comparison, view the LMS Feature Comparison Sheet.
LANGUAGE NOTE
The data represented in these reports primarily shows comparisons between Canvas
and D2L Brightspace. However, since many of the users refer to the LMS as “I-Learn,”
we used I-Learn instead of D2L Brightspace in the survey questions and results. In
reality, I-Learn is a suite of learning tools that includes far more than the LMS, and in
the future it may be helpful to make the distinction between the LMS and I-Learn
clearer.
© 2018 Brigham Young University-Idaho | LMS Analysis Final Recommendation Report
10You can also read