2018 FULL YEAR RESULT PRESENTATION - MCPHERSON'S LIMITED 22 AUGUST 2018 PRESENTED BY: MCPHERSON'S CONSUMER PRODUCTS
←
→
Page content transcription
If your browser does not render page correctly, please read the page content below
MCPHERSON’S LIMITED
                         2 018 F U L L Y E A R R E S U LT P R E S E N TAT I O N
                                                22 AUGUST 2018

Presented by:

Laurie McAllister, Managing Director

Paul Witheridge, Chief Financial Officer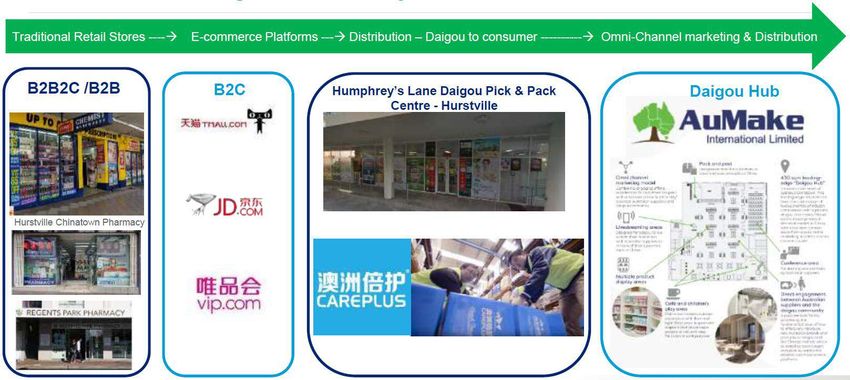
I N J U N E L A S T Y E A R ( F Y 1 7 ) , W E S E T O U R S E LV E S
          6 KEY PRIORITIES TO WIN IN FY18

Accelerate core six owned brand performance

Live the virtuous cycle of the export business model

Redesign the top six customer trading terms via joint customer business plans

Execute supply chain EBIT optimisation initiatives to re-invest in core six owned brands

Return our New Zealand operation to EBIT growth

Divest Home Appliances and reset our focus on a Health, Wellness and Beauty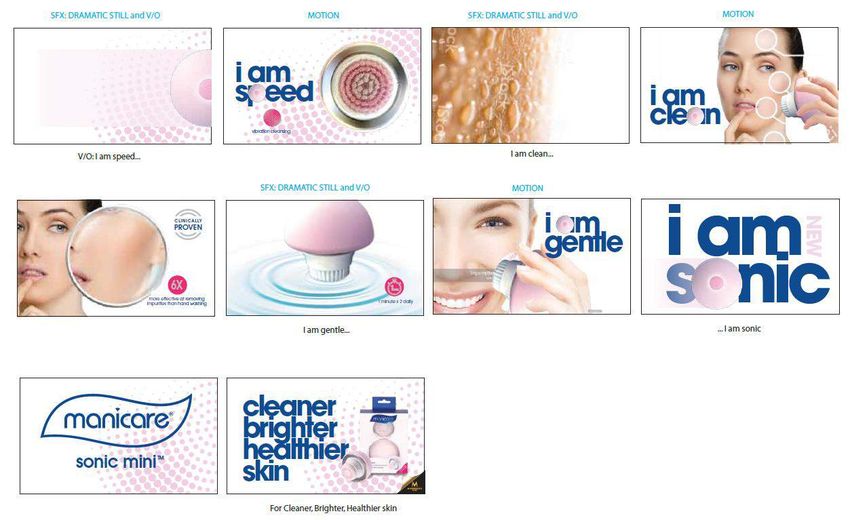
M c P H E R S O N ’ S R E S U LT S FO R F Y 1 8

+6% increase in sales from core six brands, with Multix now back to growth of +11% in the 2nd Half vs. FY17

+17% increase in underlying PBT from continuing operations

+41% increase in sales from skincare brands, driven by Domestic Pharmacy & Export channel

Divestment of Home Appliances for 7 x EBITDA

73% reduction in net debt $9.8 million

Underlying cash flow conversion of 82%

New & revamped functions driving further growth agendas – R&D, New Business Ventures & International
FY18 BUSINESS HIGHLIGHTS

     Tangible benefits realised from strategic customer partnerships
      • #1 Australian beauty supplier within Pharmacy.
      • Executed new / realigned trading terms with top 10 Pharmacy customers for mutual growth
      • Delivering “Greener” solutions to Grocery to support the sustainability wars

      Export channels, business model and business relationships gaining momentum
      • Selective geographic expansion in South-East Asia and North-Asian corridors – Japan, S. Korea & Malaysia
      • China business model bedded in with selective partners specific to portfolio choices

      NZ now returned to profitable growth & Singapore improved trajectory growing +31% across 2nd Half vs. FY17.

     A refreshed leadership team (existing & new) with relevant capabilities that enable us fit for the future.                        A
         winning team culture focussed on values & behaviours; being accountable, considered, innovative & collaborative for growth!

22/08/2018                                   2018 MCPHERSON’S FULL YEAR RESULT PRESENTATION                                                4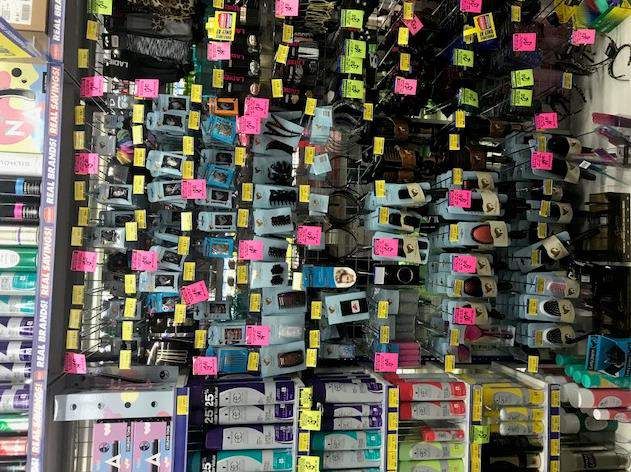
F Y 1 8 & F Y 17 G E O G R A P H I C A L S A L E S R E V E N U E
                            BREAKDOWN

                                   Other
2017                NZ
                         Singapore
                                   $5m       2018          NZ
                                                                Singapore Other
                                                                          $6m
                            $5m                                    $4m
             China $9m              2%                    $8m              3%
                             2%                     China           2%
              $1m 4%                                $7m 4%
              1%                                     3%

                          Australia                                Australia
                           $191m                                   $186m
                            91%                                      88%

           (Includes $22m Fine Fragrances)          (Includes $14m Fine Fragrances)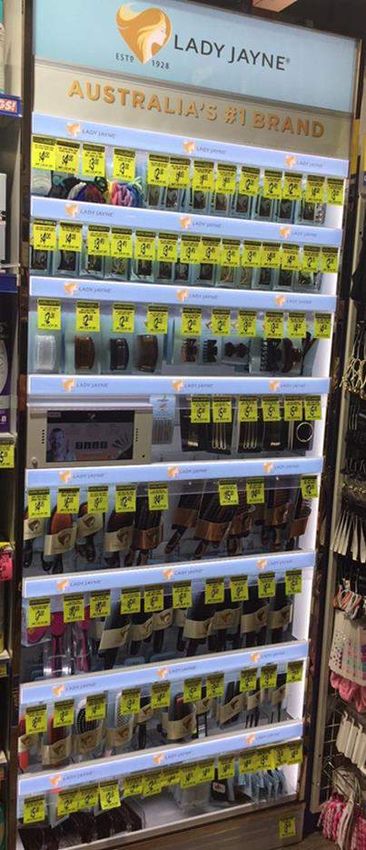
FINANCIALS

22/08/2018   2017 ANNUAL GENERAL MEETING   6
F Y 1 8 S A L E S R E V E N U E B R E A K D O W N B Y C AT E G O R Y

                                Sales revenue from continuing operations reduced by 0.3% to $210.4m.

Owned brands:                            FY18 $m           FY17 $m        % change                                        Comments

Skin, Hair and Body                       23.1              16.3            41%       •    Strong export and domestic sales of both Dr. LeWinn's and A'kin.

                                                                                      •    Solid growth in Swisspers
Essential Beauty                          57.5              56.5             2%       •    Manicare and Lady Jayne steady
Household Essentials & others             64.2              66.1            (3%)      •    Multix steady following 11% 2H18 growth vs 2H17, lost ranging in Footcare

Total Owned brands                        144.8             138.9            4%

Agency Brands                             40.3              46.6            (14%)      •   Loss of fine Fragrance agency in January 2018
                                                                                       •    Increased 2H supply to Grocery customers
Private Label                             25.3              25.7             (2%)

Total sales from continuing operations    210.4             211.2             -

 22/08/2018                                        2018 MCPHERSON’S FULL YEAR RESULT PRESENTATION                                                                      7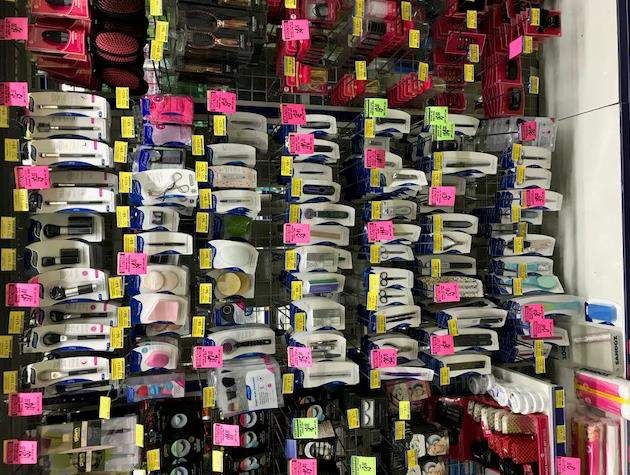
2 H 1 8 S A L E S R E V E N U E B R E A K D O W N B Y C AT E G O R Y

                             Sales revenue from continuing operations increased by 7.0% to $104.2m.

Owned brands:                            2H18 $m          2H17 $m          % change                                         Comments

Skin, Hair and Body                       13.4              8.6              56%       •    Strong export and domestic sales of both Dr. LeWinn's and A'kin.

                                                                                       •    Strong growth in Swisspers and Lady Jayne
Essential Beauty                          28.4              27.0             5%        •    Manicare sales steady
Household Essentials & others             32.6              30.7             6%        •    11% growth in Multix, decline in Footcare due to deranging in Grocery

Total Owned brands                        74.4              66.3             12%

Agency Brands                             16.2              20.1            (19%)       •   Loss of fine Fragrance agency

Private Label                             13.6              10.3             32%        •   New supply to Grocery customers

Total sales from continuing operations    104.2             96.7             7%

 22/08/2018                                        2018 MCPHERSON’S FULL YEAR RESULT PRESENTATION                                                                   8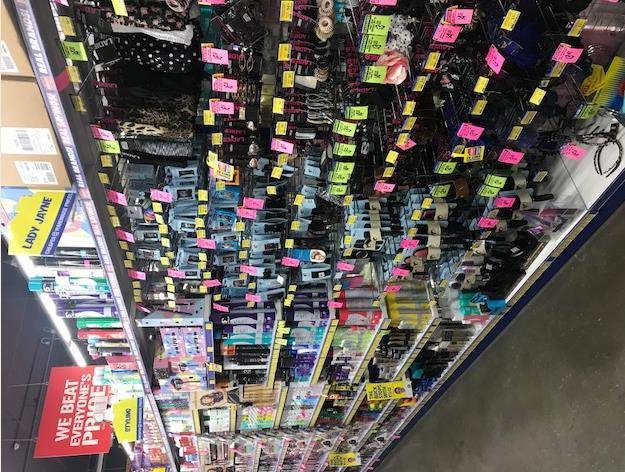
U N D E R LY I N G P B T- F Y 17 t o F Y 1 8

                                                         Decrease
                                                              in
                                           FX           contribution
                      Increase            hedge             from
                          in              book            Agency /
                     contribution        Impact          Fragrance
                        from               2.6             brands
                                                                       Decrease in
                       owned                                (4.9)
                                                                       contribution                       Business
                       brands                                             from
                         5.6                                                            Additional       Development
                                                                         Private FY17     co-op           Research
                                                                          Label 16.2                                                 Interest
                                                                                        advertising           &            3PL
                                                                         brands                                                     reduction
                                                                                           (1.9)         Development      cost
                                                                          (0.4)                                                         1.9
                                                                                                          expenses      reduction
                                                                                                            (0.7)          0.6
                                                                                                                                                FY 2018
                                                                                                                                                   FY
                                                                                                                                                  19.0
                                                                                                                                                 2018
             FY17                                                                                                                                19.0
             FY17
             16.2
              16.2

                                      Gross Contribution Movements                                    Operating Costs

                                    Underlying PBT from continuing operations increased by 17.3% to $19.0m.

22/08/2018                                          2018 MCPHERSON’S FULL YEAR RESULT PRESENTATION                                                        9
BALANCE SHEET & CASHFLOW METRICS
$19.4m operating cash flow before interest and tax
Underlying Cash Conversion* 82%
payments, ex Home Appliances
Divestment of Home Appliances, all outstanding
Net Debt $9.8m 73.0%
bonds bought back
Gearing 9.9% 19.3pp Strong financial platform
ROFE ** 21.6% 5.0pp 4% increase in underlying EBIT
Normalised EBIT Interest Cover 8.5 times 3.9 times EBIT*** / Interest†
Normalised leverage Ratio 0.4 times 1.2 times Net Debt / EBITDA***
All movements measured with reference to 30 June 2017
* Operating cashflow / Underlying EBITDA excluding Home Appliances cashflow and non-cash, non-recurring items
**Underlying EBIT / Total funds employed. FY17 funds employed normalised to reflect divestment of Home Appliances
*** Underlying EBIT and EBITDA exclude significant, non-recurring items
† Interest expense normalised to exclude bond buyback costs and hedge ineffectiveness of fixed interest rate swaps
22/08/2018 2018 MCPHERSON’S FULL YEAR RESULT PRESENTATION 10F Y 1 8 K E Y F I N A N C I A L S – OT H E R I N F O R M AT I O N • Final dividend of 2.5 cents per share fully franked payable 19 October 2018 • Total FY18 dividend 8.5 cents per share fully franked (FY17 – 8.0 cents per share). • Dividend reinvestment plan retained • Current FX hedging policy retained 22/08/2018 2018 MCPHERSON’S FULL YEAR RESULT PRESENTATION 11
MARKET ENVIRONMENT

22/08/2018        2017 ANNUAL GENERAL MEETING   12
TRADING ENVIRONMENT

MARKET CONDITIONS
                            PHARMACY                                                      GROCERY                                           PRIVATE LABEL                    EVOLVING CHANNELS
              •Accelerating +6% Qtr with                                   •Slowing +1% Qtr - continued                             •Coles forecast 41% range to be     •Amazon Pharmacy +50% growth
           Discount Pharmacy over half the                                     range rationalisation                                     Private Label by 2023              in US & Europe in 2017
                    market share
                                                                              •ALDI now has 13% share                                                                   •Daigou – est.13% of Pharmacy
         •Skincare #2 highest growth driver                                                                                          •Private Label driving 39% of      ($6B) scanned sales exported &
                  behind Vitamins                                     •Sustainability and ban the bag top                                       growth                             growing
                                                                                    of mind

McPHERSON’S POSITION
             •Core brands driving category                              •Multix and Swisspers leveraging                              •Strategic alignment with          •852 MCP Amazon sku listings
                  growth in latest Qtr                                    sustainability trends through                              customers on key categories               with 40 resellers
                                                                                   innovation                                          •Investing in Research &          • +17% growth of Dr. LeWinn’s
              •Dr. LeWinn’s turning around                                                                                         Development to fuel differentiated         exported scan sales
               decline -7.5% to +3.5% MAT                                •Multix Greener to launch a 2nd                                      innovation                •Trilogy Rosehip Oil holding 10%
                                                                            sustainable innovation                                      •Selective participation          share of total Facial Skincare
                 •A’kin growing +50% MAT                                                                                                                                        export scan sales

 Source: IRI Market Measurement – Pharmacy Scan, Data to: MAT Value To 22/07/18; IRI Future of Pharmacy Presentation August 2018                                                                  13
 MAT= Moving Annual Total; Qtr= Quarter; YA= Year Ago
H E A LT H & B E AU T Y C AT E G O R I E S A R E W I N N I N G
Skincare 2nd highest
GROCERY growth category in both PHARMACY
Grocery and Pharmacy
$M Growth Actual vs YA $M Growth Actual vs YA
Infant Formula 16 Infant Formula Dietary Supps 45 Vitamins
Health & Beauty
4 24
Skincare Skincare
+$105M Skincare Skincare
Analgesics 3 Analgesics Cough & Cold 15 Cough & Cold
Digestion 2 Digestive Analgesics 9 Analgesics
Soaps & Wash 2 Soaps & Wash Frangrances 4 Fragrances
Source: IRI Future of Pharmacy Presentation August 2018 Qtr Growth
MAT= Moving Annual Total; Qtr= Quarter; YA= Year AgoCONTINUED GROWTH OF DAIGOU DEMAND
China’s current population
is 1.42 Billion
Estimated that between
2009 and 2030, China will
have added 850 million
people to it’s middle class.
850M Chinese Middle Class = Size of Prize $2.8 Trillion
Source: IRI Future of Pharmacy Presentation August 2018AUSTRALIAN PHARMACY DOMESTIC & EXPORT
$5.9b 88%
MAT SHARE 1%
OF $$ VALUE
$6.8b
$846m 13%
SHARE 6%
MAT
OF $$ VALUE
Source: IRI Future of Pharmacy Presentation August 2018
MAT= Moving Annual Total; Qtr= Quarter; YA= Year AgoTO P 4 AU S T R A L I A N P H A R M AC Y E X P O R T C AT E G O R I E S
28% 45%
EXPORT EXPORT
+1%YOY +28%YOY
SHARE $$ SHARE $$
12% 6%
EXPORT EXPORT
+14%YOY -4%YOY
SHARE $$ SHARE $$
Source: IRI Future of Pharmacy Presentation August 2018
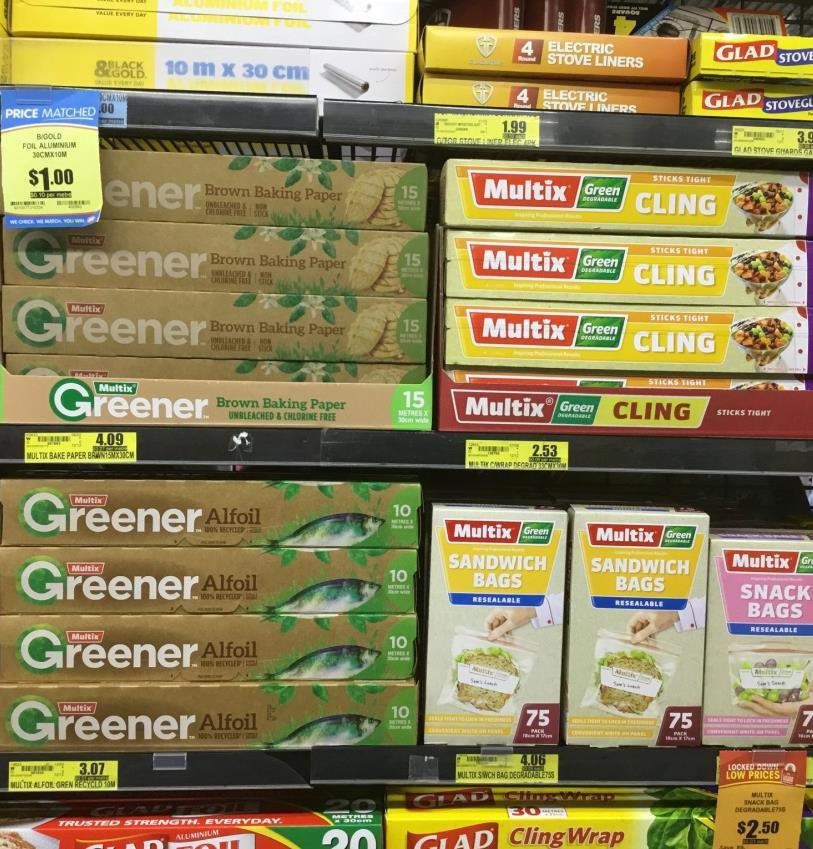
MAT= Moving Annual Total; Qtr= Quarter; YA= Year AgoDAIGOU PHARMACY CHANNEL EVOLUTION
Traditional Retail Stores E-commerce Platforms Distribution Daigou to consumer Omni-Channel marketing & distribution
Source: IRI Future of Pharmacy Presentation August 2018S T R AT E GY U P D AT E 22/08/2018 2017 ANNUAL GENERAL MEETING 19
3 Y E A R ST R AT E GY –
             TO G ROW I N H E A LT H , W E L L N E S S A N D B E AU T Y

    FOCUS ON CORE                     Explore new
       6 OWNED                       product growth
       BRANDS                           platforms                                                                  DRIVE VALUE
                                                                         Move to strategic                      FROM GEOGRAPHIC
                                                                       customer and supplier                        FOOTPRINT
                                                                            partnerships

                                              S T R AT E G I C E N A B L E R S
                    End to end capability and capacity -         Strong agency partners compliment portfolio,
                    supply chain, route to market and IT                     scale and capability

22/08/2018                             2018 MCPHERSON’S FULL YEAR RESULT PRESENTATION                                         20
MACRO TRENDS TO LEVERAGE
CHINA DEMAND FOR SUSTAINABLE
PROACTIVE CARE
EXPORT NATURAL SOLUTIONS
Global Face Mask Market expected to
reach $8.8B in 2021
China middle-class Global Organic Personal Care Renew | Reuse | Recycle
population projected to Market projected to reach China represents 48% of market
Remove
exceed 600M by 2022 $25B by 2025 Australia Face Mask Market +50%
CAGR (2016-2018)
Source: IRI Market Edge; Euromonitor International; Grand View Research, Inc.,NO. 1 AUSTRALIAN COSMECEUTICAL BRAND
CORE MASK CHINA EXPORT
INNOVATION DEMAND
REJUVENATION EXPANSION
ETERNAL YOUTH REVERSADERM COSMECEUTICAL BENEFITS LINE SMOOTHING COMPLEX
#2 sub-brand launched by 10X versus YA following range Over 300,000 Export demand fuels
McPherson’s in 2014 relaunch Line Smoothing Complex domestic sales
Masks sold
NPD & ATL delivers +10% 360 activation launch plan +22% growth MAT,
growth Strong innovation pipeline accelerating to +50% QTR
Supported with clinical claims
Source: IRI Market Measurement – Pharmacy Scan, Data to: MAT Value To 22/07/18CHINA SALES FUEL THE DOMESTIC/EXPORT
VIRTUOUS CYCLE
Total Pharmacy
Dr. LeWinn's Line Smoothing Complex Growth % vs YA
50.4%
32.8%
12.9%
-9.7%
CHINA EXPORT
Quarter To 22/10/17 Quarter To 21/01/18 Quarter To 22/04/18 Quarter To 22/07/18 DEMAND
Source: IRI Market Measurement – Pharmacy Scan, Data to: MAT Value To 22/07/18;
MAT= Moving Annual Total; Qtr= Quarter; YA= Year AgoFA S T G R O W I N G N AT U R A L S K I N C A R E A N D H A I R C A R E
CHINA EXPORT INTERNATIONAL
INNOVATION & DISTRIBUTION EXPANSION
DEMAND EXPANSION
DOMESTIC GROWTH INTERNATIONAL GROWTH
Haircare: +16% growth MAT, accelerating +35% QTR Total Export : +117% CAGR ex. factory growth (2016 – 2018)
Skincare: +50% MAT growth (outpacing 11% category growth) Asia: China, Japan, Korea, Singapore & Malaysia
Increased distribution, ranging and share of shelf Europe: UK
Source: IRI Market Measurement – Pharmacy Scan, Data to: MAT Value To 22/07/18LEADERS IN BEAUT Y TOOLS AND HAIR ACCESSORIES
CORE DISTRIBUTION SMART
REJUVENATION EXPANSION TECHNOLOGY
Packaging Rejuvenation +16% sales growth New Rechargeable Facial Cleansing Brush
+0.4 ppt share gains 15 new lines accepted +$2M annual retail sales
Youthful & Sophisticated Ambassador led digital campaign 360 activation plan
Source: IRI Market Measurement – Scan, Data to: QTR Value To 08/07/18; Brand Health Tracker June 2018MANICARE SONIC LAUNCH CAMPAIGN
NO. 1 COTTON BRAND
CORE DISTRIBUTION SUSTAINABLE CATEGORY
REJUVENATION EXPANSION INNOVATION EXPANSION
55% Share of Cotton Category +12% growth in a flat Plastic alternatives High growth categories
#1 Cotton Tips category Bio-degradable materials adjacent to skincare and
+0.8ppt share gains cleansing
#1 Make Up Pads
Increased ranging in both Pure & Eco Friendly
#1 Cotton Balls
Grocery & Pharmacy Consumer insight led
innovation
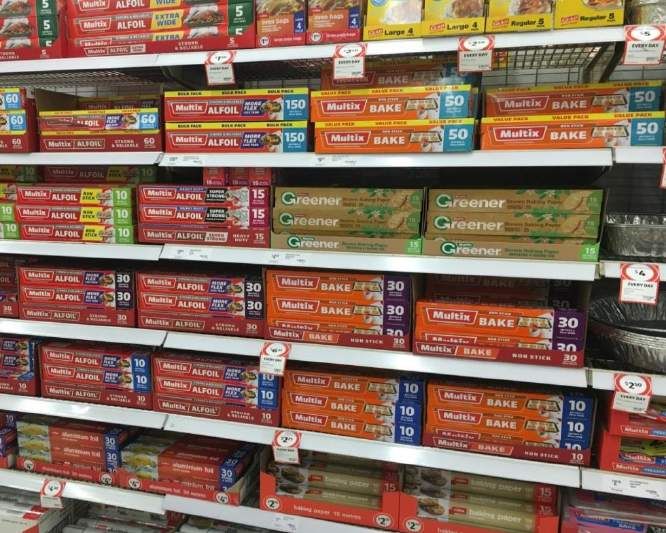
Source: IRI Market Measurement – Scan, Data to: MAT Value To 22/07/18 (Cotton – Grocery; Facial Wipes – Grocery & Pharmacy)NO. 1 BAGS WRAPS & FOIL
$112M #1 51% 18%
Aluminium Foil, Kitchen Tidy, of Australian Households
Retail Sales Value Garbage Bags, Baking Paper have purchased a Multix product within Unprompted Awareness
and Freezer Bags the last year
Source: IRI Market Measurement – Scan, Data to: MAT Value To 22/07/18; Paradigm Shift Brand Health April 2017A S T R O N G H I S TO R Y O F I N N O VAT I O N
Carrum
First tidy, garbage Drawstring
factory burns Star seal bag
and freezer bags garbage bags
down, launched
in retail launched
1971 1975 1980 1984
Business started 1973 Multix sold to 1978 Multix wins 1982 Tear off 1989
by Chockran Bros Amcor ‘check out’ bags freezer bags
converting plastic
contracts launched
bags
Amcor sells
Award winning First Multix colour
Multix to Baking Aids
garbage dispenser degradable scent
bags launched
George
bag launched
2003
launched 2005 launched
1990 1996 Norman 1998
Multix
purchases
1992 Multix Alfoil 1997 Multix Antibac 2002 Multix plastic 2004 McPherson’s 2006
TV ad swipes ware acquires Multix
Comalco Alfoil
launched launched launchedBUILDING A GREENER FUTURE
L E A D I N G I N N O VAT I O N I N A L A R G E T I R E D C AT E G O R Y
Multix Greener Brown Baking Paper 15m
Unbleached and chlorine free;
sourced from plantation forest
New Compostable Tidy Bags
Made from GMO free Corn
Starch… even the worms
can eat them!
Multix Greener Recycled Alfoil 10M Home Compostable to
Made from 100% recycled foil Australian Standards
No compromise on
performanceG R O W I N G AG A I N & D R I V I N G T H E C AT E G O R Y G R O W T H
First to Market Incremental
Innovation Ranging
• Multix Greener range • Multix share gains Feb
launched Feb 2018 - Jul 30.2% to 32.3%
• Product range includes • 15 incremental sku’s
Kitchen Tidy, Alfoil, Baking ranged in 2018 delivering:
Paper & Cling
• +12% in Kitchen Tidy
• Multix Greener growing
+72% in latest quarter • +6% in Baking Paper
• +4% in Foil
Source: IRI Market Measurement – Scan, Data to: QTR Value To 22/07/18M A J O R AT L B R A N D C A M PA I G N
• New CHOOSE WISELY TV & Digital Brand Campaign
• Featuring Multix Alfoil and Multix Greener
• $1.6M Media Spend
• Reach: 65% Main Grocery Buyers up to 8 times
• 6 weeks on air commencing 12 August
Source: IRI Market Measurement – Scan, Data to: QTR Value To 22/07/18M U LT I X L E A D I N G I N N OVAT I O N W I T H A F I R ST M OV E R
S U STA I N A B I L I T Y D R I V E
• Multix market leadership with first to market innovation “Greener” supported by strong in-store activation
22/08/2018 2018 MCPHERSON’S FULL YEAR RESULT PRESENTATION 34M OV E TO ST R AT E G I C
CUSTOMER/SUPPLIER PARTNERSHIPS
• Approach to strategic customer partnership delivering outcomes (channel expansion of Manicare into Grocery)
• Formalised Top to Top Meetings with Customers and Suppliers
• Structure and engaged joint business planning to drive mutual growth
Move to strategic
customer and supplier
partnerships
• Tangible benefits realised from strategic customer partnerships
• #1 Australian beauty supplier within pharmacy
• Strategic discussions and new trading terms with top 10 Pharmacy customers have led to increased participation
• Target New innovations by leveraging unique expertise eg Monash Food Innovation Centre
22/08/2018 2018 MCPHERSON’S FULL YEAR RESULT PRESENTATION 35M OV E TO ST R AT E G I C
CUSTOMER/SUPPLIER PARTNERSHIPS
• Consumer led exclusive retailer offers driven by category trends, insights and demand.
Exclusive Pack Sizes and First to Market Retailer Offers Differentiated Gift Sets
22/08/2018 2018 MCPHERSON’S FULL YEAR RESULT PRESENTATION 36D I G I TA L C O N T E N T A M P L I F I C AT I O N
RETAILER AMAZON
DIGITAL PRESENCE
PARTNERSHIPS OPPORTUNITY
700+ products syndicated YOY +250% increase in digital presence & 852 Amazon product listings
media:
800k+ impressions on retailer websites 10X increase since January 2018
Social | Influencers | Video content
Over 5.5 million digital ad impressions in Key opportunity to increase brand
partnership with Chemist Warehouse engagement through ratings & reviewsM OV E TO ST R AT E G I C
CUSTOMER/SUPPLIER PARTNERSHIPS
22/08/2018 2018 MCPHERSON’S FULL YEAR RESULT PRESENTATION 38M OV E TO ST R AT E G I C
CUSTOMER/SUPPLIER PARTNERSHIPS
• Incremental ranging and channel expansion in over 1,000 doors across both Grocery and Pharmacy
• 45,000 incremental distribution points
• Chemist Warehouse: 55 new SKU’s, 22.6k incremental distribution points Vs YA
• 11 Extra Displays in 282 Stores
• What’s On In The Warehouse, approximately 12, 3X Vs YA
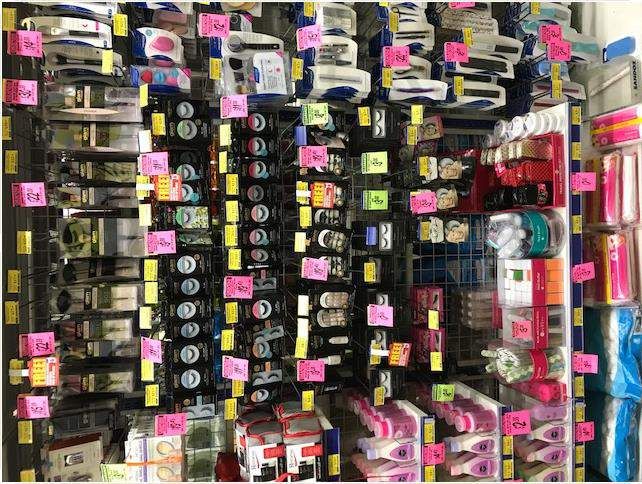
22/08/2018 2018 MCPHERSON’S FULL YEAR RESULT PRESENTATION 39PRE CAPEX INVESTMENT LOOK Chemist Warehouse Hillsdale, NSW – Before shots of Essential Beauty areas
+ 4 5 % I N V E S T M E N T I N R E A L E S TAT E , R O I I N 1 2 M O N T H S

                                                                 CATEGORY LEADERSHIP MERCHANDISING

                                                           •   Implementing in 125 high performance Chemist
                                                               Warehouse stores in 2018

                                                           •   High impact within front of store high traffic areas

                                                           •   Ease of shopper shelf navigation

                                                           •   Fuelling the path to purchase with interactive
                                                               screens

                                                           •   Roll out commences in October

     CWH Hillsdale, NSW – after new merchandising stands
OUTLOOK 22/08/2018 2017 ANNUAL GENERAL MEETING 42
ST R AT E GY F O C U S A R E A S

    FOCUS ON CORE
       6 OWNED         Explore new
       BRANDS         product growth
                         platforms                                                  DRIVE VALUE
                                                           Move to strategic     FROM GEOGRAPHIC
                                                         customer and supplier       FOOTPRINT
                                                              partnerships

22/08/2018              2018 MCPHERSON’S FULL YEAR RESULT PRESENTATION                         43
B R A N D ST R AT E GY F O C U S A R E A S
• Major new product launches for Dr. LeWinn's and A’kin FOCUS ON CORE 6
OWNED BRANDS
• Continued A’kin skincare range expansion with double share of shelf
• Step-change Dr.Lewinn’s Mask participation
• Continue building eco platform with Multix Greener new products - 2nd Sustainable play ready to go
• Launch Multix above the line advertising
• 4x increase in merchandising capex to amplify in-store presence - Chemist Warehouse x 125 stores
Move to strategic
• Accelerate digital and media presence across Core 6 brands customer and supplier
partnerships
• ATL Sonic launch from Manicare
22/08/2018 2018 MCPHERSON’S FULL YEAR RESULT PRESENTATION 44E X P LO R E N E W P R O D U C T G R O W T H P L AT F O R M S
CAPABILITY & CAPACITY (430 FTE’s) = THE MCP MACHINE...IS OPEN FOR (SELECTIVE) BUSINESS!
Consumer & Business Intel. R&D Sales & Marketing Supply Chain
•2X Investment IN CI & BI •11 FTE’s / Specialists •26 FTE’s KAM’s, 55+ Field •95 FTE’s, 40% Capacity KG
•4 FTE’s & New Tools •25+ HK Sourcing / Procure. •40+ Local & Intl Marketers •5,000 Daily deliveries
COLLABORATIVE PARTNERSHIPS, M&A & A 10 x FTE EXPORT TEAM
Project Landscape – Where To Fish Selective Agency Partnerships M&A – Integrate,Turn & Grown
2018 MCPHERSON’S FULL YEAR RESULT PRESENTATIONEXPORT CHANNEL MODELS (FROM 1 TO 10 FTE’S)
China Nth Asia Sth Asia UK Dubai
% Chg vs
YA FY18 3X 100% Incremental 100% Incremental 25% Flat
Establish cross border e-comm. Capture new Export Mkts Utilise Singapore hub to capture new High Penetration High Penetration
trading model & build strong Export Mkts established Mkt established Market
Strategy partnerships with leading Awareness & trial via QVC
distributors in Australia & China channel; 15.4mm homes
• A’kin (MY) (ID/PH/TH/VT/IND)
• Dr LeWinn's 135k agents • Dr LeWinn’s (KR) (JP/ • A'kin 1700 + doors • A'kin
• Multix (MY/ID) (PH/TH/IND)
• A’kin trading on 6 platforms , HK) • Moosehead 700 + • Moosehead
Brand • Swisspers (MY/TH)
endorsement via 120 KOLs • A’kin (JP/KR) doors • Manicare
Focus (PH/TH/IND/SL/VT)
• Karen Murrell Daigous & key • Swisspers (TW)
• Manicare (MY) (PH/SL/VT)
strategic platforms
• Lady Jayne (MY) (PH/SL/VT)
FY18 Activated… • Classic Dist. Model • 2 X National Grocery Classic Distribution
• Wechat / Weishang (agents) • Classic Distribution Model • National Pharmacy Model
• Tmall, Taobao, JD, VIP, Suning, • 5X sales FY19 • +55% in own brands in 2nd half • Beauty retail
Platform
Kaola • Airlines / Home Shop
• Flagship & POP Stores • MY 20X FY18
22/08/2018 2018 MCPHERSON’S FULL YEAR RESULT PRESENTATION () markets will launch in 1 st half FY19 46So Are We Poised for Growth?
2018 MCPHERSON’S HALF YEAR RESULT PRESENTATIONP L AT F O R M F O R F Y 1 9
Exclusively focused on growing in $13.0B Health, Wellness and Beauty categories
•Business well positioned to deliver growth with strong Capex & OPEX Management
Accelerating MCP growth brands & selective premium agency partnerships
• (Trilogy, Karen Murrell, Bondi Perfume & Dr. Wolfe)
Winning in Pharmacy and key segments in grocery
•#1 Australian Beauty supplier in Pharmacy, doubling our sales over 5 years with continued YOY growth FY18 vs. FY17
Demonstrated success in acquired brands – Grown A’kin & Dr. LeWinn's...Confidence to replicate
We have the right Export business model & and relationships & investing for the future
•Expanding existing & entering new territories ( UK, China, Japan, South Korea, Taiwan & Malaysia)
Re-aligning the organisational capabilities to enable our growth strategies to win today & tomorrow
MCP now poised to divert capital to investments that will enhance our branded footprint and utilise existing capacity and
operational / “go to market” strengths
48F Y 1 8 & F Y 17 G E O G R A P H I C A L S A L E S R E V E N U E
BREAKDOWN
Other
2017 NZ
Singapore
$5m 2018 NZ
Singapore Other
$6m
$5m $4m
China $9m 2% $8m 3%
2% China 2%
$1m 4% $7m 4%
1% 3%
Australia Australia
$191m $186m
91% 88%
(Includes $22m Fine Fragrances) (Includes $14m Fine Fragrances)Poised for Growth 2018 MCPHERSON’S HALF YEAR RESULT PRESENTATION
Poised for Growth

   2018 MCPHERSON’S HALF YEAR RESULT PRESENTATION
Focussed on Growth

    2018 MCPHERSON’S HALF YEAR RESULT PRESENTATION
M c P h e r s o n ’ s L i m i te d Non-IFRS measures The non-IFRS measures used by the Company are relevant because they are consistent with measures used internally by management to assess the operating performance of the business. The non-IFRS measures have not been subject to audit or review. Disclaimer Statements contained in this presentation, particularly those regarding possible or assumed future performance, estimated company earnings, potential growth of the company, industry growth or other trend projections are or may be forward looking statements. Such statements relate to future events and expectations and therefore involve risks and uncertainties. Actual results may differ materially from those expressed or implied by these forward looking statements. 53
You can also read