HONG KONG TELEVISION NETWORK LIMITED - Interim Results For the period ended 30 June 2020
←
→
Page content transcription
If your browser does not render page correctly, please read the page content below
HONG KONG TELEVISION
  NETWORK LIMITED
       (SEHK: 1137)

    Interim Results

  For the period ended
      30 June 2020

        27 August 2020
This presentation and subsequent discussions may contain forward-looking statements and information that involve risks,
Disclaimer   uncertainties and assumptions. Forward-looking statements are all statements that concern plans, objectives, goals, strategies,
             future events or performance and underlying assumptions and other statements that are other than statements of historical fact,
             including, but not limited to, those that are identified by the use of words such as "anticipates,'' "believes,'' "estimates,'' "expects,''
             "intends,'' "plans,'' "predicts,'' "projects'‘, “target” and similar expressions.

             The information included is solely for the use in this presentation and certain information has not been independently verified. No
             representations or warranties, expressed or implied, are made as to, and no reliance should be placed on, the fairness, accuracy,
             completeness or correctness of the information or opinions presented or contained in this presentation. The performance and the
             results of operations of the Group contained within this presentation are historical in nature, and past performance is no guarantee
             of the future results of the Group. Any forward-looking statements and opinions contained within this presentation are based on
             current plans, estimates and projections, and therefore involve risks and uncertainties. Actual results may differ materially from
             expectations discussed in such forward-looking statements and opinions.

             Certain information in this presentation is extracted from Google Analytics and rounded to the nearest thousand. The computation
             method and basis of which have not been verified. The data could be overlapping (a) between different type of devices among TV
             Programme Platform and among Online Shopping Platform if the same user using more than one devices for browsing our Online
             Shopping Platform at the same time; (b) or the same user using HKTVmall app to browse the HKTVmall web-page; (c) if the same
             user using the same device to browse the online shopping mall through different channels/medias on the same device. The
             information for the same period can be changed at different point of time when capturing the data as Google Analytics performs
             the analysis on sampling basis. According to Google Analytics, the definition of “User” is “Users that have had at least one session
             within the selected date range, which includes both new and returning users.” The above data are unaudited and are not indicative
             of the Company’s business performance, financial condition or growth prospect. Readers should not place reliance on these data.

             For figures generated from internal systems and relevant platforms, which were rounded up to nearest integral percentage or
             thousand, are unaudited and for reference only.

             We are not required to correct or update any such statement or information to either reflect events or circumstances that occur
             after the date the statement or information is made or to account for unanticipated events or otherwise.

                                                                                                                                                           2
Agenda
Part I: Operational and Financial Review
By Ms. Alice Wong, CFO
Part II: Business Review and Outlook
By Mr. Ricky Wong, CEO and Vice Chairman
Part III: Q & A
3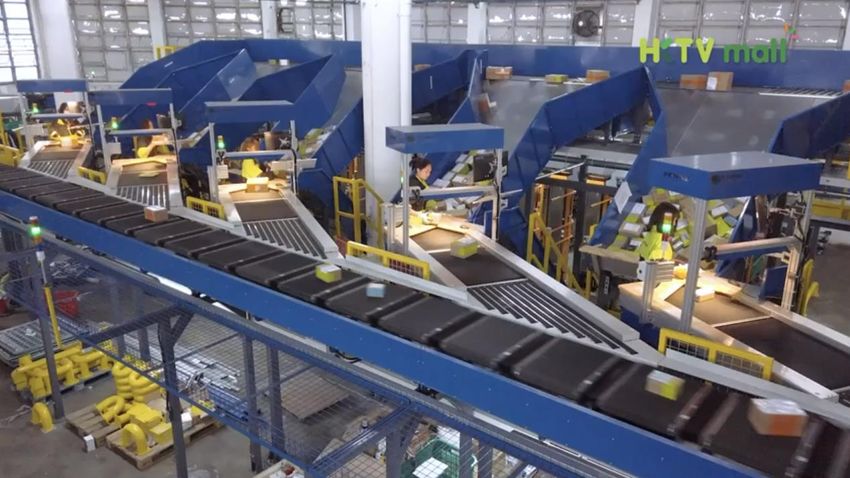
Agenda
Part I: Operational and Financial Review
By Ms. Alice Wong, CFO
Part II: Business Review and Outlook
By Mr. Ricky Wong, CEO and Vice Chairman
Part III: Q & A
4
Largest Online Ecosystem in Hong Kong –
Growth Momentum Continued from 2019 + Acceleration from COVID-19 Pandemic

                                                                                                                                                                                    Average Daily GMV on
  Average                                                                                                                                                                           Order Intake (HK$mn)
Daily Orders                      Average Daily Orders                                                                                                            Jun 2020
  50,000                                                                                                                                                                             Jul 2020
                                                                                                                                                                 HK$ 14.4 mn
                                                                                                                                                                                    HK$ 20.0 mn
                                  Average Daily GMV on Order Intake (HK$mn)
  45,000                                                                                                                                                                                                20.0
                                                                                                                                                         Dec 2019
  40,000                                                                                                                                                HK$ 8.7 mn
                                                                                                                                    Jun 2019
  35,000                                                                                                                           HK$ 7.5 mn                                                           15.0

  30,000

  25,000
                                                                                                                                                                             Jun 2020                   10.0
                                                                                                                                                                         29,800 orders/day
  20,000

  15,000
                                                                                                                                                                   Dec 2019
                                                                                                                                                               18,700 orders/day                        5.0
  10,000
                                                                                                                                                                                         Jul 2020
    5,000                                                                                                                                                     Jun 2019
                                                                                                                                                                                     36,300 orders/day
                                                                                                                                                          15,000 orders/day
         0                                                                                                                                                                                              -

Source: GMV and Average Daily Order – Internal platform and system
Gross Merchandise Value (“GMV”) on order intake represents the total gross sales dollar value for merchandise sold through a particular marketplace over a certain timeframe, before deduction of any
discounts offered by the marketplace, rebate used, cancellation and returns of merchandise sold.
                                                                                                                                                                                                               5
Annualized July 2020 Monthly GMV = HK$7.4bn Home Grown Ecommerce Platform

 Monthly                                                                                                                                                                                 Monthly GMV on
 Number of                               Monthly Number of Orders                            Monthly GMV on Order Intake (HK$'mn)                                                           Order Intake
 Orders                                                                                                                                                                         Jul 2020         HK$'mn
                                                                                                                                                                              HK$ 620.4 mn
 1,400,000                                                                                                                                                                                              600.0
                                                                                                                                                               Jun 2020
                                                                                                                                                             HK$ 431.0 mn
 1,200,000
                                                                                                                                                                                                        500.0

 1,000,000
                                                                                                                           Jun 2019                                                                     400.0
                                                                                                                         HK$ 224.6 mn             Dec 2019
   800,000                                                                                                                                       HK$ 270.8 mn
                                                                                                                                                                                                        300.0
   600,000                                                                                                                                                                 Jun 2020
                                                                                                                                                                     893,000 orders/month
                                                                                                                                                                                                        200.0
   400,000
                                                                                                                                     Jun 2019                                     Jul 2020
                                                                                                                                449,000 orders/month                       1,124,000 orders/month
   200,000                                                                                                                                                                                              100.0
                                                                                                                                                         Dec 2019
                                                                                                                                                    580,000 orders/month
          -                                                                                                                                                                                             -

Source: GMV and Average Daily Order – Internal platform and system
Gross Merchandise Value (“GMV”) on order intake represents the total gross sales dollar value for merchandise sold through a particular marketplace over a certain timeframe, before deduction of any
discounts offered by the marketplace, rebate used, cancellation and returns of merchandise sold.
                                                                                                                                                                                                                6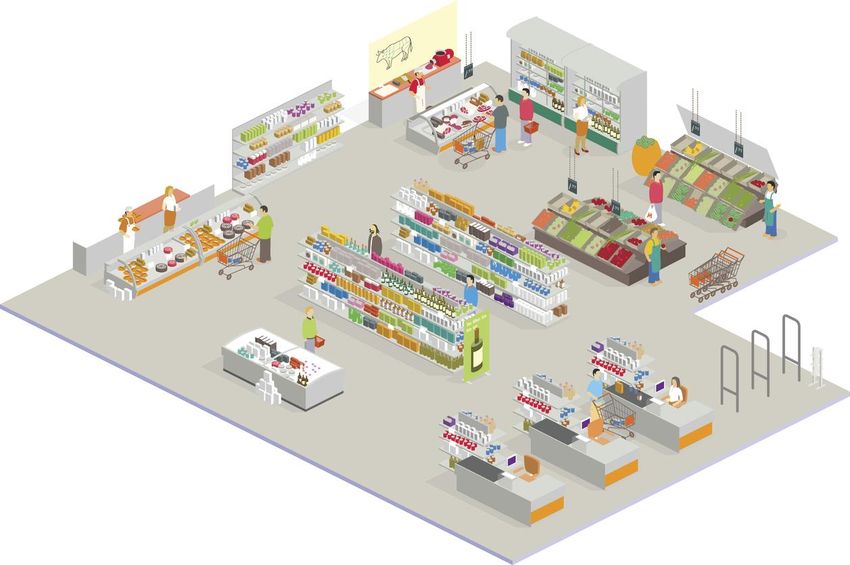
Consolidated Income Statement – Turn Positive!

                                                                          1H2020           1H2019              Variance
                                                                          HK$'000          HK$'000         HK$'000        %
GMV on Order Intake                                                           2,746,512       1,285,809    1,460,703      114%
GMV on Completed Orders                                                       2,689,307       1,234,627    1,454,680      118%

Turnover                                                                      1,339,982         625,547      714,435      114%

Cost of inventories                                                            (676,483)       (375,485)    (300,998)       80%
Other operating expenses                                                       (574,950)       (439,469)    (135,481)       31%
Valuation (losses)/gain                                                          (4,400)          5,850      (10,250)     -175%
Other income, net                                                                31,530          32,641       (1,111)       -3%
Finance costs                                                                    (6,260)         (4,247)      (2,013)       47%
Income tax expenses                                                                (142)           (228)          86       -38%
Profit/(loss) for the period                                                    109,277        (155,391)     264,668      -170%
Profit/(loss) / GMV on Completed order (in %)                                      4.1%          -12.6%

EBITDA/(EBITDA loss)                                                            151,135        (123,921)     275,056      -222%
EBITDA/(EBITDA loss) / GMV on completed orders (in %)                             5.6%          -10.0%

Adjusted EBITDA/(Adjusted EBITDA loss)                                          175,678        (132,699)     308,377      -232%
Adjusted EBITDA/(Adjusted EBITDA loss) / GMV on completed orders (in %)           6.5%          -10.7%

                                                                                                                                  7
Sustainable Growth Momentum

                                  GMV on order intake                                                                                                       Turnover
HK$'M                                                                                                           HK$'M
                   1H2017      2H2017     1H2018      2H2018      1H2019      2H2019      1H2020                                1H2017      2H2017      1H2018       2H2018      1H2019      2H2019      1H2020
3,000.0
                                                                                         2,746.5
                                                                                                                1,400.0                                                                                  1,340.0
2,500.0
                                                                 113.6%                                         1,200.0
                                                                                                                                                                                  114.2%
2,000.0                                                                                                         1,000.0

                                                                              1,493.3                                                                                                           788.4
1,500.0                                                                                                           800.0
                                                                 1,285.8
                                                                                                                                                                                   625.5
                                                     1,074.5                                                      600.0
1,000.0                                                                                                                                                                507.8
                                         816.7
                                                                                                                                                          388.6
                             616.6                                                                                400.0
                453.8                                                                                                                         283.4
 500.0
                                                                                                                                 203.9
                                                                                                                  200.0

     -
                                                                                                                      -

          Gross Merchandise Value (“GMV”) on order intake represents the total gross sales dollar value for merchandise sold through a particular marketplace over a certain timeframe, before deduction of any
          discounts offered by the marketplace, rebate used, cancellation and returns of merchandise sold.
                                                                                                                                                                                                                   8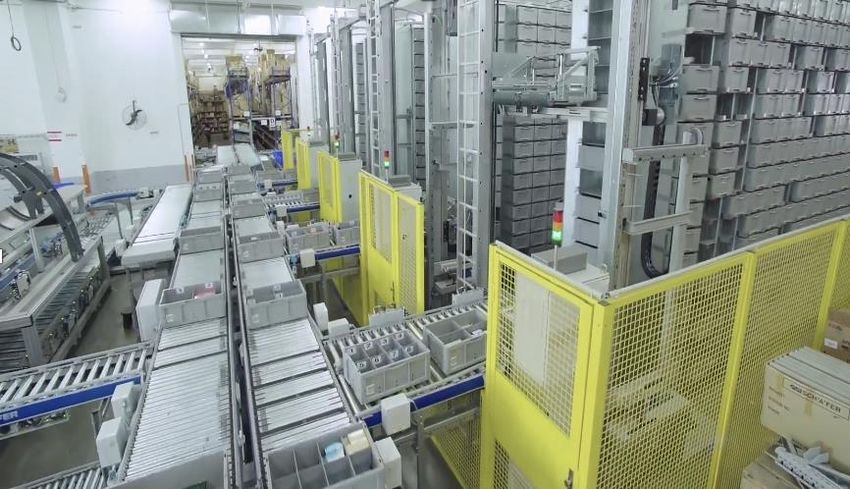
Product Categories Mix – Groceries is the New customer entrance point,
Recurring purchase catalyst and Foundation for cross selling!

               1H2020 GMV on Completed Orders                                                                          1H2019 GMV on Completed Orders

                  Mother and Baby           Others                                                                                             Others
                       5.1%                  6.4%                                                                                              10.8%
                                                                                                                      Mother and Baby
                                                                                                                           5.7%
                                                                                       Groceries                                                                                                 Groceries
      Houseware and                                                                     43.6%
        Household                                                                                                                                                                                 36.8%
          8.3%                                                                                               Houseware
                                                                                                           and Household
                                                                                                                8.3%
    Digital and
    Electronics
       13.0%
                                                                                                                      Digital and
                                                                                                                      Electronics
                                                                                                                         17.1%
                          Beauty and
                            Health
                                                                                                                                                                    Beauty and
                            23.6%
                                                                                                                                                                      Health
                                                                                                                                                                      21.3%

 GMV on completed orders represents the total gross sales dollar value for merchandise sold through a particular marketplace and the customer has obtained control of the promised goods and
 services ordered over a certain time frame, after deduction of any discounts offered by the marketplace, cancellation and returns of merchandise, and is before the deduction of HKTVmall Dollars and
 promotional coupon which is considered as advertising and marketing expenses under management reporting purpose.                                                                                            9
Growing Revenue and Margin reaching 24.8%, up by 3.6% vs. 1H2019

                                                                                                                                                1H2020                    1H2019
    On Completed Orders and Adjusted Basis                                                                                                                                                       Variance
                                                                                                                                                HK$'000                   HK$'000

    Direct merchandise sales
                                         1,2
     GMV on completed orders                                                                                                                          939,411                   500,033                   88%
     Cost of Inventories                                                                                                                             (676,483)                 (375,485)                  80%
     Gross profit                                                                                                                                     262,928                   124,548                  111%
     Gross margin %                                                                                                                                     28.0%                     24.9%

    Income from concessionaire sales and other service income
      GMV on completed orders 1                                                                                                                     1,749,896                   734,594                  138%
      Merchant payments (net off by annual fee, delivery and other service income) 3                                                               (1,346,737)                 (597,277)                 125%
      Income from concessionaire sales and other service income                                                                                       403,159                   137,317                  194%
      Blended commission rate                                                                                                                           23.0%                     18.7%

    Total GMV on completed orders                                                                                                                   2,689,308                 1,234,627                  118%
    Total gross profit and income from concessionaries sales and other income                                                                         666,088                   261,865                  154%
    Blended GP/commission rate                                                                                                                          24.8%                     21.2%

    Other advertising income and licensing income
    Net advertising income                                                                                                                               9,950                      1,868                433%
    Other program license income                                                                                                                           173                      1,825                -91%
                                                                                                                                                        10,123                      3,693                174%
    Remarks:
    1. GMV on completed orders represents the total gross sales dollar value for merchandise sold through a particular marketplace and the customer has obtained control of the promised goods and services
    ordered over a certain time frame, after deduction of any discounts offered by the marketplace, cancellation and returns of merchandise, and is before the deduction of HKTVmall Dollars and promotional coupon
    which is considered as advertising and marketing expenses under management reporting purpose.
    2. For Direct merchandise sales, the GMV on completed orders is before the deduction of HKTVmall Dollars of HK$3,282,000 (1H2019: HK$3,127,000) and use of promotional coupon of HK$10,840,000
    (1H2019: HK$12,813,000).                                                                                                                                                                                          10
    3. For Income from concessionaire sales and other service income, it is before the addition of net HKTVmall Dollars of HK$1,411,000 (1H2019: HK$444,000) and included merchant annual fee amortisation and
    other service income.
Improvement on Gross Profit and Blended Commission Rate
HK$'mn Groceries
Standardized 1,000 60%
Commission Scheme and 900
50%
800 46.2%
Annual Fee 700
42.0% 40.9% 42.0% 42.4% 40.6%
37.4% 40%
effective from 1 Jan 2020 600
35.9% 33.9%
36.5% 36.8% 35.9%
28.6%
500 30%
• Standardized Categorical 400 26.7% 25.4%
23.7% 23.7% 24.6%
25.7% 26.5%
27.0% 26.1%
23.8%
27.1% 28.1% 28.3%
656.2 20%
Commission Scheme 300
515.3
200
291.3 330.6 10%
228.1 234.7
• 100 201.6 218.1
Unified Delivery Method 75.8 95.7 110.2 131.8 160.5
0 0%
• Annual fee with in-mall and
digital advertising value HK$'mn
400.0 Beauty and Health 30%
26.5%
350.0
25%
21.0%
300.0 21.3% 21.8% 21.7% 22.0%
20.0% 20.4% 20.8%
https://cloud.marketing.hktvmall 250.0
19.1% 19.6% 19.3% 19.3%
20.0% 21.2% 20%
19.1% 19.0%
.com/aogplan 200.0 16.9%
17.7% 18.4%
15%
15.5%
14.3% 14.2% 336.5
150.0 297.3
10%
10.8%
100.0 9.2%
7.2% 150.6 171.1
126.5 136.8 5%
50.0 79.4
56.1 73.6 51.9
19.0 24.6 46.3
- 0%
11Improvement on Gross Profit and Blended Commission Rate
HK$'mn
Digital and Electronics HK$'mn Houseware and Household
20.0%
200.0 20% 120.0
17.9%
180.0
16.6%17.0%
17.2% 18% 24.8% 24.5% 25.3% 26.0%
16.3% 23.6% 23.4% 23.5% 25%
160.0 15.1% 15.1% 16% 100.0 22.8%
21.9% 22.3% 23.1% 21.9%
14.4% 20.6%
13.7% 13.8% 13.9%13.2%
140.0 14%
80.0 20%
120.0 13.1% 13.0% 13.0% 12.9%12%
12.1% 11.7% 12.3% 12.2% 12.5% 12.7%
11.8%
100.0 10% 60.0 15%
10.1% 10.0% 183.3 111.4 111.8
80.0 165.8 8%
9.4% 8.8%
60.0 6% 40.0 8.0% 8.3% 8.5% 8.5% 8.1% 7.2% 7.9% 10%
103.2 108.1 96.2 103.2 7.0% 7.1%
95.8 92.5 5.6%
40.0 77.9 4% 55.4
58.9 4.3% 47.2 51.6 50.6 50.3 5%
20.0
20.0 44.7 2% 34.1 34.8 40.0
26.8 31.4 22.6
11.3 14.9
- 0%
- 0%
HK$'mn Mother and Baby 19.6% HK$'mn Others
80.0 18.9% 20%
17.9% 160.0 45%
70.0 18% 46.3%
18.1% 40%
17.6% 17.0% 140.0
16.5% 16% 34.2%
60.0 13.9% 15.8% 15.8% 35%
15.2% 14% 120.0
14.1%
50.0 13.4% 12% 27.1% 26.5% 30%
100.0 24.0%
40.0 10% 21.0% 19.9% 20.8% 22.3% 22.0% 25%
20.5%
69.7 68.3
80.0 18.9% 19.4% 18.2% 18.5%
8% 22.9% 20%
30.0 14.0% 14.4%
5.4% 5.8% 5.9% 6.3% 5.9% 5.5% 4.8% 60.0 122.8
18.0% 12.0% 15%
4.7% 4.9% 6% 102.1
20.0 3.6% 3.3% 4.0% 4.0% 91.1 87.9 15.8% 9.6% 8.9% 9.3% 71.6
35.3 36.7 43.7 46.3 40.0 79.8 73.2 7.2% 10%
29.8 4% 66.3 68.8 66.4 5.6%
59.8
10.0 20.6 23.7 2% 20.0 62.1
72.4
5%
14.5
9.5 8.9 13.0
- 0% - 0%
12Other Operating Expenses –
narrowed by 14.2% as a % of GMV on completed orders
As a % of GMV on 1H2020 As a % of GMV 1H2019 Variance
Functions completed orders HK$'mn on completed orders HK$'000 HK$'mn in %
Fulfillment cost (note 1) 11.4% 306.6 15.9% 196.6 110.0 -4.5%
Marketing and promotion including O2O shop (note 2) 2.5% 66.4 6.1% 75.1 (8.7) -3.6%
Ecommerce operation and supporting functions 5.1% 136.6 9.6% 118.1 18.5 -4.5%
0.0%
Non-cash items (note 3) 2.4% 65.4 4.0% 49.7 15.7 -1.6%
0.0%
21.4% 575.0 35.6% 439.5 135.5 -14.2%
Total GMV on completed orders 2,689.3 1,234.6
Note 1: Included depreciation – right-of-use assets of HK$20.9 million (1H2019: HK$12.7 million), excluded interest on lease liabilities of HK$3.0 million (1H2019: HK$1.5 million).
Note 2: Excluded HKTVmall Dollars and promotional coupon of HK$12.7 million (1H2019: HK$15.5 million) being deducted in turnover, included depreciation – right-of-use assets of HK$21.2 million (1H2019: HK$16.7
million), and excluded interest on lease liabilities of HK$1.3 million (1H2019: HK$1.0 million).
Note 3: For comparison purpose, excluded depreciation – right-of-use assets of HK$42.1 million (1H2019: HK$29.4 million).
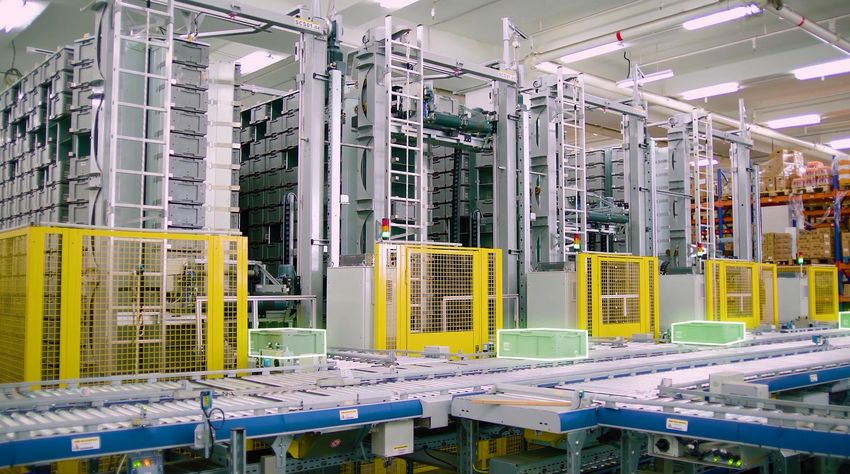
• Fulfillment costs : Efficiency improved from 15.9% in 1H2019 to 11.4% as a % of GMV on completed orders in 1H2020, mainly due to full effect of TKO automated
sorting and storage system in 1H2020, new launch of cross-belt conveying system at Tuen Mun distribution centre since Feb 2020, plus efficiency gain from increase in
number of orders.
• Marketing and promotional costs : if including the HK$12.7mn mall dollars granted and promotional coupon used which was deducted in Turnover for reporting purpose,
the total marketing and promotional costs accounted for 2.9% GMV on completed orders (1H2019: 7.3%). The efficiency was mainly due to nil TVC, reduced company out-
of-pocket on digital advertising as most are bored by merchants and suppliers, and natural growth in online purchase demand in 1H2020. Moreover, increase in shop pick-up
option by customers also resulted in increase in re-charges of shop expenses to Fulfillment costs.
• Ecommerce operation and supporting functions: stable operating costs caused efficiency gain reaching 5.1% of GMV on completed orders.
13Consolidated Statement of Financial Position –
back by solid Liquidity and Properties
Jun-20 Dec 2019 Variance
Note HK$'000 HK$'000 HK$'000 in %
Property, plant and equipment 1 1,130,418 1,139,052 (8,634) -1% 1. Property, plant and
Right-to-use assets 242,695 270,764 (28,069) NA equipment:
Intangible assets 67,189 73,723 (6,534) -9%
Other financial assets (Fixed income and Equity investment)
Non-current 2 349,760 472,284 (122,524) -26%
Scalable Owned
Current 2 68,247 83,268 (15,021) -18% Infrastructure: Included self-
Other receivable, deposits and prepayments 3 127,292 114,779 12,513 11% owned TKO Headquarters plus
Inventories 4 119,568 95,763 23,805 25% Fulfillment Centres of over
Pledged bank deposits 3,905 3,905 - NA 370,000 Sq. Ft;
Cash at bank, in hand and term deposits 669,371 149,713 519,658 347%
Total Assets 2,778,445 2,403,251 375,193 16%
Investment properties with
Accounts payable 242,808 168,718 74,090 44% secured long leased of about
Other payables and accrued charges 5 261,605 178,036 83,569 47% 75,000 Sq. Ft.
Deposits received 5,757 5,757 - 0%
Bank loans - 315,015 (315,015) -100% 2. Strong liquidity with
Lease liabilities 256,185 282,929 (26,744) NA
investment in Other Financial
Deferred tax liabilities 1,086 1,188 (102) -9%
Total Liabilities 767,441 951,643 (184,202) -19%
Assets and cash balance of
approximately HK$1.1 bn.
NET ASSETS 2,011,004 1,451,608 559,396 39%
Share capital 1,746,761 1,293,392 453,369 35%
Reserve 264,243 158,216 106,027 67%
TOTAL EQUITY 2,011,004 1,451,608 559,396 39%
14
14Managed CAPEX for Sustainable Growth
CAPEX excluded right-to-use assets upon adoptions HKFRS 16 (HK$mn)
259.6
241.1 Cash Outflow on CAPEX included Deposits Paid (HK$mn)
131.3 125.1 128.4
111.3 112.7
76.9 77.5 82.4
70.8
62.6 57.5 62.5
46.0 45.8 43.3
26.4
2016 1H 2016 2H 2017 1H 2017 2H 2018 1H 2018 2H 2019 1H 2019 2H 2020 1H
Additions for 1H2020 is mainly for automated fulfillment systems, warehouse equipment, additional
multi-temperature delivery trucks, network server and capacity provisioning, O2O new shops renovation
and equipment, etc.
15
15Agenda
Part I: Operational and Financial Review
By Ms. Alice Wong, CFO
Part II: Business Review and Outlook
By Mr. Ricky Wong, CEO and Vice Chairman
Part III: Q & A
16Tipping Point
1. “Online Supermarket” to “Online Shopping Mall”
2. Final Stage to build “Digital Ecosystem”
• Integral part of the digital lives of HK consumers
• Centre of all digital commercial activities
3. Commercialize our inhouse systems, provide an
end-to-end technical solution to global markets
17The 1st Turnaround to Profit over 5 years!
Turnover increased significantly by 114.2% compared to
1H2019
Gross profit margin (including the gross profit margin for HKTVmall
self-operated stores and commission rates received from other merchants)
increased from 21.2% in 1H2019 to 24.8% in 1H2020
Fulfilment costs accounted for 11.4% of GMV, versus 15.9%
in 1H2019
18Managed Spread reached 13.5% in Q2 2020
58.7%
Spread = (B) - (A)
49.3%
Quarterly Fulfillment Costs as a % of GMV on complete order (A)
41.3%
34.8% Quarterly Blended Gross Margin / Commission Rate (B)
28.2%
24.6% 25.0%
22.6% 21.9% 20.2% 20.4% 20.5% 21.6% 21.3% 21.1% 20.7% 22.1%
19.8%
23.0% 22.0% 21.9% 22.1% 21.5% 19.3% 13.1% 13.5%
21.0% 20.0% 13.9% 11.5% 11.5%
18.5% 17.8% 17.2% 18.0% 15.4%
16.7% 15.9% 8.2%
4.6% 5.7% 4.8%
3.3% 3.6%
0.9% 0.4% 2.0%
-1.1% -0.9%
-6.1%
-12.9%
-19.3%
-26.3%
-40.2%
Q1 2016 Q2 2016 Q3 2016 Q4 2016 Q1 2017 Q2 2017 Q3 2017 Q4 2017 Q1 2018 Q2 2018 Q3 2018 Q4 2018 Q1 2019 Q2 2019 Q3 2019 Q4 2019 Q1 2020 Q2 2020
In 1H2020, other operating expenses including marketing and promotion, Ecommerce operation and supporting functions and
non-cash items only accounted for 10% of the GMV on completed orders
Remark:
1. Quarterly Fulfillment Costs as a % of GMV on complete order included the interest on lease liabilities under HKFRS 16 in relation to fulfillment centre, which is classified as finance costs in the consolidated
income statement.
2. Blended Gross Margin / Commission Rate is calculated before deduction of HKTVmall Dollars and use of promotional coupon (if any), which is considered as advertising and marketing expenses under 19
management reporting purpose.Solid Foundation : Both Variable Cost % & Fixed Cost % Downward
1H2020 1H2019 1H2018 1H2017
As a % of GMV As a % of GMV As a % of GMV As a % of GMV
on completed HK$ million on completed HK$ million on completed HK$ million on completed HK$ million
orders orders orders orders
Fulfilment Costs 11.4% 306.6 15.9% 196.6 18.6% 148.4 24.8% 108.7
Marketing, promotional and
O2O shop operating expenses
2.5% 66.4 6.1% 75.1 5.9% 47.1 5.6% 24.7
Ecommerce operation and
Supporting functions
5.1% 136.6 9.6% 118.1 11.5% 92.0 18.1% 79.2
Major non-cash items 2.4% 65.4 4.0% 49.7 6.1% 48.8 8.0% 35.1
Total Operating Expenses 21.4% 575.0 35.6% 439.5 42.1% 336.3 56.5% 247.7
201st
Question : Why only HKTVmall?
Answer : We own the technology & technical know-how
Online Retail – Offline Retail –
fulfilment in Warehouse fulfilment in Store
• Product Description • Store Location
• Search Engine • Store Renovation
• Fulfilment Design and Automation • Racking Arrangement and
• Last Mile Routing Optimization Display
and Planning
If offline retailers adopt the same operation and manual pick pack flow to online platform, will only bring
• low accuracy
• high picking cost
• infeasible and unsustainable business model
21Their successful experience from Offline does not apply to Online
We successfully build up a profitable model which won’t be easy to replicate
Big Data Analysis 400,000 sq. ft. Largest HK Residential
Auto Warehouses Distribution Network
-18°C
compartment
for frozen
food
0-4°C
compartment
for chilled
food
22Scalable Technology Deployed for Different Fulfilment Purposes
232nd Question: Would HKTVmall survive if Overseas giants march in HK market?
Answer: Sustainable Dominant Position in Hong Kong
Geographical Advantage High Barrier Investment and Innovation
• Cultivated in local market for past 5 • We built HKTVmall ridding on • We do not stop from where we are
years, we are familiar with the unique “Infrastructure” and being “Open- now, but constantly think ways of
consumer habits, operation cost minded”, not on “Sales and doing better by innovation
structures, as well as the Marketing” but Technology
transportation and logistics system in • Invest in various Operational
Hong Kong • We invested 5-year to build high Engineering and TECH Projects to
barriers for others to catch up strengthen our dominant position in
the Hong Kong Online Ecosystem
243rd Question: Will consumers go back offline after the pandemic?
Answer: Once “Online”, hard to go back “Offline”
The COVID-19 pandemic has not “changed” consumer behaviour, but has only
“accelerated” the transformation of the consumer habits.
In the first half of this year, new customers of HKTVmall only accounted for 16.3% of
GMV on order intake, and most of our business growth came from existing customers
acquired in 2019 or before.
We believe, if customers maintain 5 to 6 times of purchase over a period of 6 months,
“online shopping” will become a part of their consumption habits.
25Largest Online Ecosystem in Hong Kong –
Growth Momentum Continued from 2019 + Acceleration from COVID-19 Pandemic
Average Average Daily GMV on
Daily Orders Order Intake (HK$mn)
50,000
45,000 20.0
40,000
35,000 15.0
30,000
25,000
10.0
20,000
15,000
5.0
10,000
5,000
0 -
Jul2018
May 2017
Dec 2019
Dec 2020
Dec 2021
Jan 2017
Jun 2017
Aug 2017
Sep 2017
Oct 2017
Jan 2018
Aug 2018
Oct 2018
Jan 2019
May 2019
Jun 2019
Aug 2019
Sep 2019
Oct 2019
Jan 2020
Aug 2020
Sep 2020
Oct 2020
Jan 2021
Aug 2021
Sep 2021
Oct 2021
Mar 2017
Jul 2017
Nov 2017
Dec 2017
Mar 2018
May 2018
Jun 2018
Nov 2018
Dec 2018
Mar 2019
Jul 2019
Nov 2019
Mar 2020
May 2020
June 2020
Jul 2020
Nov 2020
Mar 2021
May 2021
June 2021
Jul 2021
Nov 2021
Feb 2017
Apr 2017
Feb 2018
Apr 2018
Feb 2019
Apr 2019
Feb 2020
Apr 2020
Feb 2021
Apr 2021
Sept 2018
Source: GMV and Average Daily Order – Internal platform and system
Gross Merchandise Value (“GMV”) on order intake represents the total gross sales dollar value for merchandise sold through a particular marketplace over a certain timeframe, before deduction of any
discounts offered by the marketplace, rebate used, cancellation and returns of merchandise sold. 26Realization of Digital Ecosystem
Open Data
Bank
Big Data
opening up to E-Wallet
build HK a
Opening Smarter City Extending to
Landing Page payment
services, for
Merchants & KOL enhancement of
to build their own consumers’
content page as shopping
traffic generator experience
Shopping
Channel
HKTVmall Lite
Direct sales
Simplified version channel and
for Golden Agers to content
enhance social and HKTVmall marketing
family bonding Food
Offer takeaway
and food
delivery with
location-based
promotions
27Realization of Digital Ecosystem: Open Data Bank
BIG DATA = OIL MINE
• Accumulated substantial customer data in past 5 years
• Open up data to fuel for real growth of HK digital ecosystem
E.g. : Sales Transaction / User Traffic / Logistics /
Warehouse Performance etc.
1st Phrase: Universities / Tertiary Institutions / Research Institutes / Digital Media Agencies / Banks
28Realization of Digital Ecosystem: Food Takeaway
What we have ——
Strong Customer Database Connecting HKTVmall,
Customers & Local Restaurants
• No. of daily visitors: 250,000 customers
• 2020 first half year: 813,000 unique customers • Target launch: Sep – Oct 2020
• 3,000 partnering restaurants
1 out of 10 HK people shopped in HKTVmall
29Realization of Digital Ecosystem: eWallet
• Customer Profiling: by reviewing customers’ online & offline purchasing data
• More integrated view on consumers’ online & offline shopping behavior
30Realization of Digital Ecosystem: Live Shopping Channel
More than a shopping mall
Build stronger partnership with retail brand owners
Create additional in-mall advertising income
31Realization of Digital Ecosystem: Open Landing Page
Content
Customers Providers
Merchants and
Brand Owners
• Customized Product Introduction
• Allow content providers to build & manage
their own content (E.g. Merchants, KOLs) • Tighten the bonding
32Next 3 Years…?
33Hong Kong Market 2020 Outlook and Target
2020 full year Target
(as announced on 1H 2020 2H 2020
9 Jan 2020) Actual Outlook
GMV on HK$2.8bn
Order HK$3.38bn HK$2.75bn ~
Intake HK$3.0bn
COVID-19 pandemic is not expected to slow down completely though people will
have impulse to go out!
Once go online, won’t go back to offline!
34Plan Ahead for Future – CAPEX plan in next 3 years
Current fulfilment systems are capable to handle additional 50% orders.
Start to plan for the next Capacity Expansion
1. Expansion of e-fulfilment centre at Tseung Kwan O Headquarters
- Additional 50,000 square feet
- Anticipated construction cost at around HK$150 million
- Cost for facilities at about HK$50 million
2. Adding the 6th fulfilment centre
- Cost for facilities at about HK$40 million
3. Adding around 200 – 250 delivery trucks
- Cost at about HK$90 million to HK$110 million
4. Upgrade computer hardware and software
35
- Cost at about HK$50 millionCOVID-19 Accelerates the Fundamental Trends in Global Retail
Source: Global Retail Trends 2020 – Preparing for the new reality, KPMG International, May 2020 36If I were a "Traditional Supermarket Operator" and wish to start online,
what issues I need to deal with :
• Which and what kind of system/platform should I use?
• Self-built or using licensed platform?
• What is the business model? Traditional Buy & Sell? Or let FMCG
brands to open stores inside the "Online Supermarket“?
• How to do the pick/pack fulfilment? Using "dark store", existing B-to-
B warehouse or setting up a new B-to-C warehouse?
• How to design the B-to-C warehouse? Who can help (and who is
not a competitor) to design the warehouse?
• What kind of automated machine(s) to be used? How to select?
How to design to be feasible enough to meet the "unknown" and
"dynamic" market?
• How to integrate and connect all these different kind of machines
with their Warehouse Management System?
• How to do the packing for different type of products (frozen and
chilled)?
• How to deliver? By own fleet or 3rd party?
• How to design the a system to optimize the truck utilization, routing,
allocation between own fleet and 3rd party, and service monitoring
• …………
• …………
37Overseas Market
Huge Global Demand for End-to-End Turnkey Solution
An extension from HKTVmall core business to beyond the geographical limitation
- a market-tested and proven profitable solution
- leveraging on our Self-build End-to-End Infrastructure and Technical Knowhow
- to transform and enable the traditional supermarket chains and retailer groups to replicate the unique success and
capabilities of HKTVmall
- CRM
- Machine
Learning
- Big Data eCommerce
Analysis
Online
Customer - Predictive Platform Groceries
Intelligence
Services
- AI Platform
In-mall / FB /
Chatbot Google Digital
Ad with
HKTVmall
audience list
67 O2O
Concept Online
Stores Order
processing Marketplace
Core Business system
Self-run
Multi-
Temperature
Controlled Merchant
Trucks Management
eFulfilment System Online
Centre Payment Ecosystem
e.g. warehousing, Gateway
pick/pack functions
/ eWallet
38Plan to Provide a Turnkey Solution to Global
“eCommerce Marketplace” Investors
Only “piece by piece” “pure” software house & technical engineering
company is available.
No end-to-end turnkey solution provider (busines model consulting,
planning & construction of fulfilment centre, last mile delivery planning
& analysis) is available in global market
Except Ocado in UK, but Ocado only provides solutions for online
grocery store, not for shopping mall/platform (i.e. Amazon model)
We will set up 2-3 overseas offices to develop international business in
coming 6 months
39Ocado Shopify
Providing End-to-End technological Providing End-to-End technological Providing a friendly and easy to use
solution to set up online shopping solution to transform traditional offline system to help everyone set up their
mall/platform, including: grocery stores to online: own online store for selling products
Mission • Business model consulting service • Business model consulting service
• Design & Construction: automated, • Design & Construction: automated,
robotic warehouses robotic warehouses
• Last mile delivery system design • Last mile delivery system design
For who want to compete with Amazon Traditional (forward-thinking) grocery SME Business Owner: who want to
in their own country: retailers who want to set up online open their own online shop
store
Target • Traditional grocery retailers
• Shopping malls
Market Segment • Forward thinking retailers
An All-Round Solution: An Online Grocery Store Total Solution An Online Store Front-end Solution
• Migration path from an online grocery
store to an online shopping mall; then • Set up an online grocery store • Set up an online store
to a digital eco-system • Design & build-up robotic pick-pack
Solutions Provided • Design & Build: I.T. Platform, pick- facilities
pack fulfilment centre, fleet
management system
• Focus on big data analysis and IT
40Ocado Shopify
IT Set-up Support
(For shop/shopping mall)
For Buy & Sell Model (1PL)
Open Model
to All Merchants (3PL)
Design of Pick & Pack Robotic
System
Design & Build Fulfilment
Centre
(For thousands of Merchant Orders)
Last Mile Delivery System
Deign
41Hong Kong is a small city for e-Commerce & us
So we make it global
42You can also read