OM HOLDINGS LIMITED - June 2021 Virtual Analyst Briefing ASX:OMH
←
→
Page content transcription
If your browser does not render page correctly, please read the page content below
1

OM HOLDINGS LIMITED
Australia • China • Japan • Malaysia • Singapore • South Africa

June 2021 • Virtual Analyst Briefing • ASX:OMH
2

DISCLAIMER

This presentation has been prepared and issued by OM Holdings Limited ARBN 081 028 337 (“OMH”). This presentation contains
summary information about OMH. The information in this presentation does not purport to be complete or to provide all
information that an investor should consider when making an investment decision. It should be read in conjunction with OMH‘s
other periodic and continuous disclosure announcements lodged with the Australian Securities Exchange which are available at
www.asx.com.au.

This presentation contains "forward‐looking" statements within the meaning of securities laws of applicable jurisdictions.
Forward‐looking statements can generally be identified by the use of forward‐looking words such as "may", "will", "expect",
"intend", "plan", "estimate", "anticipate", "believe", "continue", "objectives", "outlook", "guidance" or other similar words, and
include statements regarding certain plans, strategies and objectives of management and expected financial performance. These
forward‐looking statements involve known and unknown risks, uncertainties and other factors, many of which are outside the
control of OMH, and its directors, officers, employees, agents or associates. Actual results, performance or achievements may vary
materially from any projections and forward‐looking statements and the assumptions on which those statements are based.
Readers are therefore cautioned not to place undue reliance on forward‐looking statements and OMH, other than required by law,
assumes no obligation to update such information.

OMH makes no representation and can give no assurance, guarantee or warranty, express or implied, as to, and takes no responsibility and
assumes no liability for the authenticity, validity, accuracy, suitability or completeness of, or any errors in or omissions from, any
information, statement or opinion contained in this presentation.

This presentation is for information purposes only and is not a financial product or investment advice or a recommendation to
acquire (or refrain from selling) OMH shares. Before making an investment decision, prospective investors should consider the
appropriateness of the information having regard to their own objectives, financial situation and needs and seek legal and taxation
advice appropriate to their jurisdiction. OMH is not licensed to provide financial product advice, either generally or in respect of
OMH shares.
3

A MANGANESE ORE &
FERROALLOY COMPANY
Vertically integrated manganese ore and ferroalloy
company, involved in mining, smelting, and trading

Powered by sustainable hydro-power, pursuing
growth and natural diversification into new
commodities like silicon metal

23 years on the ASX, OMH offers unique exposure to
the niche manganese and silicon ferroalloy space
(estimated US$27.5bn market in 2019), essential to
steel and the modern world

Lowest cost quartile smelter complex in Sarawak,
the largest of its kind in Asia (ex-China)

Operations in Australia, China, Japan, Malaysia,
Singapore, and South Africa
4
COMPANY SNAPSHOT
Balancing debt reduction with sustainable dividends, refinancing a priority

                  Issued Shares                           738.6 million shares                    $2.00                   Share Price Performance
  Share
                  Share Price                             A$ 0.75                                 $1.50
  Metrics
  (as at 31st     52 weeks Low / High                     A$ 0.29 / A$ 1.00                       $1.00
  May 2021)
                  Market Capitalization                   A$ 554.0 million                        $0.50

                                                                                                  $0.00
  Debt            Total Borrowings                        A$ 415.0 million
  (FY 2020)

  Cash            Cash & Cash Equivalent                  A$ 45.9 million
  (FY 2020)                                                                                      Largest Shareholders (as at 1st Feb 2021)
                                                                                                 Huang Gang
                  Enterprise Value                        A$ 923.1 million                                                                                         14.03%

                                                                                                 Marc Chan, Amplewood Resources Ltd
                                                                                                                                                                   13.57%
                  Adj. EBITDA* (FY 2020)                  A$ 81.4 million
  Earnings                                                                                       Low Ngee Tong
                  EPS (FY2020)                            0.73 cents                                                                                                9.22%
  & Key
                  EV : Adj. EBITDA                        11.3x
  Ratios                                                                                         Heng Siow Kwee
                                                                                                                                                                    8.93%
                  Price Earning Ratio                     102.7x
           *Adjusted EBITDA is defined as operating profit before depreciation and amortisation, impairment write-back/expense, net finance costs, income tax and other non-cash
           items. Adjusted EBITDA is not a uniformly defined measure and other companies in the mining industry may calculate this measure differently. Consequently, the Group’s
           presentation of Adjusted EBITDA may not be readily comparable to other companies’ disclosures.
5
KEY INVESTMENT POINTS
The Largest & Lowest Cost Quartile Ferroalloy Smelter in the Region

 1                                                           2                                       3
     Lowest Cost Quartile                                      One of the Largest and Fast           Prime Beneficiary of
     Ferroalloy Smelter In The                                 Growing Ferroalloy Smelters in        Commodities Supercycle
     Region(1)                                                 the Region(2)
                                                                                                     Driven by surging steel demand and
     Backed by low cost environmentally                        FeSi market share almost doubled      increasing industry usage from
     friendly hydro power from a 20-year                       from 7.3% to 12.5% FY17-19 while      construction, infrastructure, energy
     PPA agreement with Sarawak Energy                         SiMn grew from 7.5% to 16.9% in the   and automotive sectors
     and a 10-year tax holiday                                 same period

 4                                                           5                                       6
     Vertically Integrated                                     Future Growth from Capacity           Strong Executional Track
     Production                                                Expansion & Product                   Record
                                                               Diversification
     Smelting production feedstock is de-                                                            >25 years of operational expertise
     risked by mining production while in-                     Additional 150k MT/pa of Mn alloys    with a solid relationship with
     house trading arm supports sales and                      by FY23 from currently 300k and       shareholders since ASX listing in
     distribution                                              further product mix diversification   1998
                                                               from venture into silicon metal

           Source for (1) and (2): OMH Prospectus (11 June 2021), AlloyConsult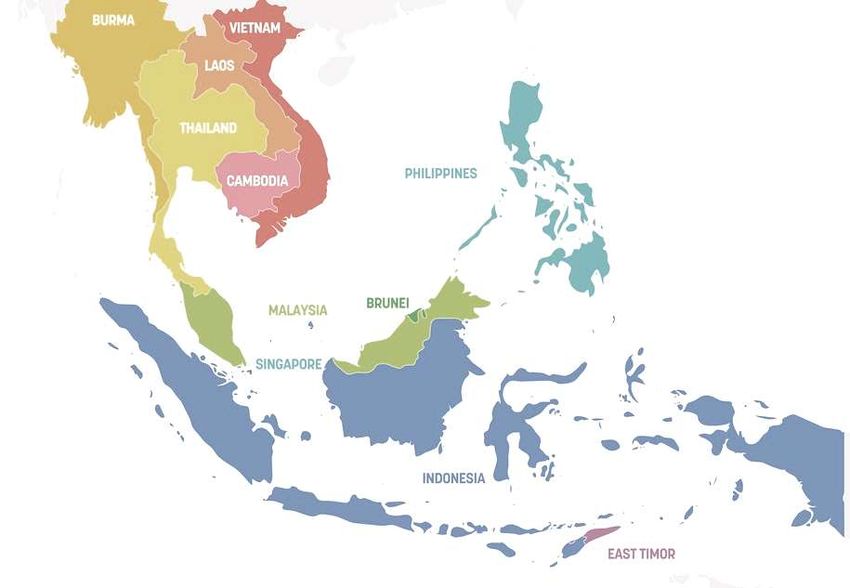
6

OUR OPERATIONS

      Exploration & Mining                                Smelting & Sintering                             Marketing & Trading
  Bootu Creek - Australia                          Qinzhou - China (100%)                             Singapore/China (100%)
  (100%)                                           Mn alloy: 80-95kpta                                Global sales and procurement
  Manganese ore: 0.8 Mtpa                          Sinter ore: 300ktpa                                Manganese ore, Ferrosilicon,
                                                                                                      Silicomanganese, Ferromanganese,
                                                                                                      Quartz, Reductants (coke, coal), Fe
  Tshipi Borwa - South Africa                      Sarawak - Malaysia (75%*)                          units
  (13%*)                                           Mn alloy: 250-300ktpa
  Manganese ore: 3.0-3.6 Mtpa                      Ferrosilicon: 200-210ktpa
                                                   Sinter ore: 250ktpa
                                                   (estimated production capacity)

          * Effective interest held via J/V with               * J/V with conglomerate Cahya Mata
                    Ntsimbintle (a BEE group)                     Sarawak, listed on Bursa Malaysia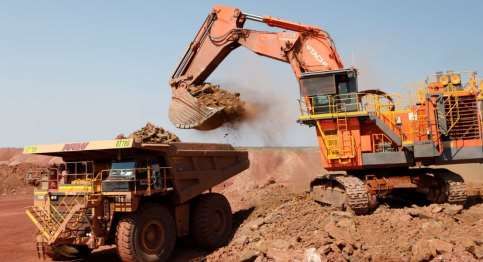
7
THE PROVERBIAL VALUE CHAIN
OMH is a low cost integrated miner + smelter, not a pure play Mn mining company
 Notional size of OMH value flows in an average year
                                                                                                                                           Diagram Scale
 Bootu Creek                                                                                                                                   100 million AUD
                                                         Total Mn                                      Mn Ore Sales
                      Mn Ore Mining                      Ore Book                                                                              200 million AUD
       Tshipi         / Purchases

 Other Mines                                                                                                                           ◦ Ore cost variable in
                                                                                                                                         smelting hedged
   Smelting                                                                                                                              against equity ore
Raw Materials                                                                                         Mn Alloy Sales                     exposure
                                                                                                                                       ◦ No single-commodity /
       Power
                      Ferroalloy                                                                                                         single-market risk
                      Smelting
                                                                                                                                       ◦ Power input costs are
                                                                                                                                         secured and locked-in
  Other Costs                                                                                                FeSi Sales
                                                                                                                                       ◦ Multiple synergies
     + Profit
                                                                                                                                         across value streams

        For illustrative purposes only, scale of flows are representative of the size of operations but not based on any actual year
8
 SAMALAJU INDUSTRIAL PARK: ASIA’S NEW SMELTING HUB

                                                            Sarawak, Malaysia
                                                             ◦ Culturally diverse state, unique
                                                               demographics
                                                             ◦ Low population density
                                                             ◦ Stable operating environment

                                                            Sarawak Corridor of
                                                            Renewable Energy (SCORE)
                                                             ◦ Samalaju Industrial Park -
                                                               supported by 3.3GW* of
                                                               hydropower
                                               OM SARAWAK
                                                            Samalaju Port
                                                             ◦ Purpose built port for Samalaju
                                                               Industrial Park
                                                             ◦ 7km from OM Sarawak
                                                             ◦ Vessels up to 58,000 DWT
                                                               Supramax

*Installed capacity of Bakun and Murum dams.
Source: https://www.sarawakenergy.com/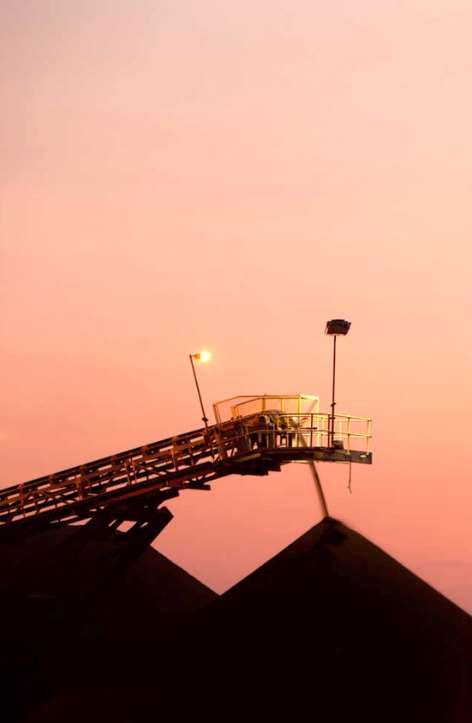
9
 SMELTING – AT THE HEART OF WHAT WE DO                                              FeSi Production Cost Comparison

                                                                                         Electricity         Reductant
                                                                                         Ore                 Other raw material
                                                                                         Labour & other      Export tax
                                                                                         Delivery to Japan

                                                                                    •   Sustainable producer, first-quartile
                                                                                        of cost curve
                                                                                    •   350MW of competitively priced,
                                                                                        reliable power, locked in for 20 years
                                                                                    •   Hands on management
                                                                                    •   Close proximity to the Asian market

                       Lowest Quartile Producer   • Structural Cost Advantage   • Sustainable Hydro-power

Source: AlloyConsult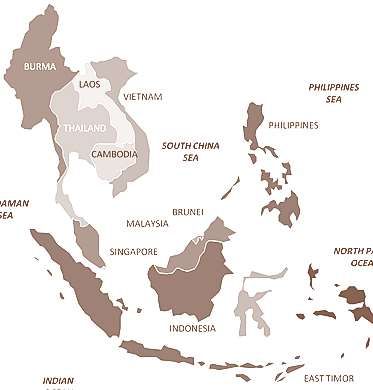
10
OUR PRODUCTS
Critical alloying element to steel - a product essential to basic industries and modern infrastructure

        Manganese Ore                          Manganese Alloys                            Silicon Alloys
Manganese is the 4th most consumed      Main alloying element – Manganese        Main alloying element – Silicon
metal behind iron, aluminium and
copper.                                 •   Deoxidises and desulphurises steel   •   Deoxidises steel
                                        •   Acts as a hardening agent            •   Used in specialty electrical steels
Steel accounts for over 90% of          •   No known substitute and cannot           for transformers
manganese ore consumption, with             be recycled                          •   No known substitute and cannot
batteries a small but growing market.   •   6 manganese alloys furnaces              be recycled
                                                                                 •   10 ferrosilicon furnaces

Products: Manganese Ore                 Products: Ferro-manganese,               Products: Ferrosilicon
                                        Silico-manganese
11
GROWTH OF STEEL IN SOUTHEAST ASIA (SEA)
Regional steel demand remains positive in the long run
South East Asia Addition of steel capacity in SEA
• Surge of foreign investments in SEA steel mills since
steel capacities: 89.4m MT 2 2015 (~25 million MT) 1
• Additional capacity of 61.5 million MT 2 expected from
all identified integrated steel mills in SEA
Rapid urbanization in SEA
• Higher standards of living
• 2.5 billion increase in urban population by 2050 3
• 100 million people expected to migrate into cities in
the next decade 4
Growth of steel
• Expected long term growth prospects spurred by
urbanization growth in the SEA region
• Apparent steel consumption forecast to rebound by 5%
in 2021 (79.3 million MT in 2020 vs 83.2 million MT)5
• Increased demand for steel via infrastructure, transport
and domestic appliances
(1) Internal sources; (2) Organisation for Economic Co-operation and Development (OECD) South East Asia Iron and Steel Institute
(SEAISI) March 2020 presentation; (3) UN Department of Economic and Social Affairs ; (4) The Straits Times; (5) MySteel Global12
SMELTING: RAW MATERIALS TO CRITICAL ADDITIVES
Manganese Ore - Mn High Purity Quartz - Si
Products
Ferro-Manganese Silico-Manganese Ferrosilicon Metallic Silicon
Under Development
Customers
Steel Mills Foundries Chemicals / Solar / Electronics
Some of our Customers:
China Steel Corporation (Taiwan) JFE Steel Corporation (Japan)
Erdemir (Turkey) JSW (India)
Formosa Ha Tinh Steel (Vietnam) Nippon Steel Corporation (Japan)
Hyundai Steel (South Korea) POSCO (South Korea)13
FERROSILICON MARKET REVIEW
Strong demand from steel makers supported prices in Q1
1 2 3
Overall 2020 Q1 2021 28th April 2021
Regional key steel producing countries cut China remains a marginal supplier China increased the export
production by 20%-30% YoY from Q2-Q3 for FeSi for East Asian and South tax for FeSi from 20% to 25%
2020. FeSi prices under downward pressure. East Asian steel mills. to discourage power intensive
industrials.
Steel production recovered faster than FeSi prices largely supported in
expected. FeSi supply tightened. Freight Q1. Expected to provide renewed
costs surged as containers became limited. price support.
FeSi Production
$2,100 (‘000s mt) 600
USD/mt
$1,900
500
$1,700 2
Chinese FeSi Production 400
$1,500
$1,300 3 300
$1,100 1
200
$900
100
$700
Q1 2021 FeSi: $1,526 / mt (+36% YoY)
$500 0
Jan-13 Jan-14 Jan-15 Jan-16 Jan-17 Jan-18 Jan-19 Jan-20 Jan-21
Source: Platts, CNFEOL14
MANGANESE ORE AND ALLOY MARKET REVIEW
Strong demand from steel makers and constrained supply supported prices in Q1
1 2
Overall 2020 Q1 2021
SiMn prices relatively stable but global demand Ore and alloy prices rise with post-COVID growth. SiMn prices
depressed. Price spread between ore and alloy rise significantly higher than correlation implied price,
supported sustainable smelting margins. suggesting supply constraints for manganese alloy smelting.
Mn Ore Index Ore Inventory
USD/dmtu (millions mt)
$10 8.0
Japan SiMn Index Manganese Ore Index
$9 7.0
$1,400
$8 2
$1,200 6.0
$7
$6 $1,000 5.0
$5 $800 4.0
$4 3.0
$600
$3 1
2.0
$2
$1 Q1 2021 Mn Ore : $5.08 / dmtu (+15% YoY) 1.0
Chinese Ports Ore Inventory
Q1 2021 SiMn : $1,120/ mt (+15%% YoY)
$0 0.0
Jan-13 Jan-14 Jan-15 Jan-16 Jan-17 Jan-18 Jan-19 Jan-20 Jan-21
*High Carbon Ferromanganese (HCFeMn) not included due to relatively low
Source: Fastmarkets MB, Platts, the IMnI, and CNFEOL
liquidity and absence of representative non-Chinese Asian benchmark15
FINANCIAL HIGHLIGHTS
A$’million 2015 2016 2017 2018 2019 FY2020
Revenue 338.5 414.2 988.2 1,510.4 1,026.5 784.6
Gross Profit 6.1 60.1 209.6 353.3 152.5 96.3
GP Margin (%) 1.8 14.5 21.2 23.4 14.9 12.3
Adjusted EBITDA* (37.6) 35.0 186.1 339.7 154.5 81.4
Profit/(Loss) Before Tax (131.6) (8.1) 72.6 236.9 58.9 (4.7)
Profit Att. To Owners (122.1) 7.9 92.7 161.7 56.6 5.4
Shareholders’ Funds 87.2 139.7 228.0 388.6 424.9 399.6
Borrowings 570.1 617.6 510.7 512.9 473.9 415.0
Borrowings to Equity Ratio
4.76 3.05 1.77 1.14 0.93 0.89
(times)
EPS (AUD cents) (16.69) 1.08 12.67 22.05 7.69 0.73
Dividend (AUD cents) - - - 5.00 2.00 -
Adjusted EBITDA is defined as operating profit before depreciation and amortisation, impairment write-back/expense, net finance costs, income tax and other non-cash
items. Adjusted EBITDA is not a uniformly defined measure and other companies in the mining industry may calculate this measure differently. Consequently, the
Group’s presentation of Adjusted EBITDA may not be readily comparable to other companies’ disclosures.16
GEARING RATIO LOWERED, POSITIVE CASH POSITION MAINTAINED
Continue to focus on paying down debt
$800 Total Debt 5
4.76 • Repaid A$33.2 million comprising Sarawak
Gearing Ratio
$600
4 project finance loan and other debt in FY2020
A$ million
3.05 3
$400 • Gearing ratio decreased to 0.89 times
1.77 2
$200 1.14 0.93 0.89
1
• Majority of borrowings associated to Sarawak
Project Financing, ring-fenced at asset level
$0 0
FY2015 FY2016 FY2017 FY2018 FY2019 FY2020
Prudent Cash Management
Cash Flow Movements for FY2020 • Recorded positive operating cash flow of
$150 A$76.6 million in line with earnings and
optimisation of working capital
$100
•
A$ million
Capital investment plans re-examined: Capital
intensive projects temporarily postponed to
$50 conserve cash
• Recorded cash and cash equivalent of A$46
$0
million in FY2020, maintaining liquidity for
FY2019 Operating Investing Financing FY2020
Cash Flow Activities
short-term cash needs17
NORMALIZE OPERATIONS IMPACTED BY COVID TO PRE-PANDEMIC LEVELS
10 of 10 Fesi 6 of 6 Mn Alloys
Pre-COVID 65-70 mt / day 100-110 mt / day
Dec 2020 6 of 10 Fesi 6 of 6 Mn Alloys
65-70 mt / day 100-110 mt / day
After 8 Fesi 8 Mn Alloys
65-70 mt / day 100-110 mt / day
Conversion
Working towards full operation of smelting segment:
• Conversion of 2 FeSi furnaces to produce SiMn, parts arrived in Q1 and pending foreign contractor availability
• Restart 2 FeSi furnaces when feasible, pending foreign skilled manpower availability
Key challenges:
• Foreign workforce entry into Sarawak - visas, quarantine requirements, quotas for foreign workers
• Enforcement of movement restriction policy in Sarawak, increasing need to rotate workers18
OPERATIONAL PERFORMANCE Q1 2021
Mn Ore Production Volume (kmt)
Mining Segment (Mn Ore)
• FY2021: Last mile strategy to accelerate mining and production to
570
738 optimize remaining lifetime mining cost
+29%
211 • Lump product grade strategy focused to target 26% Mn in line
FY2019 FY2020 Q1 2021 with increasing plant yields
FeSi Production Volume (kmt)
• Sales of 181,382 tonnes in Q1 2021 (65,138 tonnes in Q1 2020)
Smelting Segments (FeSi and Mn Alloy)
231
-27% 167 • As at March 2021, 12 out of 16 furnaces remain in operation at the
38 Sarawak smelter plant
FY2019 FY2020 Q1 2021 • Full commercial operation restarted at Qinzhou smelter,
contributing to Mn Alloy production volumes
Mn Alloy Production Volume(1) (kmt)
• 2H 2021 production plan may be readjusted. Manpower situation
remains fluid at the Sarawak smelter plant due to existing COVID-
290 19 related restrictions and the need to provide for scheduled leave
-18% 238
rotation for the workforce in dormitories
66
• Production guidance to be provided once available
FY2019 FY2020 Q1 2021
(1) Inclusive of OM Sarawak and OMQ’s production volume19
FUTURE PLANS AND GROWTH
Core fundamentals unchanged, growth plans for both upstream and downstream
Bryah
Resources
14 FeSi
Element 25 Si
701 Mile Silicon
Manganese SiMetal
Raw Material Expanding Capacity Higher Value Add
Development (~Capex A$100-150 mil) (~Capex A$30 mil)
• Explore prospective • Planned for 2023 • Conversion to metallic
manganese silicon to produce higher
• Expected to yield additional
opportunities in central value added products
150ktpa of SiMn
Western Australia • Diversify into
• Manganese capacity
• Expand OMH’s aluminium, chemicals,
expansion with 2 to 4
manganese exposure and solar downstream
33MVA-furnaces for
to extract value across industries
improved efficiency
the entire manganese • Furnaces still able to
value chain • Mn smelting expected to
produce ferrosilicon for
generate highest average
• Entered into binding added flexibility
returns over the full price
offtake agreement
cycle, and improve hedging
with Element 25
ratio with ore20
SECONDARY LISTING ON BURSA MALAYSIA
Primary Listing status: Australian Securities Exchange (ASX)
Secondary Listing status: Bursa Malaysia Securities Berhad (Bursa Malaysia)
Stock code: ASX:OMH | OMH (5298)
OM Holdings Limited
• Upon listing on Bursa Malaysia, all shares quoted on both the ASX and Bursa Malaysia
will be fully fungible.
• Listing Reference Price calculation: ASX closing price on 21st Jun 2021, converted at
Bank Negara Malaysia’s A$:RM closing rate on 21st Jun 2021
TIMELINE
Friday Fri-Wed Monday Tuesday
11 June 2021 11-16 June 2021 21 June 2021 22 June 2021
Launch of Prospectus Commence share removal Announcement of Listing Tentative Listing Date
process from the Australian Reference Price of OMH
to the Malaysian register shares on Bursa Malaysia At least 10 million shares
(at least 3 market days to committed to be made
complete) available for trading on
Bursa Malaysia on Listing
Date21
OM HOLDINGS LIMITED
AUSTRALIA • CHINA • JAPAN • MALAYSIA • SINGAPORE • SOUTH AFRICA22 APPENDIX
23
BOOTU CREEK, NORTHERN TERRITORY, AUSTRALIA
An owner operated mine, wholly owned by the Group since 2007

 OM Manganese Ltd (“OMM”) - 100% Owned
 Mine:       Bootu Creek
 Location:   Northern Territory, Australia
 Product:    Siliceous Manganese Ore
 Capacity:   Ore production 0.8 million mt per annum,
             Ultra fines 0.25 million mt per annum
             (design production capacity)
 Plants:     Crushing + Screening Plant
             HMS Plant
             Tailings Retreatment Classifier (2021)

                                                        Brief History
                                                         ◦ Exploration commenced in 2001
                                                         ◦ Commenced mining at end of 2005, with first
                                                            lot processed and shipped in 2006.
                                                         ◦ Tailings retreatment to commence 2021
24
GREENFIELD IN-HOUSE DEVELOPED SMELTING PLANTS
OM Qinzhou – 100% Owned Malaysia Smelting
Location: Guangxi, China Cost Structure
Product: Manganese alloys (SiMn, HCFeMn),
100%
Sinter ore
Furnaces: 1 x 16.5 and 1 x 25.5 MVA furnaces 90%
Capacity: 80-95ktpa of manganese alloys, 80%
300ktpa of Sinter ore 70%
60%
OM Sarawak – 75% Owned 50%
Location: Sarawak, Malaysia 40%
Product: FeSi, Manganese alloys (SiMn, 30%
HCFeMn), Sinter ore 20%
Furnaces: 16 x 25.5 MVA furnaces
10%
Capacity: 200-210ktpa of FeSi, 250-300ktpa of
manganese alloys, 250ktpa of Sinter ore 0%
FeSi SiMn
75% owned, J/V with Cahya Mata Sarawak Berhad, a leading Power Ore
industrial conglomerate listed on Bursa Malaysia
Reductant Labour & Others
Source: AlloyConsultYou can also read