Interim Results for the Six Months Ended 30 June 2019 September 2019 - Billington Holdings PLC
←
→
Page content transcription
If your browser does not render page correctly, please read the page content below
Interim Results for the Six Months Ended
30 June 2019
September 2019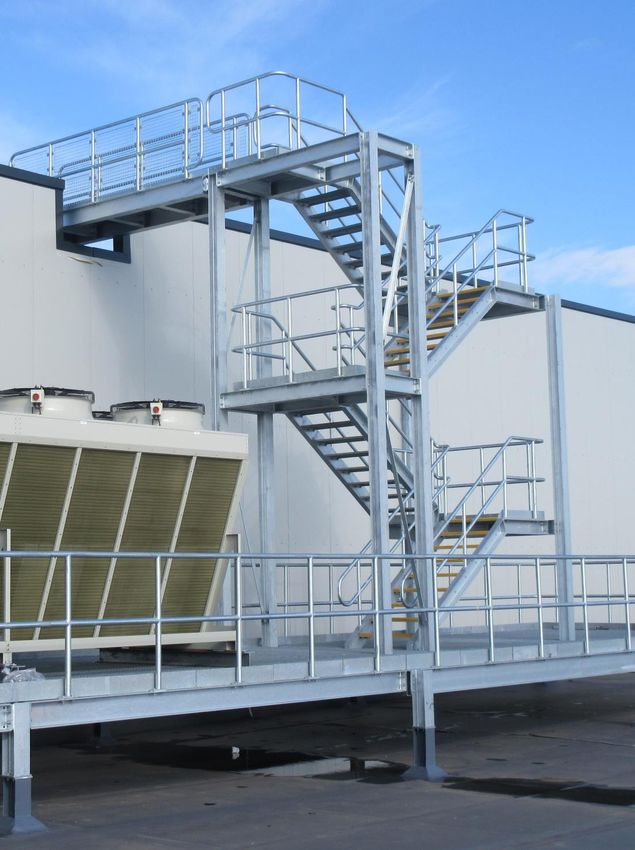
Disclaimer

The content of this promotion has not been approved by an authorised person within the meaning of the Financial Services and Markets Act 2000. Reliance on this promotion for the purpose of engaging in
any investment activity may expose an individual to a significant risk of losing all of the property or other assets invested.

The information in this presentation is subject to updating, completion, revision, further verification and amendment without notice.

This presentation does not constitute, or form part of, any offer or invitation to sell or issue, or any solicitation of any offer to purchase or subscribe for, any shares in the Company, nor shall it (or any part of it)
or the fact of its distribution, form the basis of, or be relied on in connection with, or act as an inducement to enter into any contract or commitment therefore.

This presentation is only being distributed and made available to persons of the kind described in Article 19(5) (investment professionals) and Article 49(2) (high net worth companies, unincorporated
associations, etc.) of Part IV of the Financial Services and Markets Act 2000 (Financial Promotion) Order 2005 (“FPO”) and any investment activity to which this presentation relates is only available to and will
only be engaged with such persons. Persons who do not have professional experience in matters relating to investment or who are not persons to whom Article 49 of the FPO applies should not rely upon this
presentation.

No reliance may be placed for any purpose whatsoever on the information or opinions contained in this presentation or any other document or oral statement, or on the completeness, accuracy or fairness of
such information and/or opinions therein.

No representation or warranty, express or implied, is made or given by or on behalf of the Company or WH Ireland, any of their respective directors, or any other person as to the accuracy or completeness or
fairness of the information or opinions contained in this presentation and no responsibility or liability is accepted by any of them for such information or opinions or for any errors, omissions, misstatements,
negligent or otherwise, or for any communication written or otherwise, contained or referred to in this presentation.

Accordingly, neither the Company nor WH Ireland nor any of their respective directors, officers, employees, advisers, associated persons or subsidiary undertakings shall be liable for any direct, indirect or
consequential loss or damage suffered by any person as a result of relying upon the statement or as a result of any admission in, or any document supplied with, this presentation or by any future
communications in connection with such documents and any such liabilities are expressly disclaimed.

WH Ireland Limited is the adviser to the Company and no one else (whether or not a recipient of these slides) and will not be responsible to anyone other than the Company for providing the protections
afforded to customers of W. H. Ireland Limited for providing advice (financial or otherwise) in relation to the Company. WH Ireland’s responsibilities as the Company's Nominated Adviser and Broker,
respectively, under the AIM Rules of the London Stock Exchange will be owed solely to the London Stock Exchange Plc and not to the Company, to any of its directors or any other person in respect of a
decision to subscribe for or acquire Ordinary Shares. Prospective investors interested in investing in the Company are recommended to seek their own independent financial advice from a person authorised
for the purposes of the Financial Services and Markets Act 2000.

This presentation and its contents are confidential and should not be distributed, published or reproduced in whole or in part or disclosed by recipients to any other person. This presentation is not for
distribution outside the United Kingdom and, in particular, should not be distributed to persons with addresses in Canada, Australia, Japan, Republic of Ireland, Republic of South Africa, or to persons with
addresses in the United States of America, its territories or possession or to any citizen thereof or to any corporation, partnership or other entity created or organized under the laws thereof. Any such
distribution could result in the violation of Canadian, Australian, Japanese, Irish, South African or United States of America law.

The information in this presentation is confidential and must not be copied, reproduced or distributed to others at any time except for the purposes of analysis by certain employees and advisers of the
recipient who have agreed to be bound by the restrictions contained herein.

                                                                                                                                                                                                                          22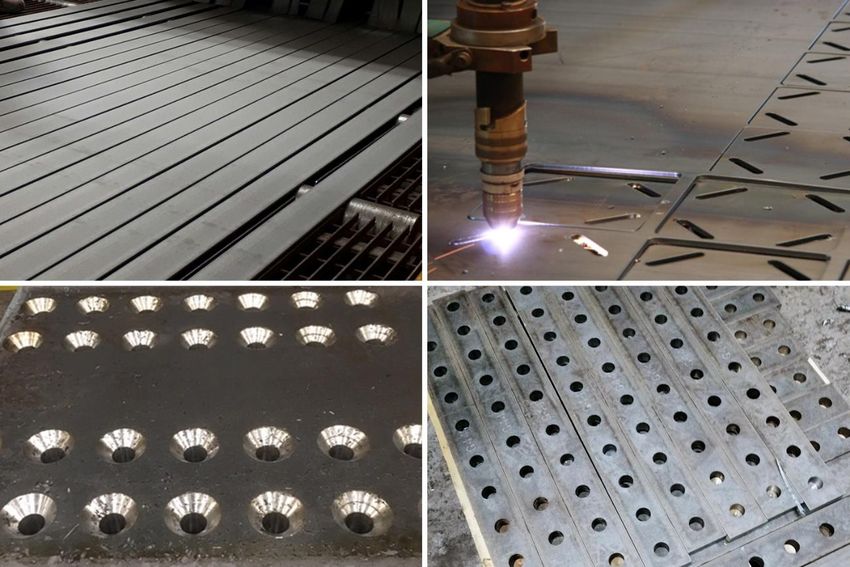
Introduction

•     Billington Holdings Plc is a leading UK structural steel and construction safety solutions specialist.

•     All Group companies performing amongst the best in their respective industries.

•     Record half year turnover for the Billington Group.

•     The Company is the third largest steel fabricator in the UK.

•     Cash generative and strong year end gross cash balance of £10.0m.

•     An annual dividend of 13.0 pence per share (2018: 11.5 pence), representing a yield of 4.8%*.

•     Development of value added, complimentary products and services are planned.

•     The Company has seen consistent growth of revenue, profit and margin over the past five years.

*Based on year end share price of 270p.

                                                                                                               3   3
Operating Divisions

                 Billington Structures Ltd                    Peter Marshall Steel Stairs Ltd
                 Nationally recognised and award-winning      Specialist company engaged in the
                 steelwork contractor, with over 70 years’    design, fabrication and installation of
                 experience. Plants in Barnsley and Bristol   highly engineered steelwork,
                 with capability to process over 35,000       staircases and balustrade systems.
                 tonnes of fabricated steel per annum.

                 easi-edge Ltd                                Shafton Steel Services
                 Leading provider of safety solutions to      A division of Billington Structures Ltd.
                 the UK construction industry.                State-of-the-art steel processing and
                 Primarily supplies perimeter edge            profiling facility.
                 protection and fall prevention systems.

                 hoard-it Ltd                                 Tubecon
                 hoard-it provides re-usable and eco-         A division of Billington Structures,
                 friendly site hoarding solutions.            Tubecon is a specialist in complex
                                                              steel structures. Operates primarily in
                                                              the UK construction and rail
                                                              infrastructure markets.

                                                                                              4          4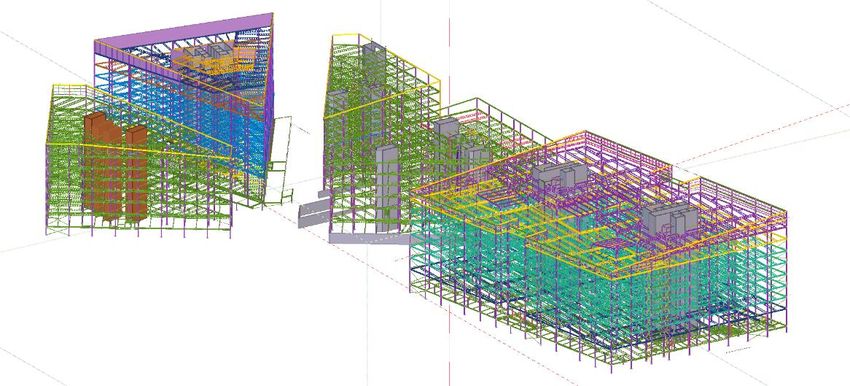
Overview

•   The Group continues to invest into the individual businesses as a result of their continued growth.

•   Positive trading result for the period with encouraging momentum moving into the second half of 2019.

•   Continued delivery of the Group’s largest contract to date, a data centre development situated in Europe.

•   Further opportunities for European works.

•   Strong cash balance at period end.

•   Billington and Peter Marshall Steel Stairs have a strong forward order book, with a good number of further
    potential opportunities spanning into 2020.

•   Management remains cautiously optimistic as a result of Brexit uncertainty.

•   Significant increase in turnover, up 19.7 per cent from 2018.

                                                                                                                     5
                                                                                                                 5
Corporate Profile

London (AIM)                      Ordinary shares in issue

BILN                              12,934,327
Share Price                       Market Cap. (GBP, millions)

315.00p        (as of 16/09/19)   40.74
Major Shareholders
                                                                                Share Price Graph – 12 month period (Source: LSE)
Gutenga Investments PCC Ltd                      49.7%
Otus Capital                                      7.7%
Ocorian Trustees Ltd                              6.8%
Close Brothers                                    9.7%
                                                                Structural                                                           Safety
GPIM                                              5.0%             Steel                                                            Solutions

Advisors
Bankers                      HSBC Plc
NOMAD and Broker             WH Ireland
Auditors                     Grant Thornton
Solicitors                   Walker Morris LLP                           Corporate Structure – Billington Holdings Plc

                                                                                                                                         6      6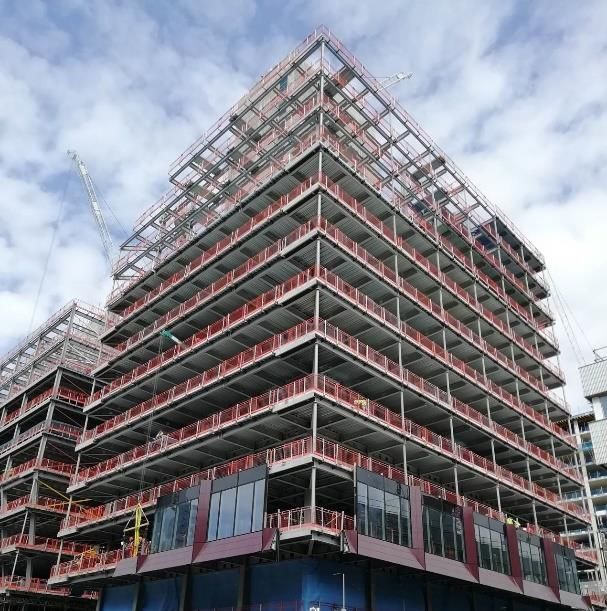
Board of Directors

         Ian Lawson Non-Executive Chairman                                        Stephen Wardell Non-Executive Director
         Ian is a fellow of both The Royal Institute of Chartered Surveyors       Stephen is a member of the Institute of Chartered Accountants in
         (FRICS) and the Chartered Institute of Building (FCIOB) and has a wide   England & Wales (ICAEW), having qualified in 1988. He retired from
         range of skills and experience from working within the construction      KPMG in 2018 having been a partner for nearly 20 years, and recent
         industry for more than 35 years.                                         Senior Audit Partner working with FTSE 100 and 250 boards.

         Mark Smith Chief Executive Officer                                       John Gordon Non-Executive Director
         Mark has an in-depth knowledge of the construction industry with         John practised as a barrister from 1989 until 1999 when he re-qualified
         over 35 years’ experience, driving for growth and profit in              as a solicitor. John is in private practice as a partner in Wilson Browne,
         competitive markets.                                                     specialising in commercial and property litigation. He was appointed to
         Mark joined Billington as COO in June 2014 and subsequently took         the board in 2007, and his legal-commercial background makes him a
         over as CEO from 1 January 2015.                                         valuable member of the team.

                                                                                  Dr Alexander Ospelt Non-Executive Director
         Trevor Taylor Finance Director
                                                                                  Alexander has been in independent practice as a lawyer since 1997.
         A fellow of the Institute of Chartered Accountants in England & Wales    In 1993 he worked as a staff member of Liechtenstein's Representation
         (ICAEW) with over 15 years’ wealth of experience in Construction &       at the UN in New York. From 1994, until establishing his chambers in
         Financial Services.                                                      1997, he practised at the Princely Court of Justice and in a Liechtenstein
         Trevor joined Billington in 2008 and subsequently became Group           law firm. He passed the Liechtenstein Bar Exam in 1997 and has a
         Finance Director in 2011.                                                Doctorate in Law from St. Gallen Uni. in 1999.

                                                                                                                                                 7        7
Structural Steel Market Trend Graph

                                                         UK Consumption of Constructional Steelwork - 2000-2020
                     1,500

                     1,400

                     1,300

                     1,200
    Tonnes (000's)

                     1,100

                     1,000

                      900

                      800

                      700

                      600
                             2000   2001   2002   2003   2004   2005   2006   2007   2008   2009   2010   2011   2012     2013   2014   2015   2016   2017   2018   2019   2020

                                                                              Tonnes - actual        Tonnes - projected

Data Source: BCSA / Steel for Life

                                                                                                                                                                                  8
                                                                                                                                                                            8
The Steel Industry

•   British Steel / Official Receiver (OR) in talks with preferred
    bidder – Ataer Holdings and operating under a period of
    exclusivity.

•   Sale is anticipated to be completed in the near future and
    is expected to stabilise the steel supply market.

•   Consistent price for rolled sections in the period.

•   Arcelor Mittal continues to service the UK structural
    steelwork market.

•   Steel scrap and coking coal prices have seen a material
    decline in the period.

                                                                         9
                                                                     9
Steel Manufacture – Raw Materials

         Data Source: British Steel

                                           10
                                      10
Interim Results for the Six Months Ended
30 June 2019
September 2019
11
11Highlights
• Continued strong revenue growth.
• Positive contribution from all Group divisions.
• Excellent progress at easi-edge and hoard-it with each increasing hire stock levels in the period.
• Margins remain varied across sectors, complexities and timescales.
• Gross (net) cash balance of £10.0m (£8.4m).
• A number of large project opportunities for 2020.
• Dividend paid of 13.0 pence per share in respect of 2018 (2017: 11.5 pence per share).
• Continued expansion of apprenticeship schemes.
12
12Results Overview
• Increase in share price of 80% over the last five years (175p September 2014 – 315p September 2019).
• Areas of diversification have been identified and plans currently being formulated.
• Cash conversion expected to continue in the second half.
• Adequate agreed financing in place to fund business expansion and WIP requirements.
• Main contractors financial stability under constant review.
• Primary trading customers continue to perform amongst the best in the industry.
• Continued investment and progression in apprentice and training programmes to develop key talent.
13
13The Impact of Shafton
• Site located five miles from Head Office in Barnsley.
• Shafton Steel Services to offer steel profiling and processing
services to the wider fabricator / engineering markets.
• New machinery installed in the period, increasing overall Group
capacity.
• Heavy-lifting capacity in all buildings.
• Modern CNC steel processing equipment.
• Enhances the Group’s current steel processing abilities.
• Provides the resources to develop further business opportunities.
• Facility to be adapted for optimum production.
• Programme of site / building repairs / upgrades largely complete.
14
14Where have we been - Five Year Summary
Revenue (£m) Net Assets (£m) Profit Before Tax (PBT) (£m)
77.3 23.5
80 73.5 25 6
22.0 4.9
5 4.4
70 63.3 18.8
20 3.8
56.8 16.4 4 3.1
60
14.3 3
15 1.9
50 45.1
2
40 10 1
2014 2015 2016 2017 2018 2014 2015 2016 2017 2018 2014 2015 2016 2017 2018
Earnings Before Interest, Tax, Earnings per Share (EPS) (pence) Average Number of Employees
Depreciation and Amortisation 40 379
33.6 400 340 360
(EBITDA) (£m) 29.0 284 296
30 25.4 300
8 6.5 21.2
6.1
6 5.1 20 200
4.2 12.5
4 2.7 10 100
2 0 0
2014 2015 2016 2017 2018 2014 2015 2016 2017 2018 2014 2015 2016 2017 2018
15 15Financial Summary
Revenue - £m Profit Before Tax - £m
90 6.0
80
5.0
70
32.9
60 4.0 2.5
37.9
39.2 3.0
50 2.2
36.2 3.0
40 32.2 2.1
1.4
23.8 2.0
30
20.4
47.1 1.1 2.7
20 39.4 2.2
34.3 1.0 1.9
24.6 27.1 1.7 1.7
10 17.2 21.3 0.5 0.8
- 0.3
0
2013 2014 2015 2016 2017 2018 2019 2013 2014 2015 2016 2017 2018 2019
1st Half 2nd Half 2nd Half Projected - Latest WHI Brokers Nt 1st Half 2nd Half 2nd Half Projected - Latest WH I Brokers Nt
• Consistent, steady growth of Revenue and Profit
16
16Financial Summary
Six months to Six months to
£’000
30 June 2019 30 June 2018
Revenue 47,148 39,389
Total costs (excluding depreciation) 43,601 36,847
EBITDA 3,547 2,542
Depreciation 862 586
Group operating profit 2,685 1,956
Net finance costs (6) (17)
Profit before tax 2,679 1,939
Taxation (531) (395)
Profit from continuing operations 2,148 1,544
Earnings per share 17.8p 12.8p
• Revenue increase of 19.7% • EPS increased 39.1% to 17.8p
17
17Balance Sheet
£’000 30 June 2019 30 June 2018
Non-Current Assets 15,780 15,890
Current Assets 34,584 26,979
Total Assets 50,364 42,869
Current Liabilities (24,327) (18,785)
Non-Current Liabilities (1,375) (1,914)
Total Liabilities (25,702) (20,699)
Net Assets 24,662 22,170
18
18Cash Flow
£’000 30 June 2019 30 June 2018
Profit after tax 2,149 1,544
Net cash flow from operating activities 804 (99)
Net cash flow from investing activities (545) (417)
Net cash from financing activities (1,711) (1,529)
Cash at beginning of period 9,311 8,063
Cash at end of period 10,008 7,562
19
19Forward Order Book
Forward Order Book - Sales to Invoice - 5 Year History
£m - Order Book
Feb '14 Aug '14 Feb '15 Jun '15 Mar '16 Aug '16 Dec-16 Mar-17 Jun-17 Dec-17 Mar-18 Jun-18 Dec-18 Mar-19 Jun-19
20
20Divisional Breakdown
2019 of Divisional Breakdown 2018 Divisional Breakdown
5% 3% 5% 3%
3% 5% 6%
4%
84% 82%
Billington Structures Easi-edge Marshall Steel Stairs Billington Structures Easi-edge Marshall Steel Stairs
Hoard-it Shafton Hoard-it Shafton
21
21Divisional Highlights
• Structural Steel business accounts for 84% of Group
revenue.
• Solid performance from easi-edge, hoard-it and Peter
Marshall Steel Stairs.
• Number of larger project tenders in the marketplace.
• hoard-it continues to establish itself as the hoarding
supplier of choice for the principal contractor
industry.
• New improved design barrier implemented into the
marketplace at easi-edge with stock levels increased
again in the period.
22
22Divisional Highlights
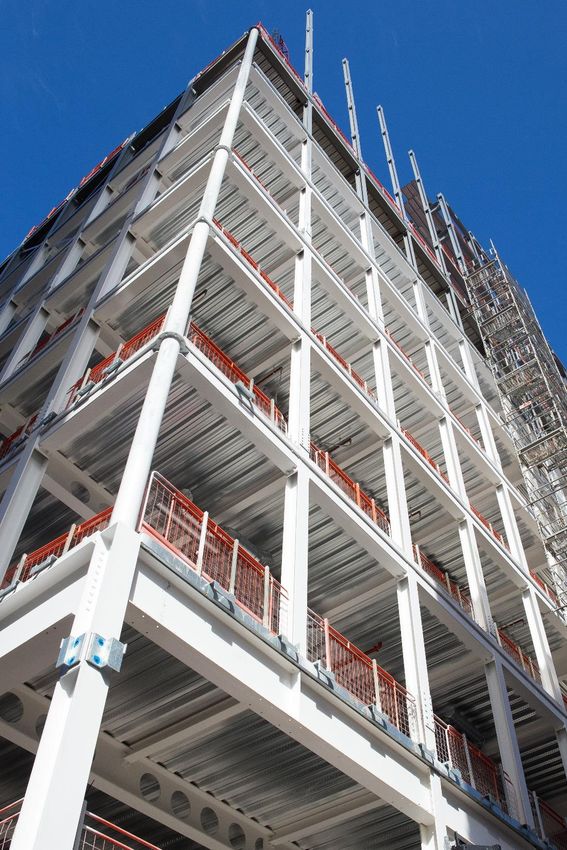
Recent Projects:
• Circle Square, Manchester – Sisk
• 4 Wellington Place, Leeds – Wates
• Data Centre development, Europe – ISG
• Better Barnsley – Henry Boot
• First Way, Wembley – Bowmer & Kirkland
• Pinewood Studios – Sir Robert McAlpine
23
23Divisional Highlights
Recent Projects:
• 100 Liverpool Street – William Hare
• Aldi, Darlington – DSP Construction
• Bardon Hill, Leicester – Aggregate Industries
• Pinewood Studios – Billington Structures Ltd
• Cobalt, Didcot – SDC
• Data Centre development, Europe – ISG
• Battersea Development – William Hare
24
24Divisional Highlights
Recent Projects:
• 4 Wellington Place, Leeds – Billington Structures Ltd
• Data Centre development, Europe – ISG
• Circle Square, Manchester – Billington Structures Ltd
• Ark Blake, London – Wates
• Blundell Street, Liverpool – ISG Construction
• Merseyside Police, Liverpool – Willmott Dixon
• New Bailey, Manchester – Bowmer & Kirkland
25
25Divisional Highlights
Recent Projects:
• Wembley Stadium – Quintain
• Circle Square, Manchester – Sisk
• Northgate House, Oxford – BAM
• Princes Quay Street, Hull – Interserve
• Centenary Square, Birmingham – Galliford Try
• Edinburgh Airport – Balfour Beatty
26
26Divisional Highlights
Services include:
• Oxy Gas & HD Plasma Profiling
• CNC Plate Drilling
• Bevel Head Plasma Profiling
• Shear Punch Drill Fittings
• Shotblasting & Primer Painting
• Section Sawing & Section Drilling
27
27Awards
Public Vote winner of the 2019 UK Tekla Awards with the
Wellington Place development in Leeds.
Billington Structures has also been shortlisted for
the 2019 Structural Steel Design Awards with
Ingenuity House in Birmingham.
Results announced in
October 2019.
28
28Contacts
Billington Holdings Plc: Tel: 01226 340 666
Mark Smith, Chief Executive Officer Web: www.billington-holdings.plc.uk
Trevor Taylor, Finance Director @BillingtonSteel
W H Ireland Limited: Tel: 020 7220 1666
Chris Hardie
James Sinclair-Ford
Jasper Berry
IFC Advisory Limited: Tel: 020 3934 6630
Tim Metcalfe Email: billington@investor-focus.co.uk
Miles Nolan
Zach Cohen
29
29You can also read