Numerical and Experimental Study of Fatigue Strength - Mechanical Stress/Strain Estimations of Thin DP600 Sheets Assembly Using Laser Welding ...
←
→
Page content transcription
If your browser does not render page correctly, please read the page content below
24ème Congrès Français de Mécanique                                         Brest, 26 au 30 Août 2019

    Numerical and Experimental Study of Fatigue
  Strength - Mechanical Stress/Strain Estimations of
  Thin DP600 Sheets Assembly Using Laser Welding
            A. KOUADRI-HENNIa,b, A. GAVRUS b, M. COSTACHEc

a. ROMAS, Laboratory of Digital Sciences of Nantes (LS2N), UMR CNRS 6004, 1 rue de la
               Noë, 44300, Nantes, France, afia.kouadri-henni@insa-rennes.fr
 b. INSA Rennes, Laboratory of Civil and Mechanical Engineering (LGCGM), EA 3913, 20
     avenue des Buttes de Coësmes, 35708, Rennes, France, adinel.gavrus@insa-rennes.fr
   c. UPB, University Politehnica Bucarest, 313 Splaiul Independenței, Sector 6, 060042,
                          Romania, costache.marian31@yahoo.com

Résumé :
Cet article scientifique propose une analyse expérimentale et numérique de la résistance à la fatigue
élasto-plastique à l'aide des essais de traction cycliques uni-axiaux (N = 10000 cycles) pour des
assemblages de tôles d'acier minces DP 600 soudées en configuration en clin. Les résultats présentés
en termes des courbes de fatigue ou de durée de vie exprimées par les variations de forces et de
déformations avec le cycle de chargement, voire de la distribution spatiale des déformations
plastiques et des contraintes résiduelles obtenues à la fin d'un cycle faible de fatigue, ont été obtenues
partant de modélisations numériques éléments finis avec Abaqus. Un maillage tétraédrique linéaire à
quatre nœuds C3D4 est utilisé ensemble avec un modèle de comportement de type écrouissage
isotrope et des conditions limites exprimées par l'amplitude du déplacement cyclique imposée à un
maximum de 16 mm et une fréquence de 25 rad/s. Afin de comparer la robustesse du soudage laser
Nd: YAG de l’acier DP600, trois différentes configurations de traction à faible cycle de fatigue sont
analysées: un simple feuille mince d'une épaisseur de 1,25 mm, un assemblage parfait ou idéal de
deux feuilles identiques chevauchés sans aucun gap et un assemblage de feuilles obtenu par soudage
laser avec un gap de 0,1 mm. Les résultats obtenus montrent qu'après un chargement par traction
cyclique, les contraintes résiduelles sur la zone centrale de l'assemblage des feuilles ont des valeurs
plus faibles pour l'ensemble en soudage laser par rapport à l'échantillon simple et relativement
proches du cas d'assemblage surnommé parfait ou idéal. Il est alors possible de conclure à la bonne
fiabilité du procédé de soudage au laser utilisé.

Mots Clefs: Soudage laser, acier DP600, contraintes résiduels, fatigue
elasto-plastique, simulation numérique

Abstract :
This scientific paper proposes an experimental and numerical analysis of elasto-plastic fatigue
strength using uni-axial cyclic tensile tests (N = 10000 cycles) of assemblies obtained from overlapped
24ème Congrès Français de Mécanique                                        Brest, 26 au 30 Août 2019

thin DP 600 steel sheets. The presented results in terms of fatigue or strain-life curves, strains and
residual stresses spatial distributions obtained at the end of a low fatigue cycle have been taken from
an Abaqus Finite Element Modelling. A four-node linear tetrahedron C3D4 mesh is used together with
an isotropic hardening model and cyclic loading with boundary condition expressed in terms of an
amplitude displacement of max 16 mm and a frequency of 25 rad/s. In order to compare robustness of
a DP600 steel’s Nd:YAG laser-welding, three different low cyclic fatigue tensile configurations are
analysed: a simple thin sheet with thickness of 1.25 mm, a perfect or ideal welding assembly of two
identical sheets overlapped without any gap and a laser welding sheet’s overlapped assembly with a
gap of 0.1 mm. The obtained results show that after the cycling tensile loadings, the estimation of
residual stresses on the central welded specimen area has in the case of the laser-welding assembly
lower values as compared to the simple tensile specimen and relatively close values to the named
perfect or ideal assembly case. It is then possible to conclude on the good reliability of the used laser
welding process.

Key Words: Laser welding, DP600 steel, residual stresses, elasto-plastic
fatigue, numerical simulation

1       Introduction
In the car manufacturing industry the actual main goal to have a better fuel economy with a minimal
CO2 environmental impact requires to use lighter weight materials having better mechanical properties
and possible recycling processes. It is the principal reason than the most used metallic materials in the
automotive industry are the aluminum alloys and the dual phase (DP) steels. Concerning the assembly
process of car body parts the welding ability together with a high fatigue life strength properties are
critical to their successful exploitation. Laser welding assembly technology is today used widely in
many industrial fields such as spaceflight, aeronautics, naval and automotive production. It is
generally characterized by low heat input, high welding speed, high penetration, easy automation, high
accuracy, fast and robotic production lines. Laser-welded structures are often subjected to dynamic
service loadings ranging from cyclic fluctuations to completely random ones. Unfortunately the laser-
welded lap joints suffer from defects resulting in the notch effect and surface cracks, residual strains
and residual stress, etc. The fatigue strength of the laser-welded lap joints is reduced significantly
because the presence of these defects. Therefore, the mechanical strength of laser welded structures
must be defined in terms of the fatigue strength and residual stress of the obtained joints or assemblies
[1-4]. Furthermore fatigue failures occur when metal is subjected to a repetitive or fluctuating stress
and will fail at a stress much lower than its tensile strength or stress-strain behavior. In order to
analyze the above discussed effects this scientific paper proposes an experimental and numerical
analysis of elasto-plastic fatigue strength using uni-axial cyclic tensile tests (with N = 10000 cycles)
of assemblies obtained from overlapped thin DP 600 steel sheets.
The presented results in terms of fatigue or strain-life curves, strains and residual stresses spatial
distributions obtained at the end of a low fatigue cycle were taken from an Abaqus Finite Element
Modelling using a four-node linear tetrahedron C3D4 mesh and simulations with an isotropic
hardening model and a cyclic amplitude displacement boundary condition of max 16 mm with a
frequency of 25 rad/s. In order to compare robustness of a DP600 steel’s Nd:YAG laser-welding, three
different low cyclic fatigue tensile configurations are analyzed: a simple thin sheet with a thickness of
1.25 mm, a perfect or ideal welding assembly of two identical sheets without any gap and an laser
welding sheet’s assembly with a gap of 0.1 mm [5].
24ème Congrès Français de Mécanique                                                              Brest, 26 au 30 Août 2019

2       General Considerations
Previous studies [6] showed that laser welding of DP steels lead to the formation of a soft zone in the
subcritical area of the heat-affected zone (HAZ) and consequently the tensile properties of the welded
joints were significantly influenced by the presence of such a soft zone. Then it is important to
understanding on how this soft zone influences the fatigue properties of laser welded DP steel joints.

While a significant amount of material working has been reported on the tensile loadings of laser
welded DP steel joints, the knowledge of the corresponding fatigue properties concerning the joints is
still limited. As components of structural applications the laser welded DP steel joints with soft
material area might be prone to a failure under cyclic loading condition. It is then necessary to
characterize the fatigue resistance under cyclic loading.

                                     450

                                     400
                Microhardness (VH)

                                     350

                                                    Soft Zone                       Soft Zone

                                     300                                                         2.2kW
                                                                                                 2.7kW
                                     250

                                                                Fusion Zone (FZ)                     BM
                                               BM
                                                          HAZ                            HAZ
                                     200

                                     150
                                           0        0,5     1   1,5      2    2,5    3     3,5   4        4,5   5
                                                                      Displacement (mm)
                Fig.1. Typical microhardness profile of the laser welded DP600 steel joint [6]

Regarding the micro-hardness profile of laser welded DP600 steel joints (Figure 1), for the fusion zone
(FZ) this one is significantly higher as compared to the base metal (BM). The SEM examinations of
this region indicated that the microstructure in the FZ area of DP600 joints was predominantly
martensitic in conjunction with some side-plate of ferrite and bainite. The variation of hardness which
occurs in the FZ zone of DP600 welded joints would reflect the presence of such multi-constituent
microstructure. The formation of martensitic phase in the fusion area it is a result of rapid cooling of
the weld pool during the laser welding process.

It is seen from Figure1 an important hardness variation from the fusion zone (FZ) to the called soft
area (HAZ) which has relatively slightly lower hardness values than in the base metal (BM). The
presence of this hardening gradient close to the soft HAZ area of the DP600 welded joints is mainly
due to the tempering of pre-existing martensite [7-10] along the bainite developed in a ferrite matrix.
The micro-hardness values in the BM region of the DP600 welded joints is almost constant, since the
microstructure (i.e. martensite in a ferrite matrix) in this region which is far from the center of FZ
remained unaffected by the thermal cycle of laser welding.

At higher stress amplitude, although the slight drop of the hardness on the FZ-HAZ transition toward a
relatively stationary state on HAZ and BM area, the hardness variations is not enough large to reduce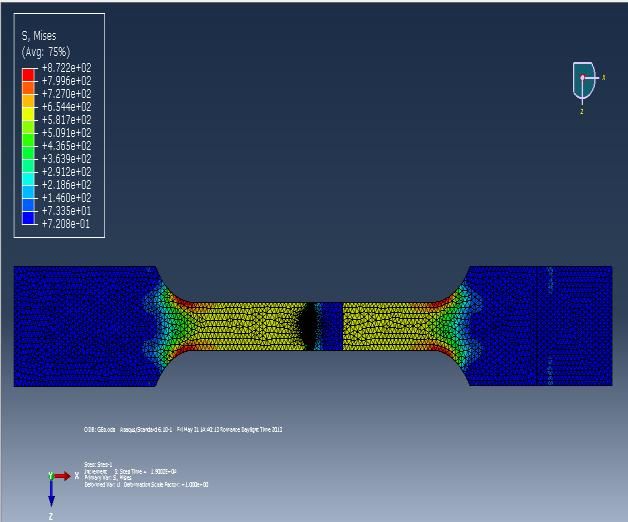
24ème Congrès Français de Mécanique                                              Brest, 26 au 30 Août 2019

the fatigue strength and thus the effect of laser welding on the fatigue resistance of DP600 steel could
be negligible. Previous studies shows that the DP600 welded joints were found to have a slightly
lower fatigue limit than that of the base metal. Indeed the base metal and the welded joints showed
almost the same fatigue life within the experimental scatter at higher stress amplitudes.

2.1 Used specimen
Blanks DP600 steel with 1.25mm thickness are welded by Nd: YAG laser welding machine using a
4kW generator with an arm robot type Fanuc R2000iB. The laser beam is transmitted by optical wire
of 200μm diameter with a 560μm laser focus spot diameter and a focal length of 583.5mm
corresponding to a reference of focal point position on the upper surface of the sheet metal. A gap of
0.1mm, controlled by pre-positioned standard plug gauge between two sheets, is used. The samples
geometry and dimensions used for tensile fatigue tests can be seen in Figure 2 and Table 1.

                 Fig. 2. Geometry of the fatigue test specimens used in the present study [5].

        Tab. 1. Specimen shape characteristics and geometric dimensions
         Shape Characteristics   L       A       W      R      B           C      Gap       Thickness

         Dimensions (mm)         200     80      10     15     47.31       25     0.1       1.25

Each welded specimen’s assemblies have a base metal zone (BM) and a fusion zone (FZ) with
different rheological behavior as can be seen in the Figure 1.

2.2 Fatigue strength
A lot of fatigue tests are performed at what is referred to as “Constant Amplitude” and “Constant
Frequency” which merely refers to the fact that the maximum and minimum stresses are constant for
each cycle of a test. S-Nf diagram refers to a plot of Constant Amplitude Stress Level (S) versus
Number of Cycles to Failure (Nf). The corresponding curves are generally plotted on semi-log or log-
log coordinates where each dot represents the results of a single test specimen.
The following equation describes the relation between the alternating stress S, the ultimate tensile
strength Su and the fatigue life of mild steel [11]:

                                          S = 10CNfb for 103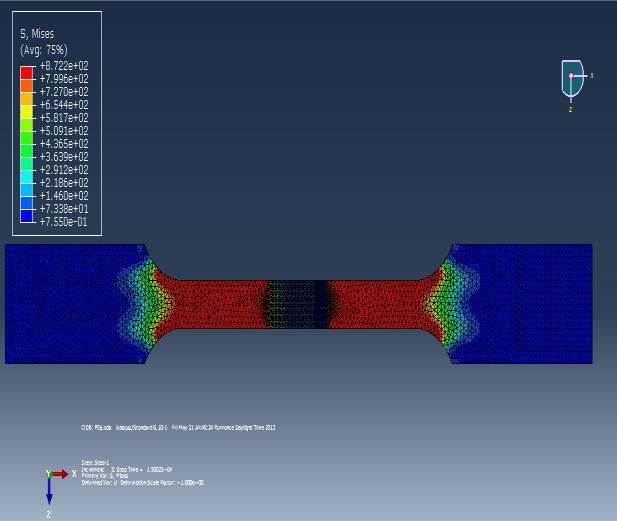
24ème Congrès Français de Mécanique Brest, 26 au 30 Août 2019
S2 1 S
C log10 1000 ,b log10 1000 (2)
Se 3 Se
Here S1000 = 0.9Su and Se = 0.5Su represents the fatigue limit of the material. When fatigue load is
applied to the laser-welded lap joint, the resultant multi-axial stress distribution, including residual
stress effects, can be determined via numerical simulation. To obtain the equivalent uniaxial stress
corresponding to the multi-axial stress state, a Sine's method [11] was used and it can be written:
1/ 2 SN
2 2 2 m m1 m2 m3 2 (3)
1 2 2 3 3 1
K
where σ1, σ 2, and σ 3 are the alternating principal components of stress, σ m1, σ m2 and σ m3 are the mean
components of stress tensor, m is a coefficient of the mean stress influence, K is the fatigue notch
factor and SN is the uniaxial full reversed fatigue stress that is expected to give the same life as the
multi-axial stress state for smooth specimens. Substituting the values of alternating and mean stresses
obtained by finite element analysis into Eq. (3), the uniaxial fatigue stress SN can be obtained.
2.3 Fatigue behavior
Many load controlled fatigue tests indicated that while the welded joints had a slightly lower fatigue
limit than the base metal, almost the same fatigue life between the base metal and welded joints was
observed at higher stress amplitudes. This result suggested that the slight drop in the hardness in the
outer HAZ (Fig. 2) was not large enough to reduce the fatigue strength at higher stress amplitudes.
That is, the high stress amplitude overrode the potential negative effect of the soft zone. The slight
reduction in the fatigue limit or fatigue ratio of the welded samples implied that the negative effect of
the soft zone in the outer HAZ appeared, which could not be ignored at lower stress amplitudes in the
near fatigue limit region [12]. The following Basquin-type equation was used to fit the fatigue data:
σa= σf(2N)b (4)
where σa is the alternating stress amplitude, σf is the fatigue strength coefficient defined by the stress
intercept at 2N = 1 where N is the number of cycles to failure (2N is in fact the number of load
reversals to failure) and b is the fatigue strength exponent. It is seen that the fatigue strength
coefficient was higher for the welded joints, but the absolute value of fatigue strength exponent was
slightly larger which would give rise to a slightly shorter fatigue life (since a smaller value of b
corresponded to a longer fatigue life [13]). As a result, it was similarly difficult to use the σf and b
values to distinguish the difference between the fatigue lives of the welded joints and base metal. The
type of stress cycle used in this study is in the form of a completely reversed sinusoidal as is shown in
Figure 3.
Fig3. Sinusoidal completely reversed stress cycle [10]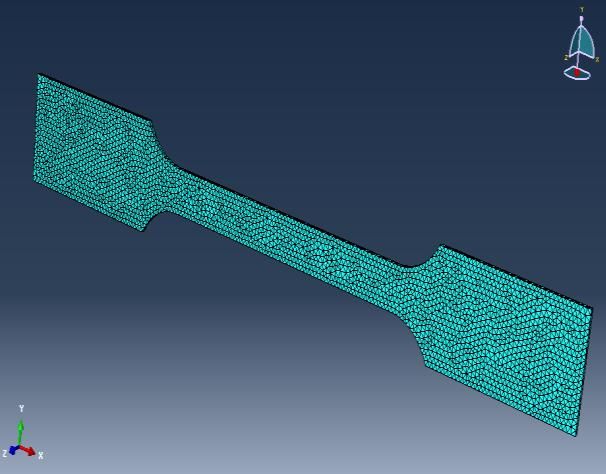
24ème Congrès Français de Mécanique Brest, 26 au 30 Août 2019
Low cycle fatigue (LCF) with high strain is concerned about fatigue failure at relatively high stress
and low numbers of cycles to failure. Usually is concerned with cyclic strain rather than cyclic stress
and fatigue data is normally present as a plot of plastic strain range Δεp against number of cycles N
(Fig. 4). On a log scale this relation can be best described by following Coffin and Manson
relationship [14]:
Δεp/2=εf (2N)c (5)
where Δεp/2 is the plastic strain amplitude, εf is a fatigue ductility coefficient, 2N is the number of
strain reversals to failure and c the fatigue ductility exponent which generally varies from -0.5 to -0.7.
Fig. 4 Typical Low Cycle Fatigue curve (Δεp vs N) [11]
3 Finite Element Simulations
3.1 Purpose
The objective of this study is to investigate by a Finite Element Analysis (FEA) the elastic-plastic
deformation on a sheet DP600 steel during a sinusoidal cyclic fatigue test with an angular frequency
of 25 rad/s and a maximum displacement amplitude of 16 mm using the Abaqus commercial software.
Selection of material properties and understanding how these ones influence the numerical results is a
major factor especially to can distinguish the influence of an isotropic hardening behavior
corresponding to the BM part, the ZAT zone and the FZ area corresponding to laser welding
assemblies. Table 2 and Figure 5 provide the classical mechanical properties corresponding to a
DP600 steel sheet specimen with 1.25 mm of thickness issue from literature and confirmed by
experimental tensile tests [5, 9]:
Tab 2. Mechanical properties for sheet DP600 steel
Tensile Strength, MPa 600-700
Yield Strength (min), MPa 330-410
Poisson’s ratio 0.3
Young’s modulus, MPa 210
Fig. 5. True Stress – True Plastic Strain curve of a reference
DP600 steel [5,9]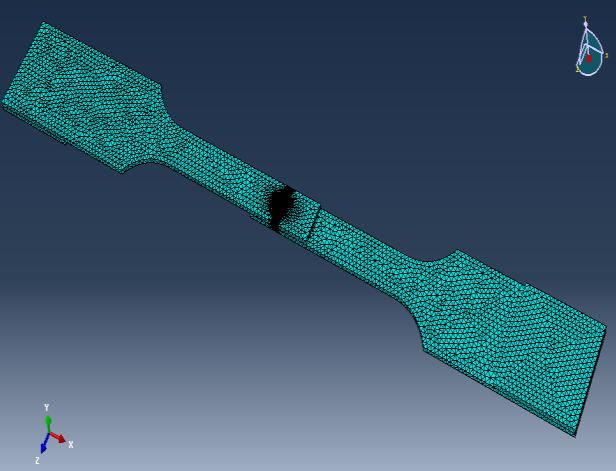
24ème Congrès Français de Mécanique Brest, 26 au 30 Août 2019
A previous scientific work [8] has detailed the experimental analysis of BM and FZ material parts
hardening behavior using uni-axial tensile tests. Furthermore regarding the experimental data of Fig. 1,
similar hardening behavior is observed for BM and ZAT area and consequently only the elasto-plastic
material behavior in terms of the true stress – true plastic strain data points for BM and FZ zones must
be known. Consequently the FEA models use three true stress – true plastic strain data curves (Fig. 6)
corresponding to a reference hardening behavior of a DP600 simple specimen (blue curve) [5,9], to the
experimental BM metal properties of analyzed DP600 steel (red curve) and to the FZ specimen area
(green curve) [5,8] according to two different studied assemblies: the laser welded specimen and the
perfect welded specimen.
Fig. 6. True Stress- Plastic Strain curves for the three metal specimens types: simple specimen (reference DP600
hardening), welded specimen (DP600 BM hardening behavior) and perfect welded specimen (DP600 FZ
hardening behavior)[5,8,9]
It is necessary to mentioned here that concerning the laser welded specimen the BM part including the
ZAT zone and the FZ area have distinct hardening behavior (red curve for the BM part and green
curve for the FZ area) while in the case of perfect welded specimen considered as an ideal laser
welding assimilate to a perfect single solid part where the both geometric parts has the same hardening
properties associated to the FZ hardening curve (green curve).
3.2 Methodology and Approach
The method for investigation of the material assembly’s behavior under cyclic loading conditions is to
model the geometric specimen’s assemblies and to put the various material parts’ behavior properties
and loading conditions. A standard direct low-cyclic fatigue model proposed by numerical
Abaqus/Standard interfaces is already used. This classical approach search to stabilize the response of
an elastic-plastic structure subjected to cyclic loading by repetitively application of the periodic
loading cycles to the unstressed sample. The non-linear mechanical equilibrium equations is solved by
a direct cyclic numerical algorithm using a quasi-Newton method and Fourier series to define the
material displacements and the residual forces vector until a stabilized cyclic response is obtained. To
define the unknown displacements u(t) this work uses a classical truncated Fourier series with an
initial values of terms n = 11 , a maximum value of 20 and an increment value of 5 by the form:
n
u( t ) u0 uis sin( it ) uic cos( it ) (6)
i 1
where u0 ,uis ,uic represent the unknown displacement variables and is the angular frequency.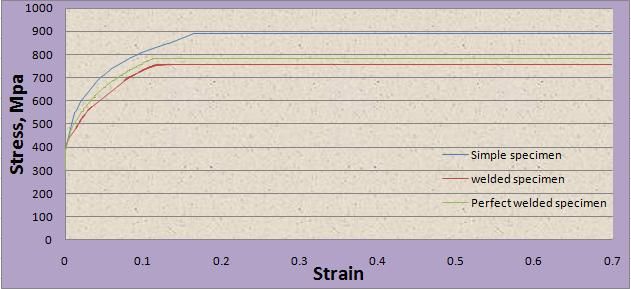
24ème Congrès Français de Mécanique Brest, 26 au 30 Août 2019
The numerical analysis is focus on influences of elastic-plastic behavior up to the yield stress point on
the tensile loads and plastic deformations variations. Geometry and mesh with a maximum size of 0.25
mm corresponding to the three studies specimens/assemblies are pictured in Figure 7. Using the
Abaqus material definition option, the true stress-plastic strains curve values are introduced using
point by point input data interface to ensure the precision of the material behavior modelling and to
obtain accurate results while elastic properties as chosen to be E = 210000 MPa and = 0.3.
a) b)
c)
Fig.7. The three different specimens configurations: a) classical specimen, b) perfect welded assembly, c) laser
welding specimens with gap overlapped [5]
3.4 Results and Discussions
Three cyclic tensile tests were simulated for the three types of DP 600 specimen’s assemblies (Fig. 7)
named simple specimen (using a reference hardening behavior of DP600 steel), perfect welded
specimen (without gap using a hardening law corresponding to the DP600 steel FZ state) and laser
welded specimen (with gap using BM and FZ parts DP600 hardening curves). A low cycle fatigue
analysis with a maximum of 104 cycles with sinusoidal form is used.
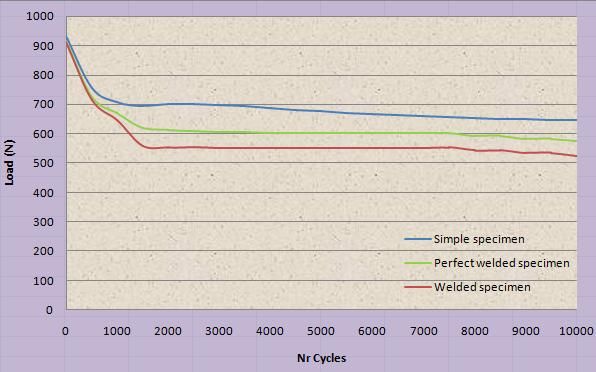
Figure 8 depicts the transition into the plastic range for DP600 from cyclic tensile tests via the Load –
Fatigue Cycles Number variations obtained from a lot of numerical simulations. Figure 9 shows that
the fatigue-life behavior of three type of specimens has a same linear variation shape (defined from
Eq. 5 by a coefficient c = - 0.5) with values for laser welded specimen lower than the perfect welded
and the simple reference specimens.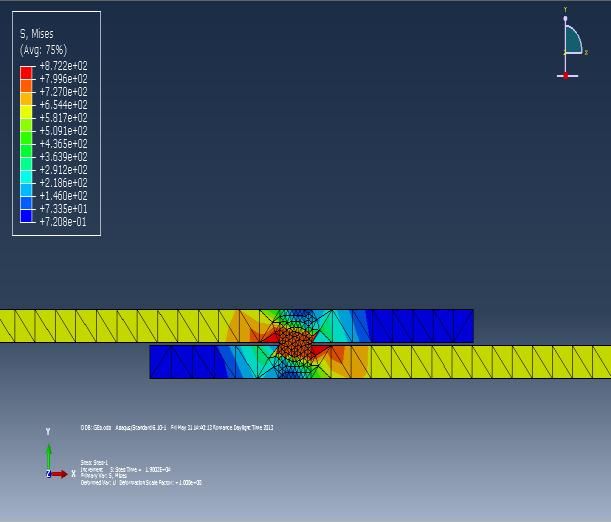
24ème Congrès Français de Mécanique Brest, 26 au 30 Août 2019
Fig. 8. Comparison of Load-Life curve of all three specimens [5]
Fig. 9. Low cycle fatigue curve for all three specimens [5]
At least in terms of the trend of shape variation, the obtained results are confirmed by the curve plotted
in Figure 4 [14] and remain to be confirmed by experiments as respects the observed gap of plastic
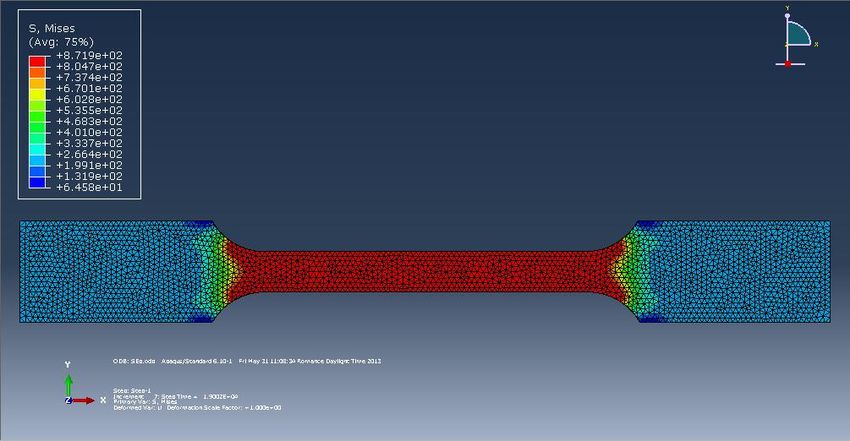
strain between the considered welded specimen cases. The figures 10, 11 and 12 show the equivalent
Von Mises Stress distributions at the end of the cyclic tensile test regarded as potential residual
stresses respectively for the simple specimen, for the perfect welded specimen (without Gap - Fig. 11
a) entire area, Fig. 11b) zoom of central area) and for the laser welded specimen (with Gap - Fig. 12a)
entire area (BM part and FZ area), Fig. 12b) zoom of fusion zone FZ).
Fig. 10 Von Mises Stress at the end of cyclic tensile test for the simple specimen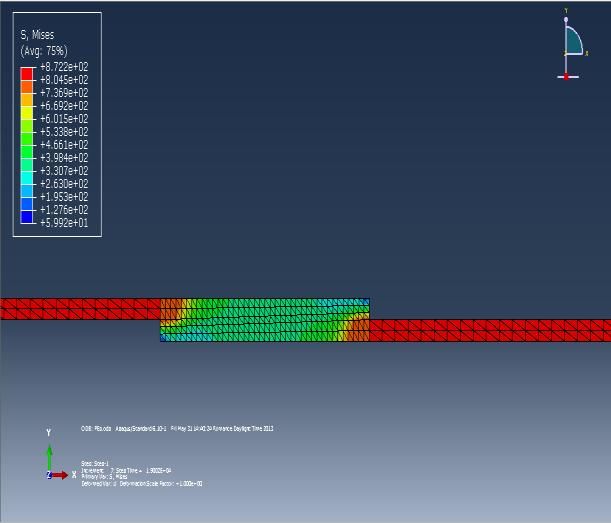
24ème Congrès Français de Mécanique                                             Brest, 26 au 30 Août 2019

                               a)                                                b)
 Fig.11 Von Mises Stress at the end of cyclic tensile test for the perfect welded specimen (without Gap and FZ
                              hardening behavior): a) entire area, b) central area

                               a)                                                b)
Fig.12 Von Mises Stress at the end of cyclic tensile test for welded specimen (with Gap using BM and FZ parts
                         hardening behavior): a) entire area, b) fusion zone (FZ) [5]

So it can be said that numerical modelling of the welded samples permits us to analyze the distribution
of stresses in the most hazardous area. Even if these numerical simulations give us natural evolutions,
for the analysis of the stress state where the weld seams be modelled perfectly, without any flaws in
order to be considered as an upper bounds case, the results keep relatively far from reality. On the
other hand, the performed numerical modelling can be judged as feasible and realistic because they
show that the most degraded case is the welded sample and confirms that the welding zone is the most
fragile zone in the case of fatigue. Experimental investigations and comparisons with previous
obtained numerical results will be considered in future works.

4       Conclusions
The obtained numerical results show that after the cycling tensile loadings, the estimation of residual
stresses on the central welded specimen area has for the laser-welding assembly lower values as
compared to the simple specimen and relatively close to the named perfect or ideal assembly case. It is
then possible to conclude on the good reliability of the of the used laser welding process. This
24ème Congrès Français de Mécanique Brest, 26 au 30 Août 2019 observed fatigue strength behavior is already validated by the scientific literature and previous experimental studies and it can be can explain by a lot of several factors. Current studies show the importance and some effects of welded structure with a heat treatment due to the used beam energy density on the fatigue life of DP600 steels. Regardless of these efforts in identifying and analyzing fatigue properties of DP600 steels, there are yet many unknowns, which require further research into this topic [15, 16]. However, laser welding has two effects on the surface of DP600 steel which has conflicting outcomes. Firstly, it smoothens surface roughness which results in the improvement of fatigue life. Secondly, it releases a residual stresses gradient: traction residual stresses in the welded FZ zone and compressive residual stresses in the HAZ area. Lower compressive residual stresses near the surface result in easier crack initiation and faster fatigue crack growth [17]. Hence, further study is necessary to distinguish the effects of these two phenomena and consider them simultaneously to have a better understanding of the fatigue behavior in laser welded DP600 steels. References [1] S.-K. Cho, Y.-S. Yang, K.-J. Son, J.-Y. Kim, Fatigue strength in laser welding of the lap joint, Finite Elements in Analysis and Design 40 (2004) 1059-1070 [2] Y.S. Yang, K.-J. Son, S.-K. Cho, S.-G Hong, S.-K. Kim, K.-H. Mo, Effect of residual stress on fatigue strength of resistance spot weldments, Sci. Technol. Weld. Joi. 6 (2001) 397-401 [3] N. Farabia, D.L. Chena, J. Lib, Y. Zhoub, S.J. Dongc, Microstructure and mechanical properties of laser welded DP600 steel joints, Master Sci Engi A 527 (2010) 1215-1222 [4] N. Farabi, D.L. Chen, Y. Zhou, Fatigue properties of laser welded dual-phase steel joints, Procedia Engineering 2 (2010) 835-843 [5] M. Costache, Study of fatigue strength of thin sheet metal for the automotive industry welded by laser power: experimental and numerical approach, Master’s Thesis Dissertation, Research Co- Supervisors: A. Kouadri-David, A. Gavrus - INSA Rennes, France, Pedagogic Tutor M. Butu - UPB, Romania, 2013 [6] M. Xia, E. Biro, Z. Tian, Y.N. Zhou, Effects of heat input and martensite on HAZ softening in laser welding of dual-phase steels, ISIJ Inter 48 (2008) 809-814 [7] C. Seang, A. Kouadri-David, E. Ragneau, Effect of Nd:YAG laser welding parameters on the hardness of lap joint: experimental and numerical approach, Lasers in Manufacturing Conference, Physics Procedia 41 (2013) 38-40 [8] C. Seang, Numérical evaluation of the residueal stress applied to the laser welded steel DP 600 high power Nd : YAG, PhD Thesis, INSA Rennes, Supervisor E. Ragneau, Co-Supervisor A. Kouadri- Henni, France, 2013 [9] D. Roylance, Stress-Strain Curves, Massachusetts Institute of Technology Ed., Cambridge, USA, 2011 [10] D. Radaj, Heat Effects of Welding, Pergamon Press, New York, USA, 1992 [11] C. Lalanne, Dommage par fatigue, Collection : Vibration et chocs mécanique, Ed. Hermes, Paris, France, 1999 [12] N. Farabia, D.L. Chena, J. Lib, Y. Zhoub, S.J. Dongc, Microstructure and mechanical properties of laser welded DP600 steel joints, Master Sci Engi A 527 (2010) 1215-1222 [13] K. Riyahimalayeri, Introduction to an impact fatigue testing method in order to assess the properties of different steel grades with various applied surface treatments, Master's Thesis, Luleå University, Sweden, 2009
24ème Congrès Français de Mécanique                                   Brest, 26 au 30 Août 2019

[14] Tapany Udomphol, Fatigue of Metals, Suranaree University of Technology Ed., India, 2007
[15] Muhammad Zain-ul-Abdein, Experimental investigation and numerical simulation of laser beam
welding induced residual stresses and distortions in AA 6056-T4 sheets for aeronautic application,
PhD Thesis, Institut National des Sciences Appliquées de Lyon, France, 2009
[16] J. Maumder, Laser Beam Welding. ASM Handbook, Welding Brazing and Soldering, 6 (1993),
262-269
[17] L.-E. Lindgren, Deformations and Stresses in Butt Welding of Plates, Ph.D. Thesis, Luleå
University, Sweden, 1985
You can also read