South East ECONOMIC MONITOR - AUGUST 2021 - SENSER
←
→
Page content transcription
If your browser does not render page correctly, please read the page content below

C A R LOW                     K I LK E N N Y             WATE R FO R D                     W E X FO R D

South East
    ECONOMIC MONITOR – AUGUST 2021

Prepared by:
JOHN CASEY,
Lecturer in Accountancy, Dept. of Accountancy & Economics, WIT
T: 353(0)87 793 6095 E: jcasey@wit.ie
DR RAY GRIFFIN,
Lecturer in Strategy, Dept. of Management & Organisation, WIT
T: 353(0)85 737 3175 E: rgriffin@wit.ie
                                                                        This project has received funding from the European Union’s
DR CORMAC O’KEEFFE,                                                      Horizon 2020 research and innovation programme under
                                                                                          grant agreement 870702.
Lecturer in Finance, Dept. of Accountancy & Economics, WIT
T: 353(0)86 395 3770 E: cokeeffe@wit.ie                                                www.senser.ie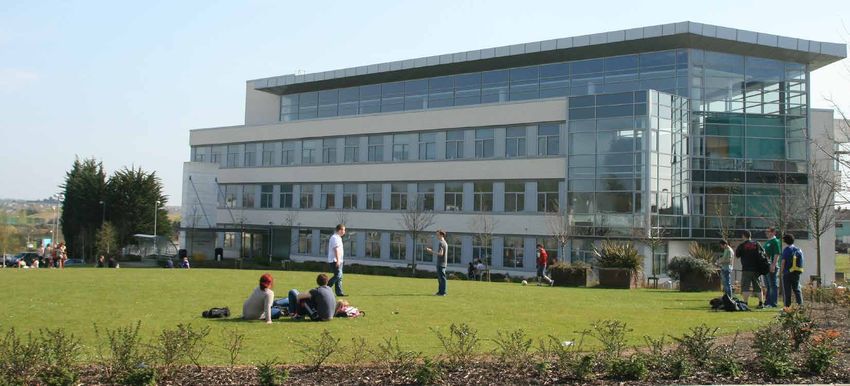
8.83%                                       South East generates
                                                     6.24% of
Est. of the national population
     live in the South East                        National GDP                           €9.8bn
                                                                                               GDP missing
      (8.89% in Census 2016)                           +6% YoY growth rate
                                                          (2020 est.)                       (below pro-rata share)
                                                   SE GDP €23.3bn (2020 est.)

                                                   179,900                                     5.2%
                                                   people in work Q1 2021                 of IDA supported jobs
                                                      ( 15,200, -7.79% YoY;

                                                                                             9,576
                                                            pre-covid)

                                                                                               missing IDA
                                                                                              supported jobs

                                                        8.9%
                                                   SE unemployment rate
                                                       (7.1% national)
                                                    (SE +2.1% YoY; pre-covid)

                                                                                                   3%
                            Carlow

                 Kilkenny

                               Wexford
                                                           8%                         of pending and ongoing
                                                      average annual                    Government capital
        Waterford                                      SE house price                 spending on significant
                                                    increase since 2014                       projects
                                                                                            (302m of €10.2bn)

                                                                                                 Share of
                    Population                       Pop Share     GDP Share     Share of       IDA client
                    2020 (est.)      GDP (est.)      of national   of national   IDA jobs      companies       Live register

      Carlow           61,432            €3.1bn        1.24%         0.85%        0.51%           0.32%            1.71%

     Kilkenny         107,075            €5.5bn        2.17%          1.5%        0.27%           0.525            1.55%

     Waterford        125,358            €6.6bn        2.54%         1.77%        2.91%           2.32%             3.4%

     Wexford          161,556            €7.9bn        3.27%         2.15%        1.29%           1.36%            4.29%

     SE Region        439,600            €23.3bn       8.83%         6.24%       4.98%            4.52%           10.94%

02                                                                                        S.E. Economic Monitor – August 2021
SUMMARY
The South East (SE) economy, like the Irish economy, was growing at tiger rates before the pandemic, and has
proved resilient during the tumult of the past year and a half. Most sentiment indicators are strongly positive.
The structural weaknesses of the SE economy, best evidenced in the significant GDP gap, continues to go
unaddressed despite clear evidence-based policies being available to close the gap. So whilst the region has
the greatest headroom for growth of any Irish region, based on current national policy priorities we do not
envisage the region closing the significant gap in the near term. The gap between rhetoric and measures on
regional development is best illustrated by the absence of any significant exchequer-funded capital projects being
implemented in the South East region- a region of 8.89% of the population.
The long-term impacts of the lockdowns, experienced variously in different sectors are unknown, but the expectation
is for a speedy restoration of the pre-covid frothiness. The short-term impacts are considerable, particularly to certain
sectors of the labour market, and the SE labour market, weak entering the pandemic, has experienced a more
pronounced downturn.

ABOUT
This is our fifth edition of the SEEM, the tumultuous economic fortunes of 2020 making it impossible to prepare
a reliable evaluation on the South East Economy.
It is prepared by independent, non-politically affiliated academics who are part of the South East Network Social and
Economic Research (www.senser.ie), an initiative at Waterford Institute of Technology School of Business. All opinions
expressed are those of the authors and do not represent those of WIT. SENSER is committed to publishing research
that reaches the appropriate academic standards, and all of our work is fully open to public scrutiny. Please bring any
errors and omissions to the attention of the authors.

  S.E. Economic Monitor – August 2021                                                                                   03

LABOUR MARKET

 Resilient, but structurally weak, labour
 market in the face of the pandemic                                                   Employment by Industry (‘000)

 Employment in the SE continued to be impacted by the
 pandemic. There was a year-on-year decrease of 15,200,
 from 195,100 to 179,900 to Q1 2021.
 There was a year-on-year decrease of 15,200, from 195,100 to
 179,900 to Q1 2021.
 This represents a 7.8% decrease against a national decrease
 of 5%.
 As expected, the largest absolute job losses occurred in the
 Services sector, where there was a year-on-year decrease of
 13,500. More than half of this was in the Accommodation and
 Food Services sector, where employment fell by 47% Y-o-Y.
 Construction also suffered significantly (-21%), as did financial,
 insurance and real estate activities (-22%), wholesale and
 retail trade, repair of motor vehicles and motorcycles (-20%)
 and transportation and storage (-18%).
 In contrast, employment in the Industry sector increased by 8.5% and encouragingly there was an 11% increase in employment in
 the Professional, scientific and technical activities sector.
 Before the first lockdown, the SE labour market was in a historically strong position, albeit structurally weaker and unpressurised
 relative to the State. The impact of the pandemic is largely consistent with the national picture, however in most cases job losses
 were more pronounced in the SE.
 Source: CSO LFS (Q1: 2021)

 Unemployment Rate Increases                                                                Unemployment Rate

 The unemployment rate is substantially higher both
 regionally and nationally over the past year as the
 impact of Covid-19 continues to be seen.
 The impact has been more significant nationally than
 is the case for the SE. The Live Register figures back
 up the relatively weak labour market in the SE, as
 the region accounts for 10.94% of people on the live
 register.
 Source: CSO

                                                                            Unemployment
                                                                                Rate                  State           SE Region

                                                                                Q1 2021                7.1%              8.9%

                                                                               Q1 2020                 4.7%              6.8%

 SE Incomes Continue to be                                                          All Income Taxes (Self, PAYE, USC)
 Decoupled from Irish Economy
 Individuals in the SE pay 51.2% of the national
 average of all income taxes.
 This highlights the combined effect of low average
 wages and higher rates of unemployment. The
 region lacks quality PAYE jobs (48.5% of the average
 PAYE+USC), with income taxes from self-employed
 individuals at 71.9% of the State average.
 Source: Revenue Commissioners

04                                                                                               S.E. Economic Monitor – August 2021
LABOUR MARKET contd.
Government’s jobs targets                                                                   Unemployment Rate v APJ Target (%)

The Government has a target of bringing all regional unemployment rates to
within one percentage point of the state, a commitment made in 2015’s action
plan for jobs policy initiative and repeated in the Ireland 2040 policy initiative.
The gap was below one percentage point for three quarters in 2020 for the
first time since 2017. However, during the pandemic crisis, much of this relative
improvement is due to the faster decline of the labour market in other regions
rather than employment growth in the SE.
Source: CSO: LFS | APJ | Ireland2040

SE with largest proportion of workers on                                                       Proportion (%) of Employees on
Minimum Wage                                                                                       Minimum Wage or less

The SE has the highest proportion of minimum wage workers, with 12.7% of
workers in the region earning the minimum wage or less, against 8.1% as the
national average.
This figure has increased at a greater rate in the SE than nationally over the
past year.
Source: CSO LFS (Q3: 2020)

Lower labour market participation rate                                                       Labour Market Participation Rate (%)

Irish labour market participation rates are considerably lower than historical
heights in 2007 (67.4%), and lower than the European policy aspiration to have
78% of people aged 20-64 into employment.
The SE has a consistently lower participation rate, around 4.2 percentage
points lower than the state (currently 55.8% v 60%), suggesting a further
14,800 individuals who are not unemployed, but who do not participate in paid
employment than the national average.
Source: LFS (Q1: 2021)

Pandemic Related Government Support Schemes
In addition to the traditional unemployment payments, the government introduced
three pandemic-related payments or subsidies at various points throughout the                     Total Number of Claimants
crisis: the Pandemic Unemployment Payment (PUP), Temporary Wage Subsidy
Scheme (TWSS), and the Employment Wage Subsidy Scheme (EWSS).
In May 2020, almost 1.2 million people in the State were supported by either the
Live Register or by one of the three COVID19 schemes. The equivalent figure in
the SE was almost 104,000, the equivalent of approximately half the labour force of
the region.
When the PUP was first introduced, the SE accounted for approximately its fair
share of PUP recipients (8.6%) but subsequently the number of claimants rose at a
slightly faster rate in the SE than nationally. However, that share has fallen to 7.2%,
suggesting that the SE is emerging from the Covid restrictions at a faster rate than
the rest of the State.
However, the SE accounted for a disproportionate number of people on the live register or supported by one of the above three
schemes at the start of the crisis. This is largely driven by the statistic reported earlier showing that the SE accounts for ~11% of
people on the live register. However, the number of total claimants on all schemes has fallen close to a fair share as of July 2021.
In conclusion, the pandemic has not had a disproportionately negative impact on the SE. However, the labour market weakness
that were apparent pre-crisis remain.

Labour Market Commentary
The SE labour market continues to be relatively unpressurised compared to the national market- with higher unemployment,
lower participation and lower incomes- suggesting significant headroom for growth.
While the economic crisis emanating from the pandemic has not had a disproportionate effect on the region, the legacy issues of the SE
labour market re-emerge , and with national concerns dominating again, there is little policy attention on the causes of this weakness.

  S.E. Economic Monitor – August 2021                                                                                                   05
INDUSTRIAL, ENTERPRISE AND INNOVATION
 IDA strategy fails the South-East
 The IDA had another strong year nationally in 2018/19, with supported                    The map below shows the IDA-supported
 employment growing by 6%.                                                                jobs per 1,000 people in each county for
 Lacklustre growth in the SE of just 1.6% results in a further relative widening          the year 2019:
 of the gap between the region and the State. With 8.89% (CSO,2016) of the
 population living in the SE, just 5% of IDA jobs, and a mere 4.5% of IDA-
 supported companies are in the region.
 This deficit has more than doubled over the past decade. Using IDA average
 income data (~€66,000) this suggests the region misses out on direct payroll
 of almost €632m per year.
 Source: PQ, 2019 data; IDA Annual Report (2020)

                                 IDA Supported Jobs

 IDA visits increase but still fall short                                                               IDA Visits
 While most additional IDA jobs come from organic growth in existing IDA
 supported enterprises, with a lower stock of existing enterprises, it is a
 strategic imperative that the SE wins new IDA clients.
 The number of IDA visits is consistently below the national average — with 8.83%
 of the population 2018 share of visits was 5.9%, 2019 share was 6.6%. Were
 the region to have a fair share based on population (8.89%) a further 16 site
 visits would have been made in 2019, and 195 more over the period 2003-19,
 potentially leading to additional investments.
 The last IDA strategy ‘Winning: FDI 2015-2019’ committed to ‘balanced regional
 growth’. Over the life of the strategy, the number of SE IDA jobs rose by 27.6%,
 against 30% nationally, as a result the number of missing IDA jobs rose by 35%,
 indicating that the strategy did not effectively address balanced regional growth
 in the SE.
 That the outrun in the SE it is important to reflect that over this period of time the
 IDA failed to deliver for the region.

 Source: IDA Ireland | PQ.470 March 5th 2020.

 Enterprise Ireland keeping pace                                                               Enterprise Ireland Spending

 Enterprise Ireland (EI) is the state agency charged with supporting higher value
 start-up business activity.
 In recent years, the SE has attracted more than a fair share of EI investment. In
 the context of the pandemic, employment in EI-supported enterprises decreased
 by 3% YoY, but the number of client companies increased 3% YoY suggesting
 sustained effort by the agency.
 Source: EI | PQ

06                                                                                             S.E. Economic Monitor – August 2021
TRACKING EXCHEQUER-LED
CAPITAL INVESTMENT
The Department of Public Expenditure maintains a database of significant capital projects (>€20m). The tracker does not claim to
be exhaustive and was last updated in December 2020.
The database lists 146 projects from development to final review. Here we analyse the data using two different methods.
This table presents the 96 projects that are pending commencement or are underway, representing €10.2bn of expenditure,
using reported expenditure or mid-range valuations from the PER database.
Four projects from the SE are included on the table representing €302m of exchequer expenditure or 3% for a region of 8.83% of
the population.
Source: PER, 2021

                         Value of            Value of
   Significant           pending             projects        Value of          % of                             Investment
    projects           projects €m         underway €m     projects €m      investment         % of pop          per capita

      Dublin               2,368                 3346.6         5,714.6         56%              28.3%              198%

       West                 909                    401           1,310         12.8%              9.9%              129%

  South West                634                  809.2         1,443.2         14.1%             14.5%              98%

    Mid West                422                    20            442           4.3%               6.1%               71%

     Border                  160                  343.4         503.4          4.9%               8.3%              60%

   South East                 41                   261           302            3%                8.9%              33%

    Mid East                 251                  209            460           4.5%              14.5%               31%

    Midlands                 27                                   27           0.3%               9.5%               3%

      TOTAL                4,812                 5,390.2       10,202.2        100%              100%               100%

                                                                          Captial Projects due to complete from 2021+
Balanced Regional Development                                                           Regional Spread
at odds with focused investment in
Dublin
Here we present the regional distribution of all significant
capital projects that are scheduled for completion from 2021
forward. We use mid-range valuations.
Dublin is about to receive an allocation that is €3.5bn more
than its population would merit. This is to the detriment of
many of the regions, including the South East.
There are significantly more Dublin based projects and
those projects are significantly more expensive to deliver-
reflecting both the scale of projects and higher development
costs.
Source: Analysis of Capital Tracker, PER, 2020

  S.E. Economic Monitor – August 2021                                                                                          07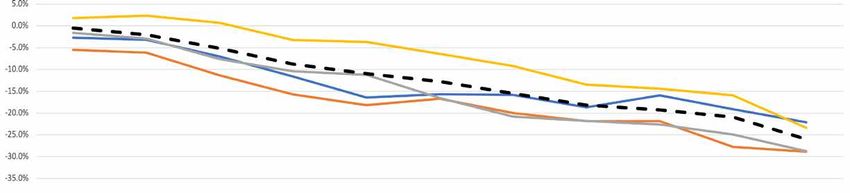
DEMOGRAPHICS – WHERE ARE ALL
THE BABIES GONE?
In 2009 there were 76,000 babies born in Ireland, by 2020 this had declined to 56,000 babies, a decline of 26%.
The SE experienced a 29% decline, considerably less than Dublin’s 23% decline. Were the SE to have Dublin’s rate of decline
there would be an additional 5,800 babies born in the last decade.
Some of this decline is due to fewer females in the 20 to 44 age cohort which has declined nationally by just 2.1% since 2011, yet
increased by 3.3% in Dublin.
Whilst births are declining, we are also getting older. This is a national phenomenon with the Dublin region being an outlier due
to its younger working-age population. The average age of the population in the SE has increased from an estimated 36.5 years
in 2011 to 39 in 2020. The overall impact is that the age dependency ratio has increased. This has an impact on the allocation of
resources across the economy, there are less people of working age to those who are either too young or too old to work.
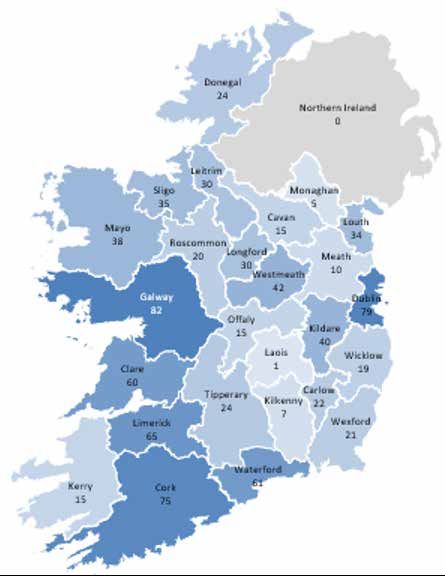
The demographic shift taking place in the region and nationally is even more nuanced. The total fertility rate (think of this as
a measure of the average number of children a female aged 20 to 44 has) is declining. However, the TFR rate of Dublin has
decoupled from the other regions. The national TFR in 2020 rate is 1.6 children but in Dublin this is 1.39.
So although Dublin has more females in the 20 to 44 age cohort, they have significantly fewer babies than in the regions.
The relative attractiveness of Dublin as a destination for migration from inside and outside the country has been part of the
explanation along with changing social and economic trends.
Source: CSO Population Estimates April 2020, authors calculations
% Cumulative Change in Annual Births - 2009 as Base Year
2010 2011 2012 2013 2014 2015 2016 2017 2018 2019 2020
Age Dependency Ratio by Region
2011 2012 2013 2014 2015 2016 2017 2018 2019 2020
Prevailing Age Cohort Regional Total Fertility Rate
2011 2012 2013 2014 2015 2016 2017 2018 2019 2020
08 S.E. Economic Monitor – August 2021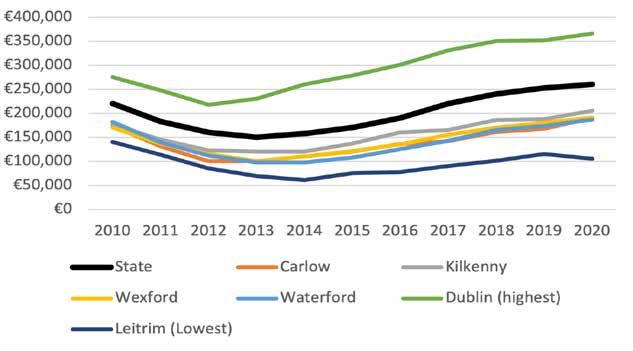
HIGHER EDUCATION
                                                                               Where do students of the SE go (n=14,200)?

Higher education brain drain continues
In the academic year 2018/19 there were ~14,200 students from
the SE in higher education (note: all figures exclude TCD).
This represents 6.7% of the total number of students in higher
education which is less than the general population of the South
East (8.9% of the national population).
Of these students, 39% 5,522 remained in the South East for their
higher education but 61% (8,686) went outside the region. This
represents a significant loss to the local economy and a cost on
families, and has long term implications for regional demographics.
For comparison, 75% of students from the South West stay in the
region for their higher education.
Source: HEA

Underinvestment in regional
Higher Education
The under-provision of higher education capacity is very evident
at the capital investment level.                                               Investment in Higher Education Universities
                                                                              versus South East Institutions (WIT + IT Carlow)
Almost €780m has been spent and is projected to be spent in the
traditional university sector. The equivalent figure for WIT is €9m
and €17m for IT Carlow.
Even controlling for the relative size of the institutions, there is 3.5
times more capital spending in higher education in the universities
relative to the SE institutions.
The main explanation for this difference is the funding system that
is in place for the traditional universities which is at a much higher
level than the Institute of Technology/Technological University
sector. There is no evidence that the conversion to a Technological
University will change this.
There is currently €886m of borrowings in the 7 traditional
universities with a further €254m of investment authorised. That
will leave in excess of €1bn of borrowing in the sector. Institutes of
Technology are not permitted to borrow.
Source: Financial data from most recent audited financial statements (fixed
asset additions, capital commitments & borrowings). Student numbers
from HEA. Revenue excludes deferred pension funding and amortisation of
deferred capital grants.

  S.E. Economic Monitor – August 2021                                                                                            09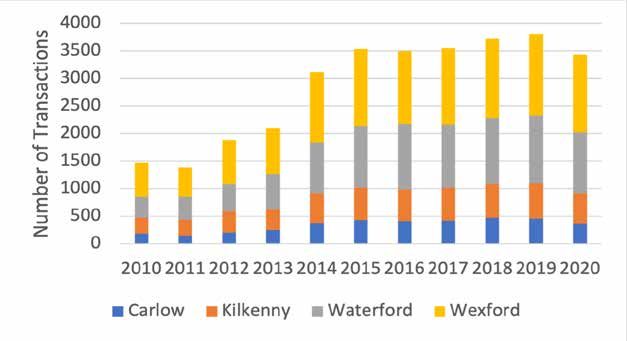
HOUSING
 Housing Market
 Based on actual market transactions, there has been a strong recovery in median house prices across the South East.
 Indeed, the South East housing market is very similar on a county by county basis with the trend and median price following an
 overlapping trajectory. All counties are below the national median price but this is skewed by the Dublin effect.
 Since the national low point in 2013, median house prices in the South East have increased at a rate in excess of the national rate
 – 85% of an increase over 7 years (9% annual equivalent) in the South East versus 73% nationally (8% annual equivalent).
 These house price increases have taken place at a time when the volume of transactions has also been increasing. There was
 a slight decrease in the number of houses transacted in 2020 due to Covid impacts. However, the general trend is strongly
 upwards: there were 2.5 times as many houses sold in 2020 versus 2011 (the previous low). The South East is reflective of the
 national trend in this regard.
 Source: CSO.ie (based on stamp duty returns to the Revenue)

                         Median House Price
             (market transactions, stamp duty executions)

                        Number of House Sales
             (market transactions, stamp duty executions)

 Housing Affordability Measure                                                  Housing Affordability: Median House Price vs.a
                                                                                   Median Household Disposable Income
 Housing affordability has declined since the bottom of the decline
 following the financial collapse.
 Housing affordability is median house price divided by median
 household disposable income. The higher the figure the less
 affordable the median house is relative to median income.
 Housing in the South East is relatively more affordable than Dublin
 and nationally. The South East ranks 4th out of 8 in terms of this
 measure of housing affordability. House prices are currently 4.9
 times household disposable income, this is an increase from the
 low point of 3.5 times in 2013.
 Source: CSO: House prices based on stamp duty returns and income from
 the Survey on Income and Living Conditions (SILC)

10                                                                                              S.E. Economic Monitor – August 2021
SOCIAL AND SENTIMENT
Regional Healthcare Equality
Given the current interest in regional health equality, we explored the (difficult to access) acute hospital resources.
Here we compare the eight regional ‘Model 4’ hospitals which offer acute care, using HSE data. On a per citizen basis the SE
regional service costs 28%, has 23% of the staff and 72% of the beds than the most resourced provider. This suggests that the
SE’s model 4 hospital is remarkably efficient or has poorer medical outcomes.
Dublin Model 4 Regional Model 4
Beaumont Mater James Tallaght Vincents CUH GUH UHL UHW
In-patient
672 617 713 425 521 628 693 432 405
beds
Baseline
290,000 185,000 330,000 650,000 300,000 550,000 709,880 400,000 500,000
Population
Budget 2019
327 250 229 382 296 295 354 266 194
(€, m)
Staff WTE
3,876 3,182 4,080 2,691 2,875 4,055 3,631 2,820 1,955
12/19
Spend per
1,127.80 1,351.84 694.38 588.08 985.10 536.25 497.97 665.37 387.84
Citizen (€)
Citizen per
75 58 81 242 104 136 196 142 256
Staff
Citizen per
432 300 463 1529 576 876 1024 926 1235
Bed
Source: various HSE hospital group plans assembled by WIT researchers senser.ie | Jan 2020
Consumption VAT (€m)
Sales tax, VAT is a useful proxy for consumption.
In 2019 SE VAT returns increased 11.7% (+12.9% nationally) from
a low base. With 8.86% of the population of Ireland living in the
SE, the region returns just 3.4% of the VAT, which is 38.5% of the
National Average.
While a certain amount of this arises from retail leakage to other
regions, it does suggest relatively weaker consumer spending and
sentiment in the region arising from the weaker labour market.
Source: Revenue Commissioners
S.E. Economic Monitor – August 2021 11Contact Us: cokeeffe@wit.ie | jcasey@wit.ie | rgriffin@wit.ie
You can also read