TRENDS AND FACTORS BEHIND INCREASED NEEDS IN THE RBC REGION 2020 - April 2021
←
→
Page content transcription
If your browser does not render page correctly, please read the page content below
| Food Security Analysis

             TRENDS AND FACTORS
             BEHIND INCREASED NEEDS
             IN THE RBC REGION 2020

April 2021
OBJECTIVE

• Provide an overview of the needs in RBC countries in
  2020 and highlighting the key drivers of these needs.
• This report also depicts how WFP and governments
  responded to needs in the first year of the COVID-19
  era.
• The RBC VAM team would like to thank the various RAM,
  Monitoring and Programmes teams at the Country
  Office level for their support and input into this analysis.
  In addition we would also like to acknowledge and thank
  the various Programmes teams at the Regional Bureau
  for their support.

Note: The analysis is based on primary data analysis from WFP assessments,
as well as secondary desk review from various sources.
KEY MESSAGES

• Protracted conflict and displacement are still the main
  drivers of food crises in 2020 in the MENA region;
  dramatically reversing hard won development gains.
  Consequently, against a global trend of improving
  nutrition, MENA is the only region where malnutrition has
  been on the rise over the last decade.
• The majority of the food insecure people in the Middle
  east are in countries where conflict was identified as the
  primary driver.
• The surge of displaced people has placed extraordinary
  demands on national economies and systems, including
  refugee receiving countries.
• COVID-19 fallout added to the precarious socio-economic
  situation as travel bans, restrictions on movement and
  fall in global demand for oil has resulted in an average
  decline in GDP of 10% in 2020 (across MENA).
• Climate change presents risks to the whole food system,
  from production, to distribution and consumption.
  Countries in the RBC region are highly vulnerable to
  climate change both directly and indirectly – by
  exacerbating existing vulnerabilities and acting as a risk
  multiplier to other risk drivers that influence food security.

KEY MESSAGES

• As domestic production cannot meet internal
  demand for food, countries of the RBC region
  are heavily dependent on food imports. This
  combined with depreciation of local
  currencies has resulted into an overall
  average increase in the cost of the food
  basket by 41 percent at the end of 2020, with
  peaks in Syria (236 percent), Lebanon (130
  percent) and Yemen (30 percent).
• Socio-economic factors such as conflict are
  likely to affect 2021 crop production in Libya,
  Syria and Yemen.
• Currency depreciation – which is making
  imported inputs more costly – is likely to
  reduce farmers’ access to them, which, in
  turn, might affect production.
• Fuel crisis is likely to have a significant impact
  in Syria and Yemen in the first half of 2021.
NEEDS IN RBC COUNTRIES 20201

                                                                                 ARMENIA
                                                                                 (0.6m)
                                                      TURKEY
                                                      (2.3m)
                                TUNISIA
                                (1.6m)
                                                              SYRIA
                                                   LEBANON    (12.4m)
                                                     (2.2m)             IRAQ
                                                PALESTINE                                  IRAN
                                                (2m)                    (2.4m)

                                                              JORDAN
                     ALGERIA                                  (1.4m)
                     (0.2m)          LIBYA
                                     (0.6m)   EGYPT

                                                                            YEMEN
                                                                            (16.1m)
People in Need of Food - 2020
   < 1m
   1m - < 2m
   2m - < 3m
   ≥ 3m
WFP BENEFICIARIES IN RBC COUNTRIES 20202

                                                                               ARMENIA
                                                                               (0.1m)
                                                      TURKEY
                                                      (1.8m)
                               TUNISIA
                               (0.003m)
                                                             SYRIA
                                                  LEBANON    (5.6m)
                                                    (1.4m)            IRAQ               IRAN
                                                PALESTINE
                                                 (0.4m)               (0.9m)

                                                             JORDAN
                     ALGERIA                                 (1.1m)
                     (0.2m)          LIBYA
                                     (0.3m)   EGYPT

                                                                          YEMEN
                                                                          (15.4m)
WFP Beneficiaries - 2020
   < 0.5m
   0.5m - < 2m
   2m - < 6m
   ≥ 6m
DRIVERS OF NEEDS

                                                                                                                ARMENIA

                                                                           TURKEY

                                          TUNISIA
                                                             LEBANON                  SYRIA

                                                                PALESTINE                         IRAQ                             IRAN

                                                                                      JORDAN
                           ALGERIA
                                                  LIBYA
                                                            EGYPT

                                                                                                          YEMEN

High increase in prices1             Displacement2

Health related shock3                Natural disasters4
                                                          1. This includes depreciation of local currencies, or high increase in inflation or in food basket cost.
                                                          2. This includes high displaced or refugee populations.
High unemployment                    Conflict             3. This includes COVID19- or cholera.
                                                          4. This includes floods, drought, fire, cyclone, or rainfall deficit.
Decline in economic productivity5                         5. This includes decline in oil or tourism revenue or GDP.
FRAGILE ECONOMIES - OVERVIEW

Poorly diversified economies, heavility
                                                      Decline in tourism arrivals                Depreciation of local currencies
  depedent on hydrocarbon sector

                                                                       Decline in revenues
                         Decline in global        Decline in
Decline in oil                                                          in retail sector for        Hyperinflation and increased
                       demand and fall of oil   revenues from
 production                                                              tourism-related              cost of the food basket
                              prices               tourism
                                                                             activities

      Loss of government revenues

         Higher unemployment,
                                                                                               Erosion of households’ purchasing power
       reduced wages and earnings

                                                                                                  More difficult to meet basic needs
    Reduction in households’ income
                                                                                                  through markets, including food
FRAGILE ECONOMIES – REGIONAL AND COUNTRY- LEVEL IMPLICATIONS3
• Algeria, Iran, Iraq and Libya are heavily dependent on
hydrocarbon sector.
• In 2020, revenues from oil sector in those countries went down
48% compared with 2019 (from USD B 211 to 110). Decline in revenues and output
• Libya recorded the highest decrease in revenues (-79%) • 10% decline in GDP at regional level,
followed by Iran (-45%) and Algeria and Iraq (-43%) with the most significant decrease in
Libya (-40.9%), Lebanon (-19.2%), and
Decline in revenues • Decline in revenues was due to the compound effect of
Iraq (-9.5%).
» OPEC agreement in early 2020, which resulted in an agreed Reduction in
from hydrocarbon households’ income
decline in oil production
sector » Fall in the oil global demand following COVID-19 led to a
decrease in prices
Reduced wages and increase in job losses
• Unemployment rate in the region at
14% (against 5% global unemployment
rate). Highest rates were recorded in
Palestine and Armenia (25.9 and 20%
respectively). In Palestine, there are
• Egypt, Jordan, Lebanon, Turkey, and Tunisia heavily depend on notable discrepancies between Gaza
tourism. – 46.6% - and West Bank – 15.7%).
• In 2020, revenues from tourism sector went down 64.5%
compared with 2019. Increased economic
• Jordan recorded the highest decrease (-72%) followed by vulnerability and
Decline in Lebanon (-68%), Turkey (-65%), Tunisia (-63%) and Egypt (-55%) risk of inability to
• Restriction on movements and travel bans both in tourist meet essential needs
tourist arrivals generating countries and receiving countries caused the loss. through markets,
Hyperinflation1
including food
• Average headline inflation for the
region in 2020 is 23%, with the
highest rates observed in Lebanon
(145%) and Iran (45%).
• 8 in 12 countries in the region recorded depreciation of their
Increased cost of the food basket
currencies in 2020. As of December 2020, countries with the
most significant decline of local currencies with respect to USD • As of December 2020, the cost of
were Lebanon (-75%), Syria (-69%), Iran (-50%), Libya (-30%) and the food basket in the RBC region Reduction in
Depreciation of Yemen (-17%). increased by 41% compared with
households’
December 2019. The highest
local currencies increases were observed in Syria
purchasing power
(236%), Lebanon (130%) and Yemen
(30%).POPULATION MOVEMENTS AND DISPLACEMENT4
Refugees IDPs
Country
2019 2020 2019 2020
Population movements have
Algeria 98,599 97,384 0 0 increased in 2020, when compared to
2019.
Armenia 17,980 107,977 0 0
Egypt 258,391 269,300 0 0 Refugees
Iran 979,435 979,435 0 0
Countries with the highest number of
refugees chronically are State of
Iraq 273,986 273,575 1,414,632 1,381,332 Palestine, Iran, and Lebanon.
Jordan 693,668 697,231 0 0 An increase in the number of
refugees was witnessed in 2020 in
Libya 4,730 5,164 355,672 401,836 Armenia (refugee-like population
from Nagorno-Karabakh) State of
Lebanon 916,141 889,694 0 0
Palestine and Egypt (from
Morocco 6,642 7,387 0 0 South Sudan and Eritrea).
State of Palestine 2,090,207 2,142,484
IDPs
Syrian Arab Rep. 16,213 15,318 6,146,994 6,734,787
Countries with the highest
Tunisia 1,732 2,172 0 0
number of IDPs chronically are
Syria, Yemen, and Iraq
Yemen 268,503 272,104 3,625,716 3,717,618
An increase in the number of IDPs was
Total RBC 5,626,227 5,759,225 11,543,014 12,235,573 witnessed in 2020 in Syria, Yemen,
and Libya
2019 vs 2020 132,998 692,559LOCAL AGRICULTURAL PRODUCTION
Production Imports Demand
In 2020, Heavy dependence on The compound effect of
An overall aggregate imports (local production is low domestic production,
increase in production in not enough to meet the heavy dependence
the region: 105 million tons domestic demand). on cereal imports and
(up 4 than 2019 level Countries in the region with decreased household
and up 9 percent above the highest cereal import purchasing power is likely
the five-year average), dependency ratio (higher to significantly affect
which was mainly driven by than 90%) are Lebanon, households’ capability to
increase in production in Jordan, and Yemen. meet food needs across the
Turkey, Iraq and Syria. Cereal import requirement region, mainly in Lebanon,
Only Armenia and Tunisia for 2020/2021 is estimated Syria and Yemen.
recorded a decline in at 68 million tons
production (25- and 38- (unchanged compared with
percent the last five years).
than 2019, respectively).
Currency depreciation:
Prospects for 2021 Households’ access to
Dry conditions have been imported cereals/cereal
observed in Algeria and products might be affected
Tunisia during 2020, and as depreciation of the local
are persistent across currency results in higher
Syria, Iraq, and north- prices for imported goods.
Eastern Iran. Persistence This is likely to happen in
of dry conditions threatens Iraq, Lebanon, Libya, Syria,
crop development, and and Yemen.
eventually production.SPREAD OF THE PANDEMIC • The pandemic continues to spread dramatically in the region, with a total of over 7.5 million confirmed cases, and over 150 thousand deaths in the region as of March 8th, 20215. • In the region, barriers for preventative behaviors against the pandemic include structural barriers, such as unavailability of clean water, soap, alcohol hand gels, and sinks6, lack of awareness7, and aversion to secondary effects such as dry skin and allergies8. • On the other hand, enablers for preventative behaviors in the region include fear of contagion9, religious context on cleanliness10, and social pressure11. • People have become more aware of how the virus is spread and having received protective equipment, are now less worried about getting infected, but instead they started to feel anxious about their livelihoods12.
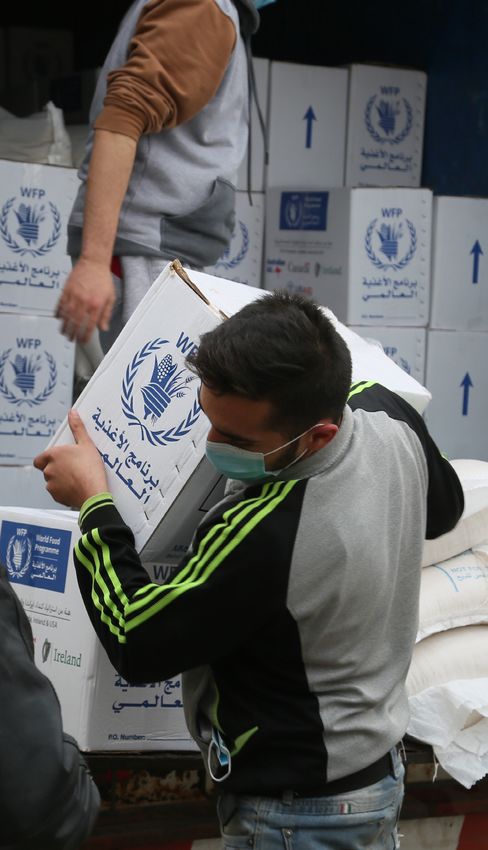
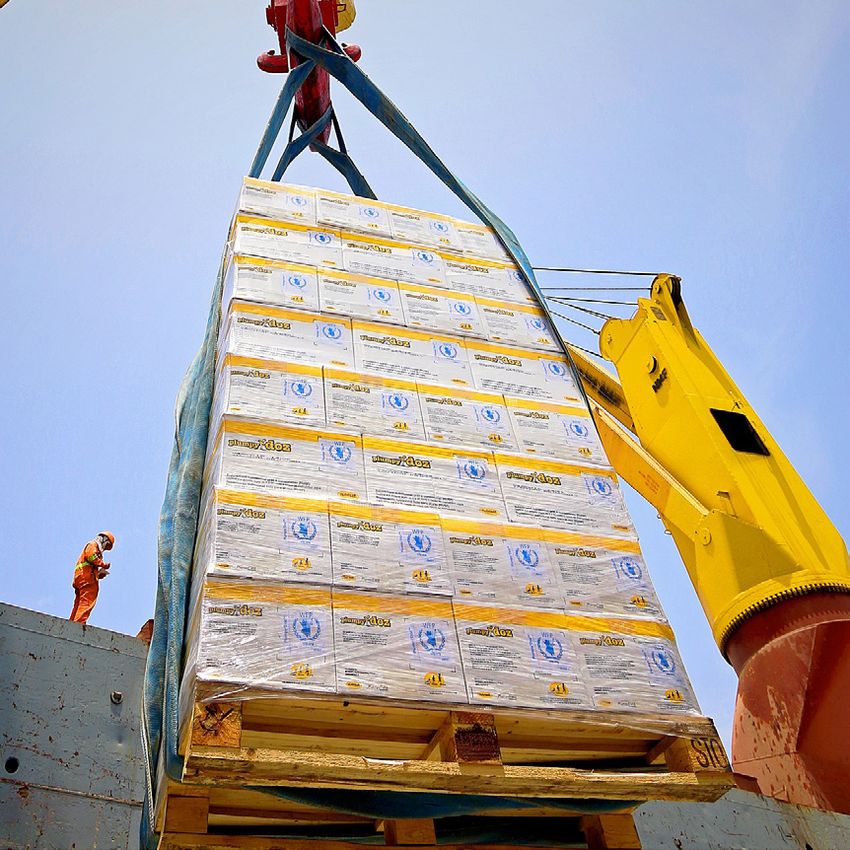
WFP RESPONSE IN 2020 COMPARED TO 201913

                      Unconditional resource transfer scaled up in Algeria, Egypt, Iran,
                      Lebanon, Libya, Palestine, and Yemen.

                      In countries where school meals programmes are implemented, WFP either
                      scaled up or maintained the same level of assistance, except for Egypt.

                      Asset creation and livelihood programmes expanded in Iraq, Libya, and Yemen,
                      and contracted in Egypt, Jordan, Lebanon, and Syria.

                      Nutrition treatment programmes expanded in Yemen and Syria and was introduced in Egypt
                      in 2020. Algeria maintained the same level of assistance.
                      Nutrition prevention programmes scaled up in Syria and Algeria in 2020.

The pandemic response has reshaped the way technology has been used to enable targeting for and the operation of social
protection services during the crisis including through, virtual registration of applicants for social assistance through
online platforms, such as in Armenia, Egypt and Iraq; remote verification of beneficiary households through the National Aid
Fund and transition from in-kind transfers to e-vouchers in Jordan; communication with beneficiaries through virtual tools,
such as in Morocco; provision of payments through e-wallets and bank transfers as in Tunisia, Palestine, and Jordan14.
GOVERNMENT RESPONSE15 • Some countries in the region invested in strengthening national systems and were better able to manage the response to and fall-out from the pandemic. • Iran and Lebanon took measures to ensure financial protection in accessing health care for all through ensuring free treatment, capping testing costs, and renewing health insurance. • Algeria, Jordan, Iraq, Egypt, Turkey, and Iran took emergency measures to ensure income security during inactivity due to the pandemic such as providing paid leave for employees in public and private sector; granting special leave, and paying part of the sick leave through social insurance organizations. • Morocco, Jordan, Tunisia, Lebanon, Armenia, Turkey, and Iran took measures towards unemployment protection, such as supporting payment of salaries through unemployment funds, providing loans to companies to pay salaries and facilitating access to unemployment benefits. • Jordan, Lebanon, Morocco, Tunisia, Algeria, Turkey, and Egypt adjusted social security benefits by reducing contribution rate for employees, exempting companies from fines due to delayed payments, and increasing pension. • To maintain price stability of basic food commodities, Algeria16, Egypt17, Syria18, Iraq19, Jordan20, Turkey21 continued to subsidize basic food commodities as well as the agriculture sector even though fiscal balances are facing several economic challenges.
CONCLUSIONS/RECOMMENDATIONS

• Key drivers to needs in the region are protracted conflict and economic
  shocks made worse by a challenging environmental context of extreme
  aridity and water scarcity, which is further compounded by the impact of
  climate change. The pandemic has exacerbated an already grave economic
  status in the region, increasing fragility of economies, jeopardizing access to
  food, diminishing purchasing power, and lowering economic productivity.
• Across the RBC region in 2020 there has been; an increase in malnutrtion
  and food insecurity; a surge in IDPs and refugees; an average drop in national
  GDPs by 10%; and wide scale loss of savings and revenue. Given this, it is
  strongly recommended that WFP offices at the country, regional and Head
  office levels urgently set up contingency plans for increased fund raising at
  markedly higher levels than currently in place.
• WFP has been able to scale up assistance in the region in 2020. Nevertheless, further efforts are necessary to
  meet the needs. Technological solutions and learnings in the MENA region can be further leveraged moving
  forward, as addressing national social protection systems has become an important focus area in the region,
  including exploring new ways to mobilize financial resources for them in the context of a constrained fiscal
  environment for many governments.
• Substantial efforts must be made to share information on COVID-19 and change behaviors, to control infection
  levels in the region and speed up recovery and development of economies.
REFERENCES
[1]: Algeria: July 2020 VAM food security overview (Food insecurity figures pertaining to Sahrawi refugees only)

Armenia: Food Security and Vulnerability Assessment in Armenia, February 2021

Iraq: HNO/HRP2021

Jordan: mVAM December 2020 + Government Social Protection Caseload of Vulnerable Jordanians

Lebanon: Syrian (VASYR 2020), Lebanese (World Bank), Palestinian Refugees (UNRWA), Refugees of other nationalities (VARON)

Libya: MSNA/HNO 2021

Palestine: HNO / HRP 2021

Syria: HNO 2021

Tunisia: The pre-COVID-19 number of food insecure represents the number of people considered vulnerable by the Ministry of Social affairs (with the errors of inclusion and exclusion already noted by
studies made by the Centre d›Etudes Stratégiques de Tunis and other partners). This number does not include PLWHIV, rural vulnerable women, rural seasonal workers, the homeless and all those left behind
who have not been identified by the Ministry of social affairs and are not included in their calculations. In addition, a study has shown that 73% of primary school students receiving schools meals are not
included in this calculation and they represent the poor and very poor quintiles according to the INS National Institute of Statistics. Also, the number does not include the 15,000 migrants currently assisted
by OIM in Tunisia. As of May 6, the MAS estimates that 1,200,000 people are affected by COVID, which is an increase of 400,000 people.

Turkey: World Bank for Turkish and CVME 5 for refugees

Yemen: IPC Projection Jan 2021 - Mar 2021 (IPC 3+)

[2]: COMET, Adjusted Number of Actual Beneficiaries (Jan-Dec 2020) and ICSP, 2021 for Yemen

[3]: Economic indicators:

Oil production and prices: OPEC monthly reports

Tourism: statistical bureaus and/or central banks

GDP: World Bank estimates

Unemployment rates: statistical bureaus or World Bank based on ILO›s modeled estimate for 2020. Data retrieved in September 20, 2020.

Inflation rates: statistical bureaus

Food basket: WFP field monitoring or statistical bureaus

[4]: UNHCR DATA Portal https://www.unhcr.org/data.html, Armenia Inter-Agency Response Plan (October 2020 – June 2021) https://reliefweb.int/sites/reliefweb.int/files/resources/Armenia%20Inter-Agency%20
Response%20Plan.pdf, Palestinian Central Bureau of Statistics

[5]: The Center for Systems Science and Engineering Johns Hopkins University - Daily update
REFERENCES
[6]: Alqahtani, A. S.; Rashid, H.; Basyouni, M. H.; Alhawassi, T. M.; BinDhim, N. F. Public Response to MERS-CoV in the Middle East: IPhone Survey in Six Countries. J. Infect. Public Health 2017, 10 (5), 534–540.
https://doi.org/10.1016/j. Jiph.2016.11.015.

[7]: Lohiniva, A.; Bassim, H.; Hafez, S.; Ahmed, E.; Saeed, T.; Talaat, M. Determinants of Hand Hygiene Compliance in Egypt: Building Blocks for a Communication Strategy. East. Mediterr. Health J. 2015, 21 (9),
665–670.

[8]: Allegranzi, B.; Memish, Z. A.; Donaldson, L.; Pittet, D. Religion and Culture: Potential Undercurrents Influencing Hand Hygiene Promotion in Health Care. Am. J. Infect. Control 2009, 37 (1), 28–34. https://doi.
org/10.1016/j. Ajic.2008.01.014.

[9]: Madani, A.; Boutebal, S. E.; Bryant, C. R. The Psychological Impact of Confinement Linked to the Coronavirus Epidemic COVID-19 in Algeria. Int. J. Environ. Res. Public. Health 2020, 17 (10), 3604. https://doi.
org/10.3390/ ijerph17103604.

[10]: Allegranzi, B.; Memish, Z. A.; Donaldson, L.; Pittet, D. Religion and Culture: Potential Undercurrents Influencing Hand Hygiene Promotion in Health Care. Am. J. Infect. Control 2009, 37 (1), 28–34. https://doi.
org/10.1016/j. Ajic.2008.01.014.

[11]: Zangana, A.; Shabila, N.; Heath, T.; White, S. The Determinants of Handwashing Behaviour among Internally Displaced Women in Two Camps in the Kurdistan Region of Iraq. PLOS ONE 2020, 15 (5), e0231694.
https://doi.org/10.1371/journal.pone.0231694.

[12]: COVID-19 Pandemic in Turkey: An assessment of readiness and impact on Refugees living in-camps https://data2.unhcr.org/en/documents/details/83266

[13]: COMET, Adjusted Number of Actual Beneficiaries (Jan-Dec 2020)

[14]: IBC, 2020

[15]: Social protection responses to the COVID-19 crisis in the MENA/Arab States region, Country responses and policy considerations, regional UN issue-based coalition on social protection (IBC-SP), July
2020, https://socialprotection.org/sites/default/files/publications_files/MENA%20COVID19%20brief%20-%20FINAL_v4.pdf and Economic update, UN Office of Resident Coordinator, Turkey, 2020

[16]: LA SÉCURITE ALIMENTAIRE DE L’ALGÉRIE A L’ÉPREUVE DE LA PANDÉMIE DE LA COVID-19, July 2020

[17]: https://enterprise.press/stories/2020/03/04/egypt-mulls-increasing-budget-allocations-for-subsidies-in-fy2020-2021-12931/

[18]: Syria mVAM (September 2020) Issue No. 48 https://reliefweb.int/sites/reliefweb.int/files/resources/WFP-0000119617.pdf

[19]: Food Security in Iraq Impact of COVID-19, August 2020 https://reliefweb.int/sites/reliefweb.int/files/resources/Iraq%20Food%20Security%20Report%20August%202020%20-%20Arabic.pdf

[20]: Jordan Food Seucirty Update Implications of COVID-19, May 2020 http://www.fao.org/3/cb1507en/CB1507EN.pdf

[21]: Agricultural Policy Monitoring and Evaluation 2020 https://www.oecd-ilibrary.org/sites/0d2529e7-en/index.html?itemId=/content/component/0d2529e7-en
The Regional Bureau Cairo VAM team consists of:

Amira Swedan                                       Filippo Pongelli             Moataz ElMasry
Regional Data Scientist                            GIS Officer                  GIS Officer
amira.swedan@wfp.org                               filippo.pongelli@wfp.org     moataz.elmasry@wfp.org

Cinzia Monetta                                     Gehan AlHossiny              Omneya Mansour
Market and Food Security Analyst                   Food Security Officer        Economic and Market Analyst
cinzia.monetta@wfp.org                             gehan.alhossiny@wfp.org      omneya.mansour@wfp.org

Eliana Favari                                      Lina Badawy                  Siddharth Krishnaswamy
Programme Policy Officer (VAM)                     VAM Officer (Statistician)   Regional Head of VAM and Monitoring
eliana.favari@wfp.org                              lina.badawy@wfp.org          siddharth.krishnaswamy@wfp.org

                   | Food Security Analysis
           To monitor COVID-19 outbreak in RBC and relevant indicators,
           please visit our RBC | COVID-19 Monitor Hub
You can also read