FISSION YIELD UNCERTAINTY PROPAGATION IN MULTI-PASS REFUELING PEBBLE-BED HTGR
←
→
Page content transcription
If your browser does not render page correctly, please read the page content below
EPJ Web of Conferences 247, 15006 (2021)                                                               https://doi.org/10.1051/epjconf/202124715006
PHYSOR2020

                  FISSION YIELD UNCERTAINTY PROPAGATION IN MULTI-PASS
                               REFUELING PEBBLE-BED HTGR

                                       Yizhen WANG1, Menglei CUI1, Jiong GUO1 and Fu LI1
              1
               Institute of Nuclear and New Energy Technology(INET), Collaborative Innovation Center of Advanced
              Nuclear Energy Technology, Key Laboratory of Advanced Reactor Engineering and Safety of Ministry of
                                       Education, Tsinghua University, Beijing 100084, China

                  wangyz16@mails.tsinghua.edu.cn, cml17@mails.tsinghua.edu.cn, guojiong12@tsinghua.edu.cn,
                                                    lifu@tsinghua.edu.cn

                                                                   ABSTRACT

                  Multi-pass refueling scheme is a highlighted feature of pebble bed HTGR which spatially
                  mixes the burnup calculation inside core. Such refueling scheme relate burnup calculation in
                  one region of the core to others and thus affects the uncertainty propagation of nuclear data,
                  e.g. fission product yield. In this work, thermal neutron induced U-235 fission product yield
                  uncertainties are propagated in HTR-PM models with various refueling schemes in V.S.O.P.
                  code. And the effect of multi-pass refueling scheme is studied. Bayesian method is applied to
                  estimate the covariance of fission product yield based on ENDF/B-VII.1 fission yield sub-
                  library. Uncertainty quantification is performed with stochastic sampling method and log-
                  normal based correlated sampling method is used to generate reasonable and self-consistent
                  fission product yield samples. The analyzed results indicate that multi-pass refueling scheme
                  could affect the uncertainty propagation of reactor local responses.

         KEYWORDS: Multi-pass refueling scheme, fission yield uncertainty, pebble-bed HTGR

                                                            1. INTRODUCTION

         The continued research and design of pebble-bed High Temperature Gas-cooled Reactor (HTGR) require not
         only high-fidelity codes to provide accurate reactor system predictions, but also systematic uncertainty analysis
         to assign confidence bounds to those predictions. Specifically, uncertainty analysis of fuel pebble maximum
         temperature under accidental scenario serves as primary aspect for assessing reactor safety margin and design.
         Such analysis needs propagate nuclear data’s uncertainty throughout reactor burnup process to released decay
         heat after accident occurrence. Although previous research has investigated nuclear data’s uncertainty
         contribution to neutronics calculation[1, 2], few research has extended it to reactor burnup calculation and even
         little has involved fission yields’ uncertainty propagation, whose contribution is presumably important to
         decay heat release [3, 4]. This study aims to establish fission yields uncertainty analysis method throughout
         pebble-bed HTGR burnup calculation based on V.S.O.P. computer code system [5]. It serves as a preliminary
         study for further conducting reactor accidental safety analysis.

         Most notably, this study places additional attention on investigating what effect does multi-pass refueling fuel
         management scheme have on uncertainty propagation inside the core. Multi-pass refueling fuel management
         scheme or multi-pass refueling scheme is a highlighted feature of pebble-bed HTGR. What is distinct from
         Light Water Reactor (LWR) burnup calculation is that isotopes’ compositions evolve not merely within each

            Correspondence author: Jiong GUO, guojiong12@tsinghua.edu.cn

  © The Authors, published by EDP Sciences. This is an open access article distributed under the terms of the Creative Commons Attribution License 4.0
  (http://creativecommons.org/licenses/by/4.0/).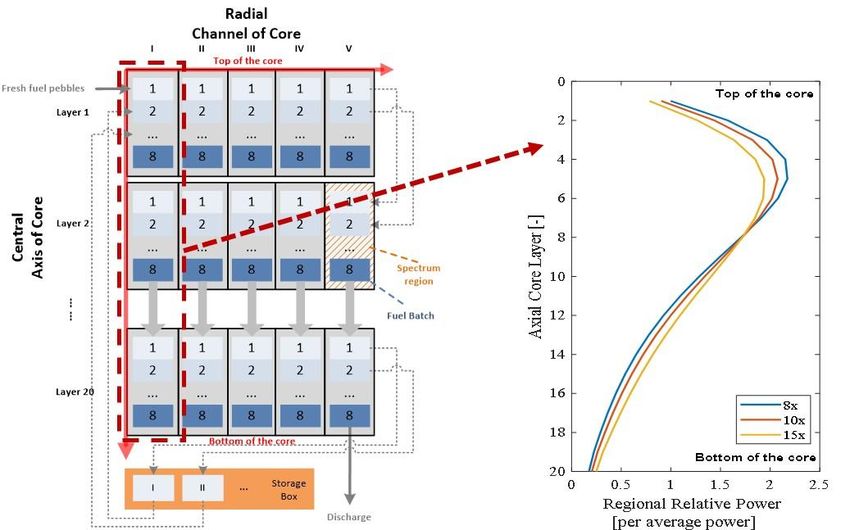
EPJ Web of Conferences 247, 15006 (2021)                                                https://doi.org/10.1051/epjconf/202124715006
PHYSOR2020

         individual spectrum region, but are mixed and related among all regions via fuel refueling. It is therefore
         quantified uncertainty in every corner of the core stems from both temporal accumulation and spatial mixing of
         fuel burnup during reactor operation. This novel investigation addressing uncertainty analysis related to non-
         fixed flowing pebble bed core would provide knowledge about uncertainty propagation characteristics of
         pebble-bed HTGR.

         This paper is organized as follows: Chapter 2 recaps the description about HTR-PM with emphasis on its
         refueling process modeling. Chapter 3 presents the methodology applied in this work, including established
         framework for fission yields uncertainty propagation based on stochastic sampling method as well as
         independent yields covariance estimation based on ENDF/B-VII.1 by Bayesian method. Analyzed reactor
         responses are categorized into two types, namely global response and local response. Their uncertainties
         quantified under different adopted multi-pass refueling schemes are compared and discussed in result chapter.

                                            2. CORE MODEL DESCRIPTION

         HTR-PM (High Temperature gas-cooled Reactor Pebble-bed Module) consists of two pebble-bed reactor
         modules and each of them includes a reactor core and a steam generator, shown as in Figure 1 (left). Large
         amount of spherical fuel elements or fuel pebbles stacks inside reactor core forming the cylindrical-like pebble
         bed, whose diameter and height are 3 m and 11 m, respectively. These fuel pebbles are of 60 mm diameter
         with thousands of small UO2 coated particles embedded inside. Detailed description and main design
         parameters of the HTR-PM could be referred to these review articles [6, 7].

           Figure 1. Cross-section view of HTR-PM reactor building [6] (left); V.S.O.P. burnup 2D model with
         adoption of eight times refueling scheme (right). The core is divided into five channels radially from the
         center to the outside, labelled from  to. Each channel is subdivided axially into 20 regions from top of
          the core to bottom, with each representing individual spectrum region (orange shading). Each region
               contains eight fuel batches numbered by the times of fuel pebbles passing through the core.

         One of the noteworthy feature of HTR-PM is the adoption of “multi-pass” refueling fuel management scheme.
         Fresh fuel pebbles of 8.5%wt enrichment are loaded into the top of the core, while spent fuel pebbles are

                                                                2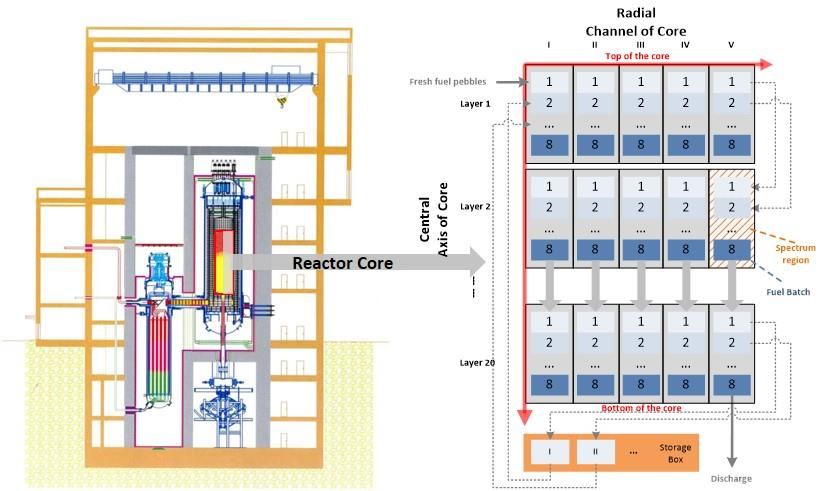
EPJ Web of Conferences 247, 15006 (2021)                                                      https://doi.org/10.1051/epjconf/202124715006
PHYSOR2020

         discharged at the bottom. During the irradiation of fresh fuels to spent fuels, fuel pebbles would be consistently
         reloaded into the core several times before their average burn-up reaching to design burnup depth 90 GWd/tU.
         To be specific, fuel pebbles whose burnup does not reach to design burnup depth would be loaded into the core
         to pass through it once again, while others reaching design burn-up depth would be discharged from the
         core[6]. After long term operation, an equilibrium core state is expected in the reactor whose materials’
         composition remains constant over time. This continuous loading fuel management is beneficial for achieving
         a fairly uniform fissile material distribution and a flatter power distribution throughout the core.

         In this study, the multi-pass refueling burnup process is modelled and simulated in V.S.O.P. computer code
         system [5]. A 2D R-Z geometry spectrum region discretization of reactor core is depicted in Figure 1 (right). It
         is noteworthy to mention that 100 spectrum regions are volume-equally partitioned throughout the core. Fuel
         batches characterize different fuel pebbles corresponding to different passing times and the number of them
         within each region is identical to the adopted refueling times. Therefore, fuel shuffling operation is introduced
         to simulate pebbles’ flow inside core. In proceeding a shuffling, materials of all fuel batches within each region
         will be transferred to the corresponding batches labeled with identical number in the subsequent region. The
         first batches appear at the top of the core will be loaded fresh fuel, and the last batches reside in the bottom
         region will be discharged. All other batches running out of the core will be collected into corresponding
         storage box and re-allocated equally into the corresponding subsequent batches in the top regions. This process
         follows the grey dash line depicted in Figure 1 (right).

                                  Table I. Main Equilibrium Core Parameters in 8x, 10x and 15x

                                                                     Eight times pass   Ten times pass    Fifteen times pass
                                  Parameters
                                                                           (8x)             (10x)               (15x)
                          Total thermal power [MW]                         250               250                 250

                          Average burnup [MWd/tU]                         90000.0          90000.0             90000.0

                     Heavy metal mass per fuel pebble [g]                   7                 7                   7

                Number of loaded fresh fuel pebbles per day [-]            397.0            397.0               397.0

                         Number of refueling times [-]                      8                10                  15

                           Refueling cycle length [d]                      6.60             5.28                3.52

             Time for pebbles going through the core per times [d]         132.0            105.6               70.4

                 Total residence time of pebbles in the core [d]          1056.0           1056.0              1056.0

                 Calculated average discharge burnup depth [-]            89912.0          89997.0             90212.0

         Thereafter, Reactor burnup evolution process is discretized into many fuel cycles with identical cycle length.
         Cycle length represents the time interval between two successive fuel shuffling. Smaller cycle length indicates
         a faster refueling and it allows fuel pebbles run through the core more times at given total residence time. In
         this study, three multi-pass refueling schemes are simulated, namely eight times pass (8x), ten times pass (10x)
         and fifteen times pass (15x), and their equilibrium core main parameters are listed in table I. Reactor responses
         of multiplication factor and region relative power are calculated and compared. Further, with the established
         fission yield uncertainty analysis framework descripted in the following chapter, yields’ uncertainty
         contributions to those responses are quantified and compared to address the multi-pass refueling effect on
         yields uncertainty propagation.

                                                                      3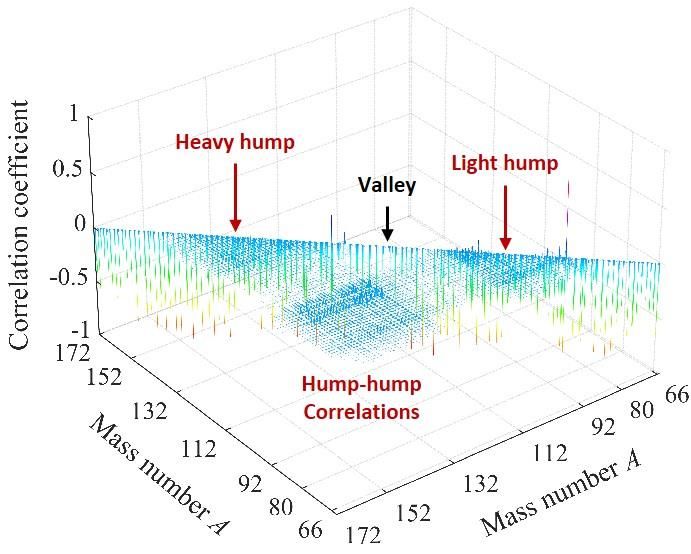
EPJ Web of Conferences 247, 15006 (2021)                                                                          https://doi.org/10.1051/epjconf/202124715006
PHYSOR2020

                                                                 3. METHODOLOGY

         3.1. Fission Yield Covariance Estimation

         Fission product yields characterize the fraction of fission products produced per fission. Depending on
         different fissile isotope and incident neutron energy, different fission system are categorized and recorded in
         ENDF/B-VII.1 library. This study focuses thermal neutron-induced U-235 fission system in this evaluated
         nuclear data library. However, yields data in this system originate from England and Rider’s work [8] in 1994.
         Although they provided a recommended independent and cumulative yield data sets along with corresponding
         uncertainties, covariance information is lacked from their work. In this study, independent yields’ covariance
         information is estimated by Bayesian method [9-11]. Because yield library adopted in V.S.O.P. uses a
         combined set of cumulative and independent yields for sake of shortening fission product decay chain, and also
         cumulative yields are dependent with independent yields by Q-matrix proposed by M. F. James [12], sampling
         directly on independent yields is critical to generate self-consistent combined V.S.O.P. yields library samples.
         Furthermore, because of the existence of consistency between independent and cumulative yields as well as
         inherent physical constrains imposed on independent yields, properly estimated covariance information is
         indispensable for generating self-consistent independent yield samples to permit a unbiased uncertainty
         analysis results.

         Bayesian method is feasible for updating and combining prior information of independent yields with
         upcoming new knowledge about them. By assigning initial Gaussian prior of independent yields and following
         M.T. Pigni’s derivation [11], the updating process is listed in Table II. It is noteworthy to mention that
         updating formulation of posterior independent yields mean value is not listed here.

                       Table II. Bayesian Updating Process for Independent Yields Covariance Estimation
                                                                                Independent yield distribution
               Index    Procedure Name
                                                Prior        Likelihood       Covariance updating formulation        Posterior         Comment

                                                                                                                                      ENDF/B-VII.1
                 0      Prior distribution   ~( ,  )         -                             -                         -
                                                                                                                                     MF=8, MT=454

                                                                                                                                      ENDF/B-VII.1
                        Cumulative yields                      =
                 1                           ~( ,  )                      =  −    ( +     )           ~( ,  )     MF=8, MT=459
                        consistency                           ~( , )
                                                                                                                                     MF=8, MT=457

                        Total yields                          =
                 2                           ~( ,  )                        =  −  (  +   )           ~( ,  )     =   = 2.0
                        conservation                         ~( ,   )


                                                                                                                                        =
                        Mass number                           =
                 3                           ~( ,  )                     =  −  (  +   )        ~( ,  )
                        conservation                         ~( ,   )                                                           =  − ̅
                                                                                                                                      = 233.57915


                        Charge number                         =!                                                                  !  =  "
                 4                           ~( ,  )                     =  −  !( + !  !) !         ~( ,  )
                        conservation                         ~( ,   )
                                                                                                                                     = " = 92.05318

         Here,  ∈ ℝ%× and  ∈ ℝ%×% are prior independent yields value and diagonal covariance matrix with each
         element directly taken from ENDF/B-VII.1 neutron induced fission yield sub-library (MF=8, MT=454), while
          ∈ ℝ%× and ∈ ℝ%×% are those for cumulative yields taken from fission yield sub-library (MF=8,
         MT=459). ∈ ℝ&×& is the Q-matrix constructed according to radioactive decay information provided in
         ENDF/B-VII.1 radioactive decay sub-library (MF=8, MT=457).   is summation precision and is taken as
         10  . The updating process is implemented sequentially from index 1 to index 4 and the final resulting
         posterior distribution of independent yields is ~( ,  ) . The calculated correlation matrix from the
         estimated covariance matrix  is shown as Figure 2.

         Independent yields distribution of 0.0253 eV neutron induced U-235 fission follows a two-humped pattern,
         with light hump having mass number range of 90 to 100 and heavy hump having mass number range of 132 to

                                                                                4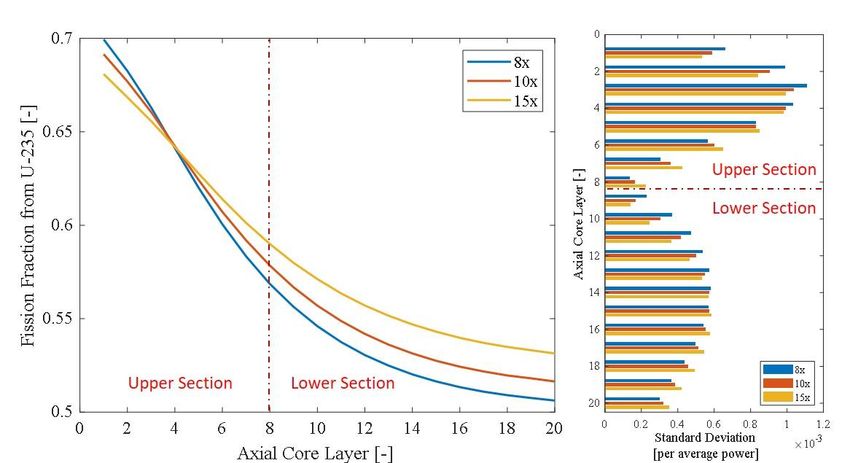
EPJ Web of Conferences 247, 15006 (2021) https://doi.org/10.1051/epjconf/202124715006
PHYSOR2020
142. Corresponding to this pattern, two features could be notice in Figure 2. First, there are many correlations
appear within each hump and between humps (shown as hump-hump correlation), while few correlations are
overserved between hump and valley part. These correlations are derived from the physical constrains imposed
on independent yields, which are fission system conservation of total yields, mass number and charge number.
Another feature is that many strong negative correlations appear alongside the diagonal part, which suggests
fission product yields within each mass chain correlated with each other negatively. This is induced by the
imposing consistency with cumulative yields on independent yields, because most radioactive decay fission
products within each mass chain will contribute to its corresponding final stable or long-lived products by '
decay. Uncertainty and measured yields of these stable or long-lived produces suggest negative correlations
among its precursor products.
Figure 2. Estimated independent yield correlation matrix. Upper diagonal is omitted in the figure.
The axis is the mass number of these fission products. These fission products are ordered firstly by
decreasing mass number, and then increasing charge number within each mass chain.
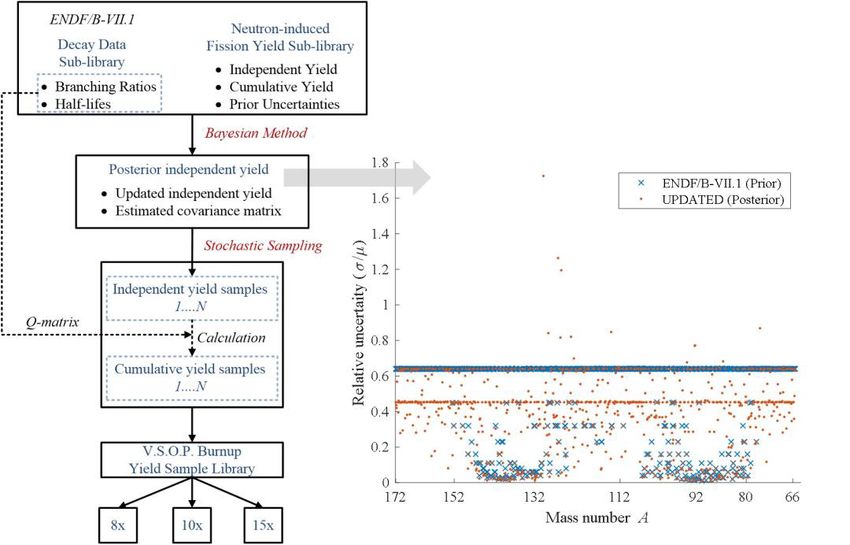
3.2. Stochastic Sampling of Fission Product Yields
Stochastic sampling based uncertainty analysis method is applied to propagate fission yield uncertainty in
pebble-bed HTGR burnup simulations. Figure 3 (left) illustrates fission yield uncertainty analysis flowchart.
As is described in section 3.1, stochastic sampling of posterior independent yields is conducted in this study.
However, direct sampling independent yield under normal distribution would generate inconsistent negative
value yield samples. This is because most independent yields have larger posterior relative uncertainty (larger
than 30%) as is shown in Figure 3 (right), and the PDF of these yields would expand a lot to their negative
range [13]. As is suggested by the principle of maximum entropy [14], instead of sampling yields under
normal distribution, lognormal distribution is assigned to posterior independent yields. Although lognormal
distribution would approximate normal distribution when the relative uncertainty of yield is small, the
uncertainty of posterior independent yield is large enough that assigning normal distribution would be
insufficient to describe its randomness and result in involving incorrect samples into the following burnup
uncertainty analysis.
5EPJ Web of Conferences 247, 15006 (2021) https://doi.org/10.1051/epjconf/202124715006
PHYSOR2020
Figure 3. Fission product yield uncertainty propagation flowchart (Left) and relative uncertainty of
prior and posterior independent yields (Right). Several larger posterior relative uncertainty (larger
than 60%) result from large discrepancy between calculated prior cumulative yields and those
provided in ENDF/B-VII.1.
Figure 4. Histogram of 2,000 independent yield samples of Cs-134 (Left) and Nd-143 (Right). Dark
brown parts are the overlaps between these two bar graphs.
Figure 4 presents histograms of 2,000 yield samples sampled under normal and lognormal distribution. Nd-143
has larger relative uncertainty 64.0%, while Cs-133 has smaller relative uncertainty 32.0%. Their sampling
results are compared in this figure to highlight the negative sample value issue discussed above. Histograms of
Cs-133 obtained from normal and lognormal distribution are fairly similar (Figure 4 left), while those for Nd-
143 are completely different (Figure 4 right) and many negative value yield samples are observed. Log-normal
distribution could capture the skewness of inherently positive yields’ distribution and provide more reasonable
and self-consistent perturbation samples sets.
6EPJ Web of Conferences 247, 15006 (2021) https://doi.org/10.1051/epjconf/202124715006
PHYSOR2020
4. RESULTS
4.1. Multiplication Factor Uncertainty
Table III shows uncertainty analysis results of multiplication factor in equilibrium core and comparison among
three multi-pass refueling schemes. 1,000 samples are analyzed to obtain the following results.
Table III. Multiplication Factor Uncertainty Analysis Results
Nominal Prediction Fission Yield Uncertainty Analysis Results
Refueling
Scheme Samples Relative
V.S.O.P. 95% CI Normality Test
Mean Uncertainty
8x 0.99881 0.99879 2.5755E-04 [2.4346E-04, 2.7465E-04] Failed: p=1.057E-04
10x 0.99990 0.99989 2.5759E-04 [2.4360E-04, 2.7461E-04] Failed: p=9.035E-05
15x 1.00106 1.00105 2.5867E-04 [2.4438E-04, 2.7548E-04] Failed: p=1.103E-04
Comment * 95% confidence interval is estimated by bootstrapping method with 100,000 bootstrap samples;
* Normality test is conducted on the z-score of multiplication factor samples with K-S test;
From the above table, it could be noted that yields uncertainty contribute a little to multiplication factor’s
uncertainty in equilibrium core. This is fairly consistent with only considering yields contribution, as
yields have little impact on neutron multiplication and absorption compared with other dominant
parameters, like cross section. These relative uncertainty results are agree with the results in magnitude
(around 10
) obtained in LWR [4], and this indicates the feasibility of proposed yields uncertainty
propagation framework in this study. In future work, this will be applied to study yields uncertainty
contribution to reactor decay heat release under accidental scenario, where yields are expected to be
important.
Another observation is that multi-pass refueling scheme has little impact on yields uncertainty
contribution to reactor global responses, like multiplication factor. From table II, multiplication factors
predicted under 8x, 10x and 15x are slightly different from each other, while their corresponding relative
uncertainty are fairly similar. Multiplication factor is a global response which is affected by the overall
burnup of the core. Considering all these three refueling schemes have reached similar average discharge
burnup depth, it is therefore their overall nuclide compositions in the core are similar. Because of that,
yields have similar contributions among different refueling schemes. Although equilibrium cores reached
via different refueling schemes could have overall similar average fuel burnup, the distribution of those
burnup throughout the core could vary a lot with different adopted refueling schemes. Subject to similar
average discharge burnup depth, more refueling times indicates faster reloading speed of the fuels. It
allows more fuel batches mixed within each spectrum region, and smaller burnup difference among those
fuel batches. Hence, more fueling times foresees a more “homogeneous” equilibrium core. Except for
global responses, it is therefore expected that yields uncertainty contribution to local responses, like
region relative power, are likely to be affected by fuel refueling times, as is going to be discussed in the
following section.
4.2. Region Relative Power Uncertainty
Channel I is the inner most channel of HTR-PM and it is partitioned into 20 spectrum regions axially, namely
layer 1 to layer 20. The relative power of each region in channel I is presented in Figure 5, and it could be seen
that multi-pass refueling scheme could flatten the power distribution inside the core. The more refueling fuel
pebbles undergo, the more fuel batches are within each region. Therefore, burnup difference among different
regions is smaller when more refueling procedures are adopted. Therefore region relative power is flattened.
7EPJ Web of Conferences 247, 15006 (2021) https://doi.org/10.1051/epjconf/202124715006
PHYSOR2020
Figure 5. Regional relative power distribution alongside Channel I. Each spectrum region is mixed
with different fuel batches corresponding to the adopted refueling times. Number of fuel batch is
identical to refueling times.
Figure 8. U-235 fission fraction alongside Channel I (left) and standard deviation of regional
relative power in Channel I (right). This fraction accounts for U-235 fission among all fissile fission,
including U-233, U-235, Pu-239 and Pu-241. Upper section stands for region 1 to region 8 and lower
section stands for region 9 to region 20.
Figure 8 (right) presents the quantified standard deviation of relative power in each region of Channel I
and results from 8x, 10x and 15x are compared in this figure. Yields have small contributions on relative
power (standard deviation is smaller than 0.12%) and it coincides with our belief that yields are small
8EPJ Web of Conferences 247, 15006 (2021) https://doi.org/10.1051/epjconf/202124715006
PHYSOR2020
effect in relative power prediction. Though yields are small effect, their uncertainty contributions to
relative power are still affected by the adopted refueling scheme. As shown in Figure 8(right), more
refueling times provide a more “flattened” uncertainty distribution and the uncertainty of peak relative
power is reduced. As only thermal neutron induced U-235 fission yields uncertainty are considered in this
study, this power uncertainty distribution is related to fission fraction of U-235 within each region.
Fission fraction of U-235 is shown in Figure 8 (left). It is observed that, in the upper section, fission
fraction distribution resembles standard deviation distribution of relative power. This is because the more
fission from U-235, the more its yields uncertainty would contribute to the release power. Additionally, in
the lower section of all these three refueling scheme, U-235 fission fractions become smaller and thus
yields’ contribution to relative power is smaller than upper section in general.
5. CONCLUSIONS
Based on ENDF/B-VII.1, thermal neutron induced U-235 fission product yield uncertainty propagation in
HTR-PM burnup process is studied. As one feature of HTR-PM, the effect of multi-pass refueling fuel
management scheme on yields uncertainty propagation is addressed and the following conclusions are
drawn from this study:
(1) A V.S.O.P. computer code system based fission yields uncertainty analysis framework is proposed in
this work to investigate yields uncertainty contribution to reactor responses during burnup simulation.
(2) Compared with cross section, yields uncertainty contribution to reactor responses is small for both
global response, like multiplication factor, and local response, like region relative power. This is
coincide with common belief.
(3) Multi-pass refueling scheme in HTR-PM could affect the propagation of yields uncertainty
contribution to reactor local responses. Specifically, more refueling times could allow a more
“flattened” region relative power uncertainty distribution and smaller uncertainty for peak relative
power, whereas global response uncertainty is not affected by refueling scheme.
Based on the proposed yields uncertainty framework in this study, yields uncertainty contribution to
released decay heat under accidental scenario will be investigated in further work and the multi-pass
refueling effect on it will be further addressed.
ACKNOWLEDGMENTS
This work is supported by the Chinese National S&T Major Project 2018ZX06902013, Chinese National
Natural Science Foundation Project 11505102, and IAEA Coordinated Research Project I31020.
REFERENCES
[1] L. Wang, J. Guo, and F. Li, "Direct Evaluation of Nuclear Data Uncertainty Propagation
in Pebble-bed HTR Core," in PHYSOR 2016, Sun Valley, Idaho, 2016, p. 2394.
[2] C. HAO, Y. CHEN, J. GUO et al., "Mechanism analysis of the contribution of nuclear
data to the keff uncertainty in the pebble bed HTR," Annals of Nuclear Energy, vol. 120,
pp. 857-868, 2018.
[3] L. Fiorito, C. J. Diez, O. Cabellos et al., "Fission yield covariance generation and
uncertainty propagation through fission pulse decay heat calculation," Annals of Nuclear
Energy, vol. 69, pp. 331-343, 2014.
[4] O. Leray, L. Fiorito, D. Rochman et al., "Uncertainty propagation of fission product
yields to nuclide composition and decay heat for a PWR UO2 fuel assembly," Progress
in Nuclear Energy, vol. 101, pp. 486-495, 2017.
9EPJ Web of Conferences 247, 15006 (2021) https://doi.org/10.1051/epjconf/202124715006
PHYSOR2020
[5] H. J. Rütten, K. A. Haas, H. Brockmann et al., "V.S.O.P. (99/05) Computer code system
for reactor physics and fuel cycle simulation," Forschungszentrum Jülich GmbH, ISR, Jül
– 4189, 2005.
[6] Z. Zhang, Z. Wu, D. Wang et al., "Current status and technical description of Chinese
2×250MWth HTR-PM demonstration plant," Nuclear Engineering and Design, vol. 239,
no. 7, pp. 1212-1219, 2009.
[7] Z. Zhang, Y. Dong, F. Li et al., "The Shandong Shidao Bay 200 MW e High-
Temperature Gas-Cooled Reactor Pebble-Bed Module (HTR-PM) Demonstration Power
Plant: An Engineering and Technological Innovation," Engineering, vol. 2, no. 1, pp.
112-118, 2016.
[8] T. R. E. a. B. F. Rider, "Evaluation and Compilation of Fission Product Yields 1993,"
Los Alamos National Laboratory1994.
[9] D. L. Smith, Probability, statistics, and data uncertainties in nuclear science and
technology. 1991.
[10] T. Kawano and M. B. Chadwick, "Estimation of 239Pu independent and cumulative
fission product yields from the chain yield data using a Bayesian technique," Journal of
Nuclear Science and Technology, vol. 50, no. 10, pp. 1034-1042, 2013.
[11] M. T. Pigni, M. W. Francis, and I. C. Gauld, "Investigation of Inconsistent ENDF/B-
VII.1 Independent and Cumulative Fission Product Yields with Proposed Revisions,"
Nuclear Data Sheets, vol. 123, pp. 231-236, 2015.
[12] M. F. James, R. W. Mills, and D. R. Weaver, "A new evaluation of fission product yields
and the production of a new library (UKFY2) of independent and cumulative yields,"
Progress in Nuclear Energy, vol. 26, no. 1, pp. 1-29, 1991.
[13] D. L. Smith, D. G. Naberejnev, and L. A. Van Wormer, "Large errors and sever
conditions," Nuclear Instruments and Methods in Physics Research A, vol. 488, no. 1-2,
pp. 342-361, 2002.
[14] F. H. Fröhner, "Assigning Uncertainties to Scientific Data," Nuclear Science and
Engineering, vol. 126, no. 1, pp. 1-18, 1997.
10You can also read