The Poggendorff illusion explained by natural scene geometry - PNAS
←
→
Page content transcription
If your browser does not render page correctly, please read the page content below
The Poggendorff illusion explained by natural
scene geometry
Catherine Q. Howe, Zhiyong Yang, and Dale Purves*
Center for Cognitive Neuroscience and Department of Neurobiology, Duke University, Durham, NC 27708
Contributed by Dale Purves, April 7, 2005
One of the most intriguing of the many discrepancies between
perceived spatial relationships and the physical structure of visual
stimuli is the Poggendorff illusion, when an obliquely oriented line
that is interrupted no longer appears collinear. Although many
different theories have been proposed to explain this effect, there
has been no consensus about its cause. Here, we use a database of
range images (i.e., images that include the distance from the image
plane of every pixel in the scene) to show that the probability
distribution of the possible locations of line segments across an
interval in natural environments can fully account for all of the
behavior of this otherwise puzzling phenomenon.
geometrical illusions 兩 natural scene statistics 兩 range images 兩 visual
perception
J ohann Poggendorff pointed out in the 19th century that when
the continuity of an obliquely oriented line is interrupted, the
positions of the line segments on either side of the interruption
appear to be shifted vertically (or horizontally if the interruption
is oriented horizontally) (1). When presented in the format in
Fig. 1A, the right oblique line segment appears to be shifted
downward relative to the left segment, even though they are
actually collinear. In Fig. 1B, which is the mirror image of Fig.
Fig. 1. The Poggendorff illusion and its behavior. (A) When an obliquely
1 A, the right line segment appears to be shifted but in this case
oriented straight line is interrupted by a vertical occluder, the line segment on
upward relative to the left segment. A similar effect is elicited the right appears to be shifted downward with respect to the line segment on
when the oblique line is interrupted by a space delineated by two the left. (B) A similar effect occurs when the orientation of the interrupted line
parallel horizontal lines instead of two vertical lines, as in Fig. 1C. is reversed. In this case, the collinear extension on the right appears to be
In this presentation, the right segment appears to be shifted to shifted upward. (C) When an oblique line is interrupted by parallel horizontal
the right with respect to the left segment. The magnitude of the lines, the oblique line segments appear to be shifted horizontally with respect
to each other. (D) The magnitude of the effect increases as the interrupted line
apparent shift of the oblique line segments in these several
is made more vertical. (E) The magnitude also increases as the width of the
configurations also varies as a function of the orientation of the interruption increases. (F) The illusion is largely abolished when only the acute
interrupted line and the width of the interruption. In standard components of the stimulus are presented, but the effect is maintained when
presentations of the Poggendorff stimulus (Fig. 1 A and B), the only the obtuse components are shown. (G) The illusion is diminished when
effect increases as the orientation of the interrupted line be- the standard configuration is rotated so that the interrupted line is horizontal.
comes increasingly vertical (Fig. 1D) (2, 3); the effect also
increases as the width of the interruption increases (Fig. 1E) (3).
A particularly puzzling aspect of the phenomenon is that the Methods
illusion is largely abolished when only the acute components of The Range Image Database. The details of the range image
the standard Poggendorff stimulus are shown. However, the database used have been described in ref. 6. The images were
effect remains if only the obtuse components are present (4) acquired by using a range imaging system (LMS-Z210 3D Laser
(Fig. 1F). Finally, when the overall orientation of the stimulus is Scanner, Riegl USA, Orlando, FL), which identified the dis-
rotated such that the interrupted line is horizontal (Fig. 1G), the tances of object surfaces from 2 m to ⬇300 m with an accuracy
NEUROSCIENCE
effect is reduced but not completely abolished (2, 3, 5). of ⫾25 mm (Fig. 2A). By using this system, we collected ⬇100
Although a variety of theories have been proposed to account wide-field images extending 333° horizontally and 80° vertically
for the Poggendorff illusion (see Discussion), none of these at a resolution of 0.144°. Of these images, 25 were obtained in
explanations rationalizes the full range of behavior illustrated in fully natural environments in undeveloped terrain, and the rest
Fig. 1. Here, we test the hypothesis that the Poggendorff effect were obtained in outdoor or indoor settings that included human
and its altered behavior in different presentations are generated constructions (see also ref. 7). Only the midportion of the
by the accumulated experience of humans with the various wide-field images (⬇110° horizontally ⫻ 52° vertically) was used
sources of interrupted linear features in typical environments. By for analysis.
collecting a range image database with information about the 3D
structure of a large series of natural scenes, we assessed whether
these geometrical illusions are indeed explained by the proba- Freely available online through the PNAS open access option.
Downloaded by guest on March 31, 2021
bility distribution of the relative locations of line segments across *To whom correspondence should be addressed. E-mail: purves@neuro.duke.edu.
a spatial interval. © 2005 by The National Academy of Sciences of the USA
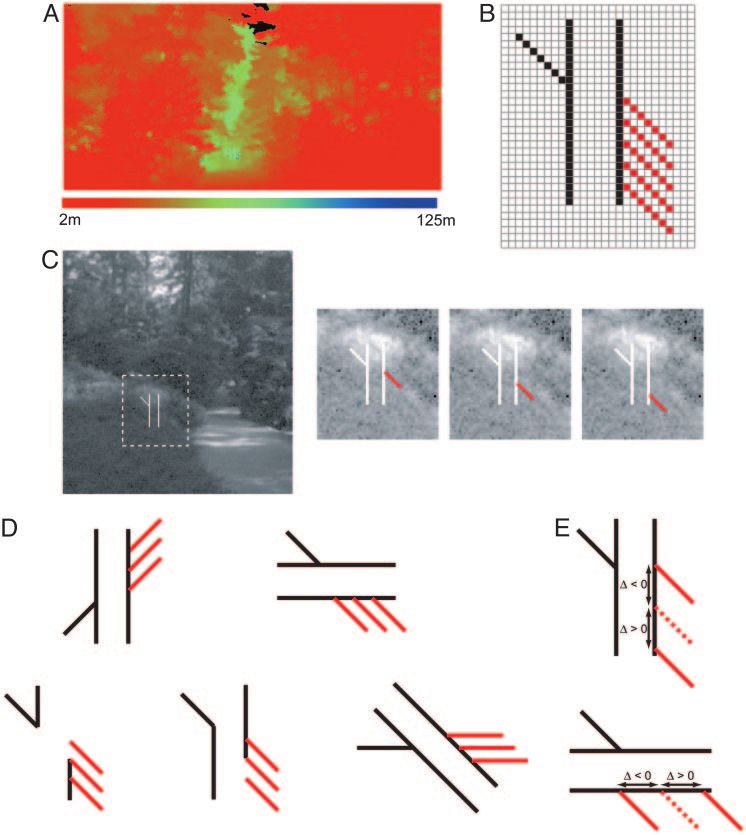
www.pnas.org兾cgi兾doi兾10.1073兾pnas.0502893102 PNAS 兩 May 24, 2005 兩 vol. 102 兩 no. 21 兩 7707–7712Fig. 2. Determining the possible physical sources of the right line segment given the other three lines in a Poggendorff stimulus. (A) The midportion of a
wide-field range image acquired with a laser range scanner that encodes the distance of each pixel in the scene (indicated by the color bar). Black areas (sky)
are regions where the laser beam did not return a value. (B) Examples of the templates for sampling the lines comprising the standard Poggendorff stimulus
(Fig. 1 A) in the range image database. Pixels in an image patch are represented diagrammatically by the grid squares; black pixels indicate the template for the
left oblique line segment and the two vertical lines; red pixels indicate a series of templates for sampling the right line segment at various vertical locations. (C)
The solid white lines indicate a valid sample of the left oblique line segment and the two vertical lines. Magnifications of the boxed portion of the scene show
examples of the subsequent application of additional templates (red) to test for the presence of right oblique segments at different vertical positions. (D) The
variants of the Poggendorff stimulus illustrated in Fig. 1 could be sampled by using appropriately configured templates. In these examples, the black lines are
equivalent to the black template in B, and the red lines are equivalent to the red templates. (E) Definition of the relative physical location of the two segments
of the interrupted line. ⌬ signifies the location of the right line segment relative to the location at which the left line segment, if extended (dotted red line),
would intersect the right vertical line (or the lower horizontal line); ⌬ was designated negative if a right segment was located above (or to the left of) this point
of intersection and positive if a right segment was located below (or to the right).
Empirical Framework and Hypothesis. When the continuity of a percepts according to the accumulated experience in dealing
physical object is interrupted by occlusion, the location of its with the physical sources of retinal stimuli. If this hypothesis is
reappearance on the other side of the interruption is inevitably correct, the percepts elicited by the stimuli in Fig. 1 should
uncertain: there are many ways the object could have traversed reflect the past experience of human observers with the physical
the interval, and the interruption does not provide information sources of straight-line segments that are in the same orientation
about which of the possible ways actually generated the stimulus. but separated by a spatial interval. More specifically, given a line
Thus, the oblique line segments in the standard Poggendorff segment on one side of an implied occluder, the perceived
presentation in Fig. 1 could arise from a single object with an position of a second line segment in the same orientation but on
infinite variety of possible configurations or from two different the other side should be predicted by the relative probability of
objects altogether. In short, the stimulus reflects the fundamen- occurrence of the physical sources of line segments projected in
tal uncertainty of how the physical sources of projected line that orientation.
segments are actually continued across a spatial interval. The
Downloaded by guest on March 31, 2021
hypothesis examined here is that the way humans produce useful Sampling the Database. Fig. 2B shows examples of the geometrical
behavioral responses in the face of this uncertainty is to generate templates we applied to the range images to sample the physical
7708 兩 www.pnas.org兾cgi兾doi兾10.1073兾pnas.0502893102 Howe et al.sources of the four lines comprising the standard Poggendorff
stimulus. For present purposes, a straight line is defined as a set
of points whose positions in space conform to a linear progres-
sion; thus, the lines sampled were not required to correspond to
luminance contrast boundaries or to belong to a single object
surface. The rationale for this purely geometrical definition in
analyzing the structure of natural scenes is explained in ref. 8.
Determination of the physical sources of a Poggendorff
stimulus in these terms involved several steps. We first identified
a region of a scene that contained a physical source of one of the
two oblique line segments (the left segment, for example), as well
as the sources of the two vertical lines. Then, in the same region
of the scene, we determined the frequency of occurrence of the
physical sources of possible right line segments, i.e., line seg-
ments that had the same projected orientation as the left oblique
segment and were located just to the right of the right vertical
line. A template for sampling the left oblique line segment and
the two vertical lines is shown in Fig. 2C. The points in the image
underlying each straight line in the template were then examined
to determine whether the corresponding physical points formed
a straight line in 3D space. The underlying points were accepted
as a straight line if their average deviation from a fitted line by
using a least-squares method was ⬍2% of the average distance
of the physical points from the origin of the laser beam. If all of
the lines identified by the template met this criterion, the set was
accepted as a valid physical source of these three components of
the Poggendorff stimulus (see Fig. 2C, leftmost panel). Having
identified a region that contained sources of the first three lines,
a template for sampling the right oblique line segment was
applied just to right of the right vertical line, as shown by the red
pixels in Figs. 2 B–D. This additional template was moved
vertically in sequential applications to determine all of the
possible physical sources of the right oblique segment at different
vertical locations relative to the left oblique segment. The
location of the right segment was assessed in terms of the
distance (⌬, expressed in terms of the visual angle subtended)
from the point of intersection of the right oblique segment with
the right vertical line to the point at which the left oblique
segment, if extended, intersected the right vertical line (Fig. 2E). Fig. 3. Probability distributions of the physical sources of the right line
The physical sources of the variants of the Poggendorff stimulus segment in the standard Poggendorff stimuli. (A) The probabilities of occur-
rence of the physical sources of the right oblique line segment for the standard
illustrated in Fig. 1 were similarly determined by using appro-
Poggendorff stimulus in Fig. 1 A presented as a function of the location of the
priately configured sampling templates, as indicated in Fig. 2D. right segment relative to the left oblique segment. The relative location of the
For each configuration tested, the number of occurrences of two oblique line segments, ⌬ (see Fig. 2E), is given in terms of visual angle. (B
the physical sources of the right line segments at different and C) Probability distributions of the physical sources of the right line
locations relative to the left segment was tallied, and this segment for the stimulus configurations in Fig. 1B (B) and Fig. 1C (C). Arrows
information was used to produce the corresponding probability indicate the mode of the distribution here and in subsequent figures.
distribution of the sources of the right segments (⬇104 samples
were obtained by each tested configuration). We could then ask
whether these distributions predicted the perceptual phenomena therefore predicts that a right segment that is actually collinear
elicited by the standard Poggendorff stimulus and its variants. with the left should be seen as displaced downward.
To appreciate the reasoning underlying this conclusion, con-
Results sider a hypothetical world in which the sources of right oblique
Explanation of the Standard Poggendorff Effect. According to the segments at all vertical locations are equally likely. In this case,
empirical hypothesis being tested here, the probabilities of the perceived vertical location of a right line segment would not
NEUROSCIENCE
occurrence of the physical sources of right oblique line segments be biased one way or another by an observer’s past experience.
at different vertical locations relative to the left segment should Accordingly, a right line segment that was actually collinear with
determine how observers perceive the relative positions of the the left segment would be seen as such. As shown in Fig. 3A,
two segments in the Poggendorff stimulus. Fig. 3A shows that however, the real-world sources of the right line segment, given
when the left oblique segment is oriented downward and to the the left oblique segment and the vertical occluder, are biased
right, as in Fig. 1 A, the probability distribution of the possible toward locations above the point of collinearity with the left
sources of the right segment is biased toward locations that segment. Assessed against this body of past experience, then, a
correspond to negative values of ⌬. In other words, the majority right line segment that is geometrically collinear with the left
of the physical sources that give rise to projections of right segment would appear shifted downward. Thus, the probability
oblique line segments in the same orientation as the left segment distribution derived from the fully natural scenes in the database
will, in the past experience of human observers, have projected can indeed account for the standard Poggendorff effect.
Downloaded by guest on March 31, 2021
above the point at which an extension of the left oblique line Conversely, when the orientation of the interrupted line in the
intersects the right vertical line. This probability distribution stimulus is upward from the lower left, as in Fig. 1B, the probability
Howe et al. PNAS 兩 May 24, 2005 兩 vol. 102 兩 no. 21 兩 7709Fig. 4. The probability distribution of the physical sources of the right line Fig. 5. Probability distributions of the physical sources of the right line
segment changes progressively as the orientation of the interrupted line (A) segment when the standard Poggendorff stimulus is decomposed or rotated.
or the width of the interruption (B) is altered. ␣ represents the angle of (A) The probability distribution obtained when only the acute components of
intersection between the interrupted oblique line and the vertical lines, and the stimulus are present, compared with the distribution when only the
w is the width of the interruption. w ⫽ 1° in (A) and ␣ ⫽ 45° in (B); both values obtuse components are considered. In both cases, the orientation of the
were measured in terms of visual angle. interrupted line was 45° and the width of the interruption 1°. (B) The prob-
ability distribution obtained when the standard Poggendorff stimulus is
rotated such that the interrupted line is horizontal (see Fig. 1G). The distri-
bution for the standard stimulus is replotted from Fig. 3A for comparison.
distribution of the sources of the right line segment is biased toward
locations below the point at which a continuation of the left line
intersects the right vertical line (i.e., toward values of ⌬ ⬎ 0) (Fig. acute angles in the standard stimulus are presented but little
3B). By the same reasoning, a right oblique segment that is actually affected when the presentation is restricted to the obtuse com-
collinear with the left segment will in this case be seen to be ponents (see Fig. 1F). As shown in Fig. 5A, when only the acute
somewhat above the point where an extension of the left segment elements are used as the templates for sampling the range images
intersects the right vertical line, as indeed it is.
(see Fig. 2D), the mode of the probability distribution (arrow) is
A similar explanation applies to the Poggendorff stimulus in
very near the point where ⌬ equals zero. Accordingly, the
which an oblique line is interrupted by two horizontal lines.
Poggendorff effect should be largely abolished. Conversely,
When the left oblique segment is oriented downward and to the
when only the obtuse components are used, the probability
right, as in Fig. 1C, the probability distribution of the sources of
distribution is similar to that of the standard Poggendorff
the right line segment is biased toward locations to the left of the
point at which ⌬ ⫽ 0 (Fig. 3C). Thus, the location of the right stimulus; thus, the illusion would be expected to retain its full
segment appears shifted to the right from the continuation of the magnitude.
left line, which is again consistent with what people see. Finally, we determined the probability distribution of the
sources of the right line segment when the overall orientation of
Explanation of Other Features of the Poggendorff Effect. Changing the Poggendorff stimulus is rotated so that the interrupted line
either the orientation of the interrupted line or the width of the is horizontal, as in Fig. 1G. Compared with the standard
interruption systematically also shifts the relevant probability presentation, the distribution when the stimulus is rotated 90°
distributions in a manner consistent with the altered magnitude has a mode closer to ⌬ ⫽ 0, as shown in Fig. 5B. As a result, the
of the perceptual effects in these presentations. The effects of Poggendorff effect should be reduced but not abolished when
varying the intersecting angle of the interrupted line (Fig. 1D) the presentation of the interrupted line is horizontal, as it is.
and of varying the width of the interruption (Fig. 1E) on the
corresponding probability distributions of the physical sources of Statistics Derived from Different Types of Scenes. Theories purport-
the right line segment are shown in Fig. 4 A and B, respectively. ing to explain one or more aspects of the Poggendorff illusion
As the orientation of the interrupted line becomes closer to the have often been based on intuitions about the ‘‘carpentered’’
orientation of the lines defining the interruption (vertical in world of human artifacts (9, 10). It was thus of interest to ask how
the example in Fig. 4A) or as the interruption becomes wider, the the probability distributions derived from fully natural scenes
mode of the distribution shifts progressively away from the point (presumably representative of the human visual environment
at which ⌬ ⫽ 0, in accord with the fact that the perceived shift during evolution) compare with distributions derived from en-
in the apparent location of the right line segment increases as the vironments in which human construction is prevalent. We there-
angle of the intersection becomes smaller or as the width of the fore computed the relevant probability distributions from the set
interruption increases (3). of scenes in the database that included some or many man-made
Downloaded by guest on March 31, 2021
Another puzzle that can be explained in these terms is the fact objects. As shown in Fig. 6, the pertinent probability distribu-
that the Poggendorff effect is greatly diminished when only the tions obtained from the two types of scenes are generally similar.
7710 兩 www.pnas.org兾cgi兾doi兾10.1073兾pnas.0502893102 Howe et al.plane when it is above the point at which ⌬ ⫽ 0 than when it is
below this point. Thus, the likelihood of occurrence of the
physical sources of the right line segment is greater for positions
at which ⌬ ⬍ 0 (i.e., above the point of ⌬ ⫽ 0) than for positions
at which ⌬ ⬎ 0. As a result, the probability distribution in Fig.
3A is biased toward ⌬ ⬍ 0. The same reasoning can explain the
biases seen in the distributions in Fig. 3 B and C.
When the orientation of the interrupted line in the standard
Poggendorff stimulus is closer to vertical or when the width of
the interruption increases, the same shift in the vertical position
of the right line segment results in a larger difference in the
distances of right line segments from the center of the plane
Fig. 6. The probability distribution of the sources of the right line segment containing the physical source of the left segment and the
for the standard Poggendorff stimulus derived from an analysis of fully vertical lines (Fig. 7B). There is, accordingly, an increased bias
natural scenes (see Fig. 3A) compared with the distribution derived from the in the probability distribution of the sources of the right line
scenes that contained human constructions. segment as a function of the orientation of the interrupted line
and a function of the width of the interruption (see Fig. 4). The
reason for the greater bias in the presence of only the obtuse
It thus seems safe to conclude that the perceptual effects components of the stimulus compared with only the acute
apparent in the Poggendorff illusion are not specifically depen- components (see Fig. 5A) is also straightforward in these terms.
dent on interactions with the rectilinear constructions associated In the stimulus comprising the acute components (see Fig. 1F),
with human culture. the right vertical line does not extend above the point at which
⌬ ⫽ 0, reducing the likelihood that its physical source (i.e., an
Physical Bases for the Statistical Biases Observed. Two questions so underlying planar surface) extends above this point. This statis-
far deferred in considering the statistics derived from our tical change in turn reduces the likelihood of occurrence of
analysis of the range images are why the observed biases in the sources of the right oblique segment above the point at which
occurrence of the physical sources of the right line segment exist ⌬ ⫽ 0. In contrast, the right vertical line is present above the
and why the magnitude of these biases differs for the different point at which ⌬ ⫽ 0 in the stimulus composed of the obtuse
configurations of the Poggendorff stimulus considered here. components; the bias toward ⌬ ⬍ 0 in the corresponding
A major part of the answer to these questions lies in the distribution of the sources of the right oblique segment is
geometry of planar surfaces, which are the typical sources of therefore maintained.
straight-line projections on the retina. Consider, for instance, the Finally, it is important to explain the physical basis of the
physical sources of the standard stimulus in Fig. 1 A. The reduced bias in the probability distribution of the sources of the
presence of a physical source of the left oblique line segment and right line segment when the standard Poggendorff stimulus is
rotated such that the interrupted line is horizontal (see Fig. 5B).
the vertical lines would usually signify the presence of a planar
This reduction cannot be rationalized in terms of the relationship
surface in the corresponding region of the scene. Because a right
between the right line segment and the plane containing the
oblique line segment above the point at which ⌬ ⫽ 0 is, on
source of the left segment and the vertical lines because this
average, closer to the center of the plane than a line segment relationship is unchanged from that in the standard stimulus,
below this point (Fig. 7A), the set of physical points correspond- despite the rotation. The reason in this case is the higher overall
ing to a right line segment is statistically more likely to be in this frequency of occurrence of the sources of horizontal lines in the
physical world (see Fig. 8, which is published as supporting
information on the PNAS web site). The greater probability of
occurrence of the sources of horizontal lines compared with the
sources of oblique lines makes the probability distribution of the
right horizontal line segment in the rotated stimulus less sus-
ceptible to the bias caused by the presence of the other stimulus
elements, much as a higher baseline makes a signal detector less
sensitive to the same input.
Discussion
Despite numerous studies (1), the Poggendorff effect remains
one of the most controversial of the geometrical illusions. Here
we have shown that this effect and its complex behavior in
different presentations can be accounted for by the relationship
NEUROSCIENCE
Fig. 7. Physical basis for the bias in the probability distributions of the between the stimulus in the image plane and its possible sources
sources of Poggendorff stimuli. (A) In the standard stimulus, a right line in natural visual environments. From the analysis presented, it
segment above the point at which ⌬ ⫽ 0 (gray arrowhead) is, on average, should be apparent that the biased image–source relationships
closer to the center of the plane containing the physical source of the left seg- that account for the Poggendorff effect and its variants are
ment and the vertical lines than is an otherwise comparable right line segment rooted in the statistical properties of the physical world in which
below the point at which ⌬ ⫽ 0. The distances of the right line segments from human observers reside. Thus, this relationship has to be derived
the center of the plane (black dot within the dashed line that outlines the empirically by examining the natural environment and cannot be
plane) are indicated by the gray dotted lines; the difference in the lengths of
deduced from principles of projective geometry per se.
the two gray dotted lines is indicated by the black bar below the diagram. (B)
As the orientation of the interrupted line becomes more vertical (Left) or as
the width of the interruption increases (Right), the same shift in the vertical Previous Explanations of the Poggendorff Effect. The explanation
position of the right line segment means a larger difference in the distances most often offered in the past has been that the illusion derives
Downloaded by guest on March 31, 2021
of the right line segments from the center of the plane. The differences in the from a misperception of the angles in the stimulus (11, 12). For
lengths of the gray dotted lines are again indicated by the black bars. instance, an overestimation of the acute angles in the standard
Howe et al. PNAS 兩 May 24, 2005 兩 vol. 102 兩 no. 21 兩 7711stimulus in Fig. 1 A and an underestimation of the obtuse ones fundamentally uncertain significance of any given retinal pro-
would presumably affect the apparent orientation of the line jection for visually guided behavior. Because 3D spatial rela-
segments on either side of the interruption toward horizontal, tionships in the physical world are transformed into 2D rela-
thus causing them to appear noncollinear. This explanation, tionships in the image plane, the physical reality underlying any
however, has been disputed (1) on the grounds that it cannot given geometrical relationship in the retinal image is necessarily
rationalize the paradoxical abrogation or preservation of the ambiguous: a given configuration in the image plane could have
illusion elicited, respectively, by presentation of only the acute or been generated by many different physical sources. It seems
only the obtuse components of the stimulus (see Fig. 1F). Nor inevitable, therefore, that this problem be addressed by taking
does this explanation account for the additional features of the advantage of past experience with retinal images and their
Poggendorff effect shown in Figs. 1D, E, and G. physical sources. The behavioral interactions of humans and
Another explanation is based on the idea that the geometrical other animals with the physical sources of images in natural
information in the retinal projection might be inappropriately visual environments have presumably led to the instantiation of
‘‘interpreted’’ by obser vers. For example, the ‘‘depth- the relevant statistical relationships in visual system circuitry
processing’’ theory suggests that the oblique lines in the Poggen- over evolutionary time. Indeed, a growing body of evidence
dorff stimulus are interpreted as lines extending in depth, and supports this concept of vision (see, for example, refs. 15 and 16).
are therefore perceived to be noncollinear (10, 13, 14). This More specifically, statistical analyses of natural geometry perti-
category of explanation is also limited in that it considers only nent to the perception of surface shape and orientation (17),
some aspects of the projective geometry of the stimulus and its egocentric distance (18), spatial intervals (6), and object size (19)
possible sources and cannot explain the full range of the percepts have successfully explained complex perceptual phenomena in
elicited by the configurations in Fig. 1. each of these several categories of perceived geometry.
Biological Rationale. An important question not yet fully ad- We thank F. Long, S. Nundy, D. Schwartz, and J. Voyvodic for useful
dressed is why, from the perspective of biological success, comments and criticisms. This work was supported by the National
generating geometrical (and other visual) percepts on a statis- Institutes of Health, the Air Force Office of Scientific Research, and the
tical basis is useful and indeed necessary. The answer lies in the G. B. Geller Endowment.
1. Robinson, J. O. (1998) The Psychology of Visual Illusion (Dover, Mineola, NY). 10. Gregory, R. L. (1997) Eye and Brain (Princeton Univ. Press, Princeton, NJ).
2. Day, R. H. & Dickinson, R. G. (1976) Br. J. Psychol. 67, 537–552. 11. Blakemore, C., Carpenter, R. H. S. & Georgeson, M. A. (1970) Nature 228, 37–39.
3. Weintraub, D. J. & Krantz, D. H. (1971) Percept. Psychophys. 10, 257–264. 12. Burns, B. D. & Pritchard, R. (1971) J. Physiol. (London) 213, 599–616.
4. Day, R. H. (1973) Percept. Psychophys. 14, 590–596. 13. Gillam, B. (1971) Percept. Psychophys. 10, 211–216.
5. Leibowitz, H. & Toffey, S. (1966) Vision Res. 6, 101–103. 14. Gregory, R. L. (1963) Nature 199, 678–780.
6. Howe, C. Q. & Purves, D. (2002) Proc. Natl. Acad. Sci. USA 99, 13184–13188. 15. Purves, D. & Lotto, B. (2003) Why We See What We Do: An Empirical Theory
7. Huang, J., Lee, A. B. & Mumford, D. (2000) in Proceedings of IEEE Conference of Vision (Sinauer, Sunderland, MA).
on Computer Vision and Pattern Recognition (IEEE, Piscataway, NJ), Vol. 1, pp. 16. Rao, R. P. N., Olshausen, B. A. & Lewicki, M. S. (2002) Probabilistic Models
324–331. of the Brain: Perception and Neural Function (MIT Press, Cambridge, MA).
8. Howe, C. Q. & Purves. D. (2005) Proc. Natl. Acad. Sci. USA 102, 1228–1233. 17. Yang, Z. & Purves, D. (2003) Network: Comp. Neural Syst. 14, 371–390.
9. Gillam, B. (1998) in Perception and Cognition at Century’s End, ed. Hochberg, 18. Yang, Z. & Purves, D. (2003) Nat. Neurosci. 6, 632–640.
J. (Academic, New York), pp. 98–136. 19. Howe, C. Q. & Purves, D. (2004) J. Cognit. Neurosci. 16, 90–102.
Downloaded by guest on March 31, 2021
7712 兩 www.pnas.org兾cgi兾doi兾10.1073兾pnas.0502893102 Howe et al.You can also read