Astrophysics of Galaxies 2019-2020 - Lecture V: The Spectral Energy Distribution of Galaxies Star Formation Rate, Ionized ISM
←
→
Page content transcription
If your browser does not render page correctly, please read the page content below
Lecture V:
 The Spectral Energy Distribution of Galaxies
 Star Formation Rate, Ionized ISM

Astrophysics of Galaxies
2019-2020
Stefano Zibetti - INAF Osservatorio Astrofisico di Arcetri

Lecture V

Stefano Zibetti - INAF OAArcetri - Astrophysics of Galaxies - Course 2019/2020 - Lecture V

Star Formation Rate (SFR)

✤ SFR= dM*/dt

 ✤ galaxies evolve, and not only passively

✤ rely on short-lived stars to measure SFR

 ✤ if they are “observed” (directly or indirectly), they must have
 formed less than ∆t time ago
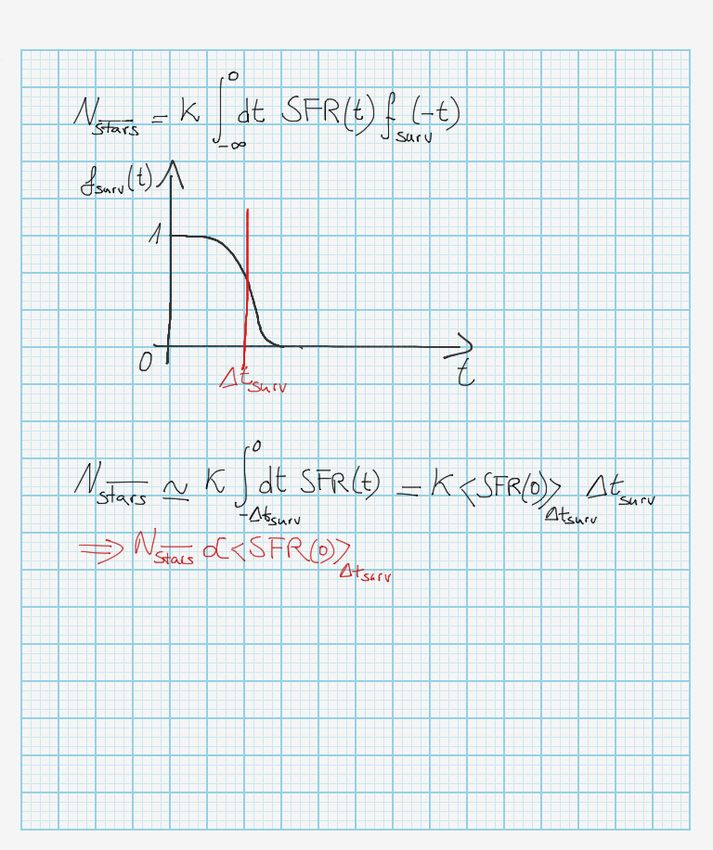
Stefano Zibetti - INAF OAArcetri - Astrophysics of Galaxies - Course 2019/2020 - Lecture V

Why short-lived stars trace SFR
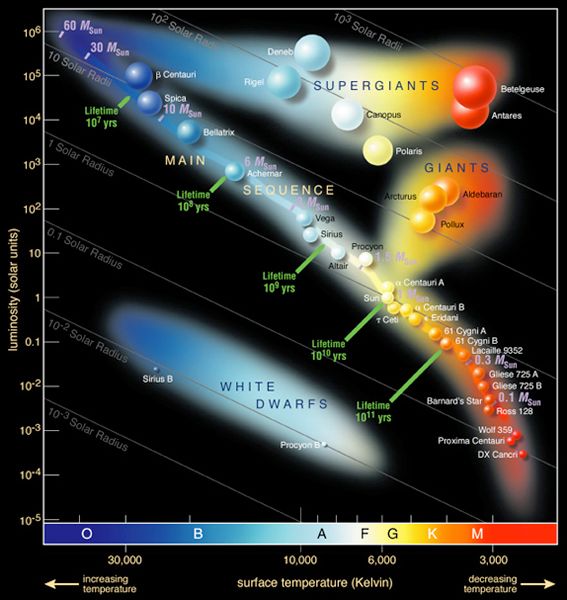
Stefano Zibetti - INAF OAArcetri - Astrophysics of Galaxies - Course 2019/2020 - Lecture V

How can we “count” short lived stars?

✤ Mass-tsurv relation

✤ Mass-Teff relation
✤ ⇒ follow the UV photons!
✤ t-M* “uncertainty
 principle”: the more
 “instantaneous” the SFR
 measurement, the largest
 the extrapolation in mass
Stefano Zibetti - INAF OAArcetri - Astrophysics of Galaxies - Course 2019/2020 - Lecture V

The fate of UV photons
✤ The highest-energy UV photons (E>13.6 eV, i.e.
 912Å) ionize the atoms in the birth clouds of
 stars, cascade down the recombination ladders
 n=7
 n=6
 ✤
 Hydrogen series (mainly Balmer, Paschen, n=5

 Brackett; Lyman is resonant, not optically n=4

 thin)
 n=3

 ✤ other nebular lines (e.g. [OII]) are excited by
 hot free electrons n=2

✤
 Lower energy UV photons escape and produce
 UV luminosity, possibly attenuated by dust
 n=1
✤
 All can heat up dust and excite ISM molecular
 emission (like PAHs)
are expected: then cooling in the O zone is dominated by collisional excitation of fine
 Stefano Zibetti - INAF OAArcetri - Astrophysics of Galaxies - Course 2019/2020 - Lecture V
 structure lines in the ground level of O++ , while the absence of fine structure lines in the
 ground level of O+ forces the temperature to rise in the outer zones (Stasińska 1980a,
 Garnett 1992).

Hydrogen recombination lines
 – For a given T⋆ , Te is generally lower at higher metallicity.
 – For a given metallicity, Te is generally lower for lower T⋆ .
 – For a given T⋆ and given metallicity, Te increases with density in regions where n is
 larger than a critical density for collisional deexcitation of the most important cooling
 lines (around 5 102 – 103 cm−3 ).
 1.3. Line intensities
✤ Ionized
 In ISM
 conditions is optically
 prevailing in PNethin
 and to
 H iinon-resonant linesemission
 regions the observed (not solines
 manyare atoms/ions
 optically excited
 thin,
 above except for resonance
 the ground lines
 state), i.e.such
 NOT as H Lyα, C ivλ1550, N vλ1240, Mg iiλ2800,
 Si ivλ1400, and some helium lines. Also the fine structure IR lines could be optically thick
✤ Intensity
 in compact ofH iihydrogen recombination
 regions or giant lines almost
 H ii regions (however, independent
 the velocity fields areof T, ~proportional to
 generally
 the number
 such that this of recombinations,
 is not the case). The hence to most
 fact that the number of used
 of the lines ionizing photons if
 for abundance
 equilibrium holds
 determinations and all
 are optically thinionizing photons
 makes their absorbed
 use robust (“case B”)
 and powerful.
✤ Dust extinction can be estimated based on recombination line ratios: the theoretical
 ratio is altered by wavelength dependent extinction; once an extinction curve is
 assumed, one just needs the extinction ratio at two different λ to get the optical depth
✤ Intrinsic line luminosity can be derived ⇒ ionizing flux
✤ SPS models provide the conversion from ionizing flux to SFR
✤ Only stars with M>10M⦿ and life-time
L’estinzione ad unaStefano
 certa Zibetti -λ può
 INAF essere
 OAArcetri - Astrophysicsscritta come
 of Galaxies - Course A(λ)
 2019/2020 =V f(λ) AV dove f(λ) è
 - Lecture

 la curva di estinzione, che dipende unicamente dalle proprietà dei grani,
 mentre AV è l’estinzione in banda V che dipende anche dalla quantità di
 Extinction from “Balmer decrement”
 polvere lungo la linea di vista.
 Spesso si utilizzano le righe dell’idrogeno (di cui si conoscono i rapporti),
 es. il “decremento di Balmer” Hα/Hβ, per stimare l’estinzione
 ef f
 L(H ) (H 0
 , Te )
 ⇥ H
 ef f
 3 per Te = 104 K
 L(H⇥) H⇥ (H 0, T )
 e
 ⇥oss ⇥em
 F (H ) F (H )
 = 10(AH⇥ AH )/2.5
 F (H⇥) F (H⇥)
 ⇥oss
 F⇤ (H )
 ⇥3 10AV [f (H⇥) f (H )]/2.5
 F⇤ (H⇥)
 data una curva di estinzione f(λ) (spesso assunta) si ricava AV
 f(λ) is the assumed extinction curve
Sunday, December 16, 12

 AV is the only left unknown
Stefano Zibetti - INAF OAArcetri - Astrophysics of Galaxies - Course 2019/2020 - Lecture V

Recombination
lines across the
 Hubble
 sequence:
 a sequence of
 SFH intensity

 Gavazzi et al. (2002)
Stefano Zibetti - INAF OAArcetri - Astrophysics of Galaxies - Course 2019/2020 - Lecture V

 The Astrophysical Journal, 734:82 (17pp), 2011 June 20 Izotov & Thuan

The plethora of
 NIR
recombination
 lines

 Figure 1. 3.5 m APO/TripleSpec NIR spectrum of II Zw 40 in five orders. In each panel, the noisy regions of the upper spectrum are omitted. They are caused by
 insufficient sensitivity or strong telluric absorption. The flux scale on the y-axis corresponds to the upper spectrum. The lower spectrum is downscaled by a factor of
 50 as compared to the upper spectrum. It is shown for the whole wavelength range in each order.
Stefano Zibetti - INAF OAArcetri - Astrophysics of Galaxies - Course 2019/2020 - Lecture V
Stefano Zibetti - INAF OAArcetri - Astrophysics of Galaxies - Course 2019/2020 - Lecture V

SFR from forbidden lines: [OII]

✤ very useful to extend to higher z but staying in the optical window

✤ forbidden lines in general are not directly coupled to ionizing
 radiation (see next slides), BUT [OII] is well behaved and can be
 calibrated empirically.

✤ metal abundance has a relatively small effect on the [OII] calibration,
 over most of the abundance range of interest (0.05 Z⊙ ≤ Z ≤ 1 Z⊙)
Stefano Zibetti - INAF OAArcetri - Astrophysics of Galaxies - Course 2019/2020 - Lecture V

 A simple model to interpret galaxy spectra 1605
 Attenuation
 DaCunha+08

 “Cirrus”
 component,
 heated by
 diffuse ISRF

 “Warm”
 component,
 directly
 heated by
 Direct UV
 xamples of spectral energy distributions obtained by combining the infrared models of Table 1 with attenuated stellar population hotspectra
 stars
 (non-ionizing, λ>912Å) µ µ
 tot
 g to the same contributions by dust in stellar birth clouds (1 − f ) and in the ambient ISM (f ) to the total energy L absorbed and reradiated by
 d
n 2.3). (a) Quiescent star-forming galaxy spectrum combined with the ‘cold’ infrared model of Table 1; (b) normal star-forming galaxy spectrum
 th the ‘standard’ infrared model of Table 1; (c) starburst galaxy spectrum combined with the ‘hot’ infrared model of Table 1 (see text for details
rameters of the stellar population models). Each panel shows the unattenuated stellar spectrum (blue line), the emission by dust in stellar birth
Stefano Zibetti - INAF OAArcetri - Astrophysics of Galaxies - Course 2019/2020 - Lecture V

SFR from UV continuum
✤ Use SPS models assuming
 ✤ IMF

 ✤ SFH: adapt to the galaxy to study

 ✤ typically constant over the time traced by the66 MEURER, HECKM
 UV bright stars
 ✤ shorter if considering a starburst

✤ Integrated spectrum 1500-2500Å dominated by stars
 M≳5 M⦿
 ✤ timescale ~108 yr

 ✤ substantial extrapolation to total mass

✤ Large sensitivity to dust extinction, typically 0-3
 mag, but can be much much more for dusty
 starburst!
 ✤ β-A
 UV relation: empirically calibrated via IRX,
 assuming all IR is re-radiated flux missing from
 the UV (Meurer, Heckman & Calzetti 1999)

 FIG. 1.ÈRatio of FIR to UV Ñux at 1600 A! compared to UV spectral
Stefano Zibetti - INAF OAArcetri - Astrophysics of Galaxies - Course 2019/2020 - Lecture V

SFR from IR continuum
✤ Total IR luminosity LTIR is a good proxy
 for SFR as long as

 1994ApJ...429..582C
 ✤ most of the UV photons are absorbed
 and re-radiated by dust

 ✤ dust heating is predominantly done by
 young hot stars

 ✤ note that the absorption cross
 section of dust increases at shorter λ

 Calzetti, Kinney & Storchi-Bergmann (1994)
Stefano Zibetti - INAF OAArcetri - Astrophysics of Galaxies - Course 2019/2020 - Lecture V

Proxies to TIR
(and SFR)

 1964
 Figure 5. Relation between observed 24 µm infrared luminosity and observed

 M. Galametz et al.
 Kennicutt+09
 Hα luminosity (uncorrected for attenuation) for galaxies in the SINGS and
 MK06 samples. Symbol shapes are coded by dominant emission-line spectral
 type: circles for H ii region like spectra, crosses for spectra with strong AGN
 signatures, and crossed circles for galaxies with composite spectra. The solid
 line shows a relationship with linear slope, to illustrate the strong nonlinearity
 in the observed relation. The axis label at the top of the diagram shows the
 approximate range of SFRs (absent a correction for dust attenuation at Hα) for
 reference.

 calibrations as functions of various properties of the galaxies
 and their SEDs.
 4.1. Combinations of Hα and 24 µm Measurements
 As an introduction, it is instructive to compare the consis-
 tency of Hα and IR SFR measures before any corrections for
 attenuation are applied. Figure 5 compares the observed Hα
 Galametz+13
 luminosities of the SINGS and MK06 galaxies with their corre-
 sponding 24 µm (νfν ) luminosities. When converting fluxes to
 coded by 12+log(O/H)
 luminosities, we have used distances listed for SINGS galaxies
 in Table 1, and from MK06 in Table 2. Both sets of distances
 assume H = 70 km s−1 Mpc−1 with local flow corrections.
Stefano Zibetti - INAF OAArcetri - Astrophysics of Galaxies - Course 2019/2020 - Lecture V
 878 CALZETTI ET AL. Vol. 666

 Mid IR: PAHs and hot dust
 A simple model to interpret galax
 ✤ Dominated by hot dust and PAH DaCunha+08

 emission, excited by soft UV (see e.g.
 Draine+07) Fig. 3.— (a) LSD at 8 !m, S8 !m;dust , as a function of the extinction-corrected LSD at Pa", SPa" ;corr , for the 220 H ii knots in the 33 galaxies for which photometric
 measurements have been obtained. LSDs are averaged over 1300 photometric apertures. The 8 !m emission is stellar continuum subtracted (x 3.1). Data points are
 divided into three metallicity bins: high (red filled triangles), intermediate ( green stars), and low (blue asterisks) oxygen abundance (x 2). Filled black squares mark the

 PAH luminosity: dependence on
 local starbursts from the sample of Engelbracht et al. (2005) (x 5.1). The 3 # error bars are indicated for each data point. Open black stars indicate the location of the
 ✤ nonthermal sources (Seyfert 2s or LINERs; x 4.1), and open black circles indicate extended background sources. The best-fit line through the high-metallicity (red ) data
 points is shown as a solid line, while the dashed line is the linear fit through the same data points with fixed slope of 1. (b) Histogram of the deviation of the H ii knot data
 in panel a from the best-fit line through the high-metallicity data (the solid line in panel a). The values of the best-fit coefficients are c ¼ 0:94 " 0:02 and d ¼

 metallicity 4:80 " 0:85 (eq. [2]). Three separate histograms are shown, for high- (red ), intermediate- (green), and low-metallicity (blue) data. The intermediate- and low-metallicity
 histograms have been multiplied by a factor of 2 to make them visible.

 ✤ 8%m must be decontaminated from 4.2. Uncertainties in the Photometric Measurements tial misregistration of the multiwavelength images. The vari-
 ance on the image background is derived in each case from the
 The uncertainties assigned to the photometric values at each original-pixel-size images. The impact of potential background
 stellar continuum wavelength and for each galaxy are the quadrature combination
 of four contributions: Poisson noise, variance of the background,
 under- or oversubtractions varies from galaxy to galaxy and also
 depends on the relative brightness of the background and the
 photometric calibration uncertainties, and variations from poten- sources. The effect of potential misregistrations has been evaluated
878 CALZETTI ET AL. Vol. 666

 Figure 5. Examples of spectral energy distributions obtained by combining the infrared models of Table 1 with attenuated
 corresponding to the same contributions by dust in stellar birth clouds (1 − f µ ) and in the ambient ISM (f µ ) to the total energy Ldtot
 dust (Section 2.3). (a) Quiescent star-forming galaxy spectrum combined with the ‘cold’ infrared model of Table 1; (b) normal sta
 Calzetti+07
 Fig. 3.— (a) LSD at 8 !m, S8 !m;dust , as a function of the extinction-corrected LSD at Pa", SPa" ;corr , for the 220 H ii knotscombined
measurements have been obtained. LSDs are averaged over 1300 photometric apertures.
 Fig.
 Herrero
 4.—Same
 The
 d ¼ and
 et al.
 #6:88
 8 !m
 as
 (2006)
 Fig. 3, but for the
 (blackisasterisks;
 emission
 LSD inatthe
 stellar continuum
 !m,
 2433

 about(xthe
 S24with
 galaxies
 x 5.2). Thesubtracted
 values of (x
 In the
 !m . for

 parameters
 ‘standard’
 addition
 which
 the3.1).
 photometric
 parameters (c, d )are
 Data points
 ofmark
 infrared
 to the same data points asmodel of Table
 Fig. 3, panel 1; (c)
 a also reports the starburst galaxy
 LIRGs from the sample spectrum
 of Alonso- combined with the ‘hot’ infrared model of
 in the horizontal axis of panel b are given in eq. (3) and are c ¼ 1:23 " 0:03 and
 thethestellar population models). Each panel shows the unattenuated stellar spectrum (blue line), the emis
divided into three metallicity bins: high (red filled triangles), intermediate ( green stars), low"(blue
 0:97.asterisks) oxygen abundance 2). Filled black squares
local starbursts from the sample of Engelbracht et al. (2005) (x 5.1). The 3 # error bars are indicated for each data point. Open clouds (green
 black stars line),
 indicate the emission
 the location of the by dust in the ambient ISM (red line) and the total emission from the galaxy, corresponding to the s
nonthermal sources (Seyfert 2s or LINERs; x 4.1), and open black circles indicate extended background sources. The best-fit line through the high-metallicity (red ) data
 spectrum
points is shown as a solid line, while the dashed line is the linear fit through the same data points with fixed slope of 1. (b) Histogram and theof total
 of the deviation the H iiinfrared
 knot data emission (black line).
Stefano Zibetti - INAF OAArcetri - Astrophysics of Galaxies - Course 2019/2020 - Lecture V

FIR-radio
correlation

 de Jong+1985; Helou+1985: GHz vs. 60µm or FIR
 ✤ LFIR∝SFR, FIR-radio correlation ⇒ LGHz∝SFR : why??
 ✤ GHz is synchrotron, i.e. relativistic CR electrons + magnetic field
 ✤ CR electrons are produced in SN explosions
 ✤ “Electron Calorimeter” theory: synchrotron cooling timescale shorter
 than the escape time: tsynch
otropically, whereas the UV light escapes along preferred di-
 Stefano Zibetti - INAF OAArcetri - Astrophysics of Galaxies - Course 2019/2020 - Lecture V

ctions (such as out of the plane of a disk galaxy). Future works
 ll be able to address point 1 through more detailed model-
 Bolometric SFR indicators: UV-IR
g of UV/optical / IR SEDs and will be able to ascertain to what
 tent averaging over inclination angles effectively addresses
 int 2.
 In practice, we estimate the SFR using a calibration de-
ved from the PEGASE stellar population models (see Fioc &
 ✤ Combine emerging UV flux with flux re-emitted in the IR by the dust
occa-Volmerange 1997 for a description of an earlier version
 the model), assuming a 100 Myr old stellar population with
 nstant SFR and a Kroupa (2001) IMF:
 ✤ Bell+05:

 ¼ 9:8 ; 10$11 (LIR þ 2:2LUV ); ð1Þ
 M# yr$1
here LIR is the total IR luminosity and LUV ¼ 1:5#l#;2800 is a
ugh estimate of the total integrated 1216–3000 8 UV lumi-
 sity, derived using the 2800 8 rest-frame luminosity l#;2800
om COMBO-17. The factor of 1.5 in the 2800 8–to–total UV
 nversion accounts for the UV spectral shape of a 100 Myr old
 pulation with constant SFR. The SFR is derived assuming
at LIR reflects the bolometric luminosity of young, completely
 scured populations and that LUV reflects the contribution of
Stefano Zibetti - INAF OAArcetri - Astrophysics of Galaxies - Course 2019/2020 - Lecture V

SFR indicators

✤ Look up most updated references!

✤ Main review Kennicutt ARAA 1998

✤ Calzetti+07: mid-IR

✤ Calzetti+10: monochromatic FIR
Stefano Zibetti - INAF OAArcetri - Astrophysics of Galaxies - Course 2019/2020 - Lecture V

Properties of the ionized gas

✤ See Osterbrock (1989)! Also review by Stasinska (2002, arXiv:astro-
 ph/0207500) - Dopita & Sutherland “Astrophysics of the Diffuse
 Universe”
✤ Key quantities:
 ✤ T
 e
 ✤ n
 e
 ✤ abundances

✤ Key processes:
 ✤ photon excitation and ionization

 ✤ collisional excitation and de-excitation (electrons on atoms/ions)

 ✤ recombination

 ✤ radiative de-excitation
ijl
 If the Stefano
 density is sufficiently high, some collisional deexcitation may occur and cooling
 Zibetti - INAF OAArcetri - Astrophysics of Galaxies - Course 2019/2020 - Lecture V

 is reduced. In the two-level approach one has:
 Lijl = n e n(X j
 )ne qijlhνijl (1/(1 + ne (q12 + q21 )/A21 ). (1.20)

Ionized gas diagnostics
 coll i
 So, in a first approximation, one can write that the electron temperature is determined
 by
 ! ijl
 G=L= Lcoll , (1.21)
 ijl

 where G is given by Eq. (1.18) and Lijl coll by Eq. (1.20).
 The following properties of the electron temperature are a consequence of the above
 equations:
 – Te is expected to be usually rather uniform in nebulae, its variations are mostly
✤ Ionized ISM is optically thin to non-resonant lines (not so many
 determined by the mean energy of the absorbed stellar photons, and by the populations
 atoms/ions excited
 of the above
 main cooling ions. the ground
 It is only state) (over solar) that large Te gradients
 at high metallicities
 are expected: then cooling in the O++ zone is dominated by collisional excitation of fine
 structure lines in the ground level of O++ , while the absence of fine structure lines in the
✤ Intensity of recombination
 ground level of O+ forceslines almost to
 the temperature independent
 rise in the outer of T,(Stasińska 1980a,
 zones
 Garnett
 proportional 1992).number of recombinations, hence of ionizing
 to the
 – For a given T⋆ , Te is generally lower at higher metallicity.
 photons if equilibrium holdsTe is generally lower for lower T⋆ .
 – For a given metallicity,
 – For a given T⋆ and given metallicity, Te increases with density in regions where n is
 larger than a critical density for collisional deexcitation of the most important cooling
✤ Intensity of collisionally
 lines (around 5 102 – excited
 103 cm−3 ).lines depends on T and n
 1.3. Line intensities
✤ Resonant lines haveprevailing
 In conditions very complicated behavior:
 in PNe and H ii regions the observed emission lines are optically
 thin, except for resonance lines such as H Lyα, C ivλ1550, N vλ1240, Mg iiλ2800,
 Si ivλ1400, and some helium lines. Also the fine structure IR lines could be optically thick
 in compact H ii regions or giant H ii regions (however, the velocity fields are generally
Stefano Zibetti - INAF OAArcetri - Astrophysics of Galaxies - Course 2019/2020 - Lecture V

Gas (metallicity) diagnostics
✤ Use collisionally excited lines of atoms/ions of given element

 ✤ O is the most popular, in fact estimates of gas metallicity are often given as
 12+log(O/H), with solar [O/H] being 8.69

 ✤ Forbidden lines: opposite to photon excited levels, collisionally excited
 levels do not require to follow the quantum selection rules relative to the
 ground state

✤ Dependence on density and temperature, not only element/ion abundance!

✤ “Direct” measurements require many lines, not always available for moderate
 SNR spectra

✤ Revert to indirect methods or “strong line methods”
Stefano Zibetti - INAF OAArcetri - Astrophysics of Galaxies - Course 2019/2020 - Lecture V

 5.1.4 Two- and three level At
Key concepts of collisionally excited lines As a result of very low density and weak
 atoms of any particular element and ioni
(see e.g. Dopita & Sutherland’s
5.1.4 Two- and three level Atomsbook) excited states are populated
 Page 27 through col

As a result of very low density and weak radiation fields,
 (From theDopita
 vast majority of the
 & Sutherland, Astrophysic
atoms of any particular element and ionization state reside in the ground state and the
excited states are populated through collisions with electrons.
✤ Excitation rate depend on cross
(From Dopita & Sutherland, Astrophysics of the Diffuse Universe)
 section
 Cross Section:
✤ Cross sections depends on the h2 12
 12 ( E ) , 12 21
 energy of the exciting electron 8 me E g1
 (see figure)
 Energy distribution of the electrons
✤ Energy of the electrons depends(with mean density n e ):
 on temperature, following the 2ne 1/ 2 E
 Maxwell-Boltzmann distributionf (E) 1/ 2 3/ 2
 E exp dE
 (kT )
 Collisional Rate R 12kT ne N1 12 C12 N1
Collisional Rate R 12 ne N1 12 C12 N1 :
 2E 2 4
 1/ 2
 E 2E
R12 ne N1 12 ( E ) f ( E )dE ne N1 TR121/ 2 ne12N1exp 12 (12E ) f ( E )dE ne N
 E12
 me kme3 g1 E12 kT me
 v
Stefano Zibetti - INAF OAArcetri - Astrophysics of Galaxies - Course 2019/2020 - Lecture V

 Page 28
Line emission of the two-level Atom
Low density limit: R12 C12 N1 N 2 A21 equilibrium set by radiative de-excitation rate
 1/ 2
 4
 12 2 1 1/ 2 12 E12
N2 ne N1 ne N1 A T
 21 exp
 A21 kme3 g1 kT
Emission line flux:
 1/ 2
 4
 2 2 1/ 2 12 E12
F12 E12 A21 N 2 n
 i e E12T exp
 kme3 g1 kT
where i =N i /n e is the relative abundance of the ion i considered.
For low temperatures the exponential term dominates because few
electrons have energy above the threshold for collisional excitation, therefore
the line rapidly fades with decreasing temperature. At high temperatures
the T -1/2 term controls the cooling rate, so the line fades slowly with temperature.
The maximum line flux is reached at T=E12 / k .
To measure abundances i one needs to know n e and Te .

IMPRS Astrophysics Introductory Course (credits to Ralf Bender et al.) Fall 2009
Stefano Zibetti - INAF OAArcetri - Astrophysics of Galaxies - Course 2019/2020 - Lecture V
 Page 29
Line emission of the two-level Atom
 High density limit : Boltzmann equilibrium (LTE)
 N2 g2 E12
 exp
 N1 g1 kT
 Emission line flux:
 g2 E12
 F12 E12 A21 N 2 i E12 A21 ne exp
 g1 kT
 Note that the line flux scales with n e and it tends to a constant value
 at high temperatures.
 Critical density where A 21 R12 :
 1/ 2 1/ 2
 4
 A21 g 2T 2
 ncrit 3
 (see derivation in next slide!)
 12 kme
 In a log n e -log F plot the slope changes from 2 to 1 at this density.

IMPRS Astrophysics Introductory Course (credits to Ralf Bender et al.) Fall 2009
2 e 1 e 1 3 21
 A21 km g1
 Stefano Zibetti - INAF OAArcetri - Astrophysics of Galaxies - Course 2019/2020 - Lecture V

 e kT
 N 2 limit
 High density g 2 : Boltzmann
 E12 equilibrium (LTE)
Emission line flux:exp
Low density N1 g1 kT
 N2 g2 E212 4 1/ 2
 E12
 exp
 Emission
F12 E12 A21 N 2 n 2
 line flux:
 E T 1/ 2 12
 exp
 N1 g1 i e
 kTkme3 12
 g1 kT
 g2 E12
 Emission
where /n12line
 i =N iF e is Eflux:
 12 A21 N 2
 the i E12 A21 ne
 relative abundance
 = exp
 of the ion
 g1
 i considered.
For low temperatures the exponential term dominates because few
 F12 Ehave Note that the line flux g
 scales
 2 with
 forexp n E
 kT
 and
 12 it ten
electrons 12 A21 N 2 above
 energy i E12 A21threshold
 the ne collisional
 e excitatio
the line at
 rapidly high
 fades temperatures. g1 kT
 with decreasing temperature. At high tempe
High density
 Note
 -1/2 that the line flux scales with n
the T termCritical
 controlsdensity where
 the cooling rate,Aso e and
 21 theRline
 12
 it slowly
 : fades tends wt
 at high temperatures.
The maximum line flux is reached
 1/ 2
 2
 at T=E
 4 /
 1/k2.
 A21 g 2T
 12
 ncrit
To measure abundances i one needs to3know n e and Te .
 Critical density where12
 A 21 kmRe12
 :
 In a log 1/ n
 2 -log F plot 1/ 2 slope changes from 2
 the
 Course 4
 A gT
 IMPRS Astrophysics Introductory
 e 2
Stefano Zibetti - INAF OAArcetri - Astrophysics of Galaxies - Course 2019/2020 - Lecture V

 Page 30
Three-level Atoms, Ions with E 23 E12

Low density limit: C12 N1 N 2 A21 , C13 N1 N 3 A31 Examples:
 [OII]3726,3729
 F31 E31 A31 N 3 E31C13 31 E23 g3 [SII]6731,6716
Flux ratio: exp
 F21 E21 A21 N 2 E21C12 21 kT g2 [ArIV]4740,4711
High density limit: Boltzman ratio N 3 / N 2 g3 / g 2
 Only if
 F31 A31 g3 ~1
Flux ratio: DENSITY INDICATOR E23/kT
 F21 A21 g 2 is small!
 IMPRS Astrophysics Introductory Course (credits to Ralf Bender et al.) Fall 2009
Stefano Zibetti - INAF OAArcetri - Astrophysics of Galaxies - Course 2019/2020 - Lecture V

Key points for ne determinations

✤ Same “ground” level of the same ion: remove the i dependence

✤ E32
Stefano Zibetti - INAF OAArcetri - Astrophysics of Galaxies - Course 2019/2020 - Lecture V

 Page 28
 Line emission of the two-level Atom
Focus onlimit:Temperature
 Low density R C N N A 12 12 1
 1/ 2
 2 21

 4
 12 2 1 1/ 2 12 E12
 N2 ne N1 ne N1 A T
 21 exp Page 29
 A21 kme3 g1 kT
Line emission of the two-level Atom
✤ LowEmission
 density:line flux:
 High density limit : Boltzmann
 4
 1/ 2 equilibrium (LTE)
 2 2 1/ 2 12 E12
 FN
 122 E12
 g 2A21 N 2 En i e
 12
 E12T exp
 exp kme3 g1 kT
 N1 g1 kT
 where i =N i /n e is the relative abundance of the ion i considered.
✤ High density:
 Emission line flux:
 For low temperatures the exponential term dominates because few
 electrons have energy above thegthreshold
 2 E12collisional excitation, therefore
 for
 F12 E12 A21 N 2 i E12 A21 ne exp
 the line rapidly fades with decreasingg1 kT
 temperature. At high temperatures
 Note
 the thatterm
 T -1/2 the controls
 line fluxthescales withrate,
 cooling n e so
 andthe
 it line
 tendsfades
 to aslowly
 constant value
 with temperature.
 at high
 The temperatures.
 maximum line flux is reached at T=E12 / k .
 Critical
 To density
 measure where A 21
 abundances i oneR :
 needs
 12 to know n e and Te .
 1/ 2 1/ 2
 4
 A21 g 2T 2
 nIMPRS
 crit Astrophysics Introductory Course
 3
 Fall 2009
 12 kme
Stefano Zibetti - INAF OAArcetri - Astrophysics of Galaxies - Course 2019/2020 - Lecture V
 Page 31
 Three-level Atoms, Ions with E12 E 23

 4363

 (2321) Page 28
Line emission of the two-level Atom
Low density limit: R12 C12 N1 N 2 A21

N2 ne N1 12
 ne N1
 2 4
 1/ 2

 A211T 1/ 2 12
 5007/4959
 exp
 E12
 A21 kme3 g1 kT
Emission line flux: Examples:
 1/ 2

F12 E12 A21 N 2 n2
 i e
 2 4
 E12T 1/ 2 12
 exp
 E12 [OIII]4363,5007/4959
 kme3 g1 kT
Low [NII]5755,6583/6548
where idensities: F32of the ion
 =N i /n e is the relative abundance E32i considered.
 C13 A32 [SIII]6312,9532/9069
N
ForC N 3 ( A32the exponential
 low temperatures A31 ) termF21dominates
 E21because
 C12 A few
 1 13 31
 electrons have energy above the threshold for collisional excitation, therefore F32 E32 A32 13 E32
Nthe1C N A N A Flux ratio: exp
 line
 12 rapidly fades
 3 32 with decreasing
 2 21 C
 temperature. At high E
 temperatures
 13 23 13 F21 E21 A31 kT
 -1/2 exp 12
Nthe1 T Nterm
 2
 controls the cooling rate, so the line fades slowly with temperature.
 N3 1 C kT
 The maximum line flux is reached at T=E12/ k . 12
 12
Normalization
To measure abundances i one needs to know n e and Te . TEMPERATURE INDICATOR
Equilibrium: same total transition rates from/to levels
 IMPRS Astrophysics Introductory Course Fall 2009
 IMPRS Astrophysics Introductory Course (credits to Ralf Bender et al.) Fall 2009
Stefano Zibetti - INAF OAArcetri - Astrophysics of Galaxies - Course 2019/2020 - Lecture V

Key points for Te determinations

✤ Same “ground” level of the same ion: remove the i dependence

✤ E32~E21:

 ✤ C13
Stefano Zibetti - INAF OAArcetri - Astrophysics of Galaxies - Course 2019/2020 - Lecture V

“Strong line
methods”

✤ ne, T, abundance and extinction require 4 independent line ratios
 (sensitive to these quantities!)
✤ only 4 strong lines typically well measured (Pagel 1979): Hα, Hβ,
 [OII] λ3727 and [OIII] λ5007 ⇒ 3 independent line ratios

✤ Hβ/Hα Balmer decrement ⇒ extinction

✤ empirical dependence of T (and ne) on metallicity
✤ Alternatively: simultaneous fit of several lines based on
 photoionization models (e.g. Tremonti et al. 2004)
Stefano Zibetti - INAF OAArcetri - Astrophysics of Galaxies - Course 2019/2020 - Lecture V

 R23 method
 G THE R23 DEGENERACY

 R23
y on the= (½O ii" k3727 þ ½O iii" kk4959; 5007)/H! line
with metallicity; R23 gives both a low metallicity estima
 (for
 ✤
 a branches,
 Two discussion see, e.g., KK04). Additional line ratio
 high and
 low Z
 ✤ Requires calibration using

 s ( Izotov et al. 2004, 2006a; Kniazev et al. 2003, 20
 direct methods
limited emission-line surveys because they are intrinsi
 ✤ needs a rough estimate of

 metallicity to choose the
 van Zee 2000). For the purpose of investigating the u
 branch! other Z-sensitive
metallicity galaxy sample described in Kewley et al. (20
 line ratios must be
 axy sample.
 adopted (see Kewley &
 Ellison 2008)
n [ N ii]/ H " or [ N ii]/[O ii] metallicity calibration becau
ed on [N ii]/H" or [N ii]/[O ii] and the calibration base
ranch of R . For example, an [ N ii]/H" metallicity c
1981PASP...93....5
 Stefano Zibetti - INAF OAArcetri - Astrophysics of Galaxies - Course 2019/2020 - Lecture V

 (1981)

BPT
diagram(s)
 power law
 PNe

✤ Insensitive to
 reddening and
 absolute flux HII regions shock
 calibration
 [OIII]/Hβ

✤ Insight into
 heating
 mechanisms

 [NII]/Hα
Stefano Zibetti - INAF OAArcetri - Astrophysics of Galaxies - Course 2019/2020 - Lecture V

The physics of BPT diagrams
✤ Metallicity [O/H] ✤ Shape of the spectrum (“hardness”)

✤ Ionization parameter of the radiation
 field: density of ionizing photons (Lyman H + IE → H+ + e− IE = 13.6 eV
 N + IE → N+ + e− IE = 14.5341 eV
 continuum) over electron density O + IE → O+ + e− IE = 13.6181 eV
 O+ + IE → O++ + e− IE = 35.1185 eV

 0-age SSP [O/H] ➘ 4Myr continuous
 u

 Sánchez+2015, CALIFA
Stefano Zibetti - INAF OAArcetri - Astrophysics of Galaxies - Course 2019/2020 - Lecture V

The physics of BPT diagrams
✤ Metallicity [O/H]

✤ Electron density: increases rate of ✤ Dust extinction
 collisional excitation

 0-age SSP 0-age SSP, fixed Ne

 [O/H] ➘ [O/H] ➘

 Sánchez+2015, CALIFA
Stefano Zibetti - INAF OAArcetri - Astrophysics of Galaxies - Course 2019/2020 - Lecture V

 Sánchez+2015, CALIFA
galaxies fall into one of two categories: (1) galaxi
 Stefano Zibetti - INAF OAArcetri - Astrophysics of Galaxies - Course 2019/2020 - Lecture V

< 0.73/[log([O I]/Hα) + 0.59] + 1.33. (3) Seyfert region in either the [S II]/Hα or the [O I]/Hα
 the LINER region in the remaining ([O I]/Hα or [S
te galaxies lie between the Ka03 and Ke01 classifi-
 BPT diagrams
 he [N II]/Hα versus [O III]/Hβ diagram:
/Hα) − 0.05] + 1.3 < log([O III]/Hβ), (4)
 or (2) galaxies that lie in the composite region (belo
 in the [N II]/Hα diagram but that lie above the Ke
 the [S II]/Hα or the [O I]/Hα diagram.
 According to this scheme, our 85 224-galaxy
/Hα) − 0.47] + 1.19 > log([O III]/Hβ). (5)
 63 893 (75 per cent) star-forming galaxies, 24
alaxies lie above theline
 ✤ Emission Ke01classification
 classification line of
 on the
 galaxies: the role
 Seyferts, 6005of
 (7 the AGN!
 per cent) LINERs, and 5870 (7
Hα,✤and [O I]/Hα diagnostic diagrams and above the posites. The remaining galaxies are ambiguous
 T-Z sequence for HII galaxies in
line on the [S II]/Hα and [O I]/Hα diagrams, that is,
 [NII] BPT
 8 per cent).
 ✤ Radiation “hardness” and shocks diagnostics to the right of the line
 1.5 (a) (c)
 AGN Seyfert Seyfert
 1.0
 LOG ([OIII]/Hβ)

 0.5

 0.0 LINER
 HII HII LINER

 -0.5

 -1.0 Comp

 -2.0 -1.5 -1.0 -0.5 0.0 0.5 -1.0 -0.5 0.0 0.5 -2.0 -1.5 -1.0 -0.5 0.0
 LOG ([NII]/Hα) LOG ([SII]/Hα) LOG ([OI]/Hα)
 Kewley et al. (2006) [also Kauffmann et al. 2003]
Stefano Zibetti - INAF OAArcetri - Astrophysics of Galaxies - Course 2019/2020 - Lecture V

Emission lines from AGN

✤ Type I:

 ✤ Broad permitted lines directly from
 BLRs (Balmer lines, MgII, CIV, Lyα)

 ✤ FWHM>2000 km/s

 ✤ Narrow forbidden lines from NLRs
 ([OIII], [NII], [OII] etc.)

✤ Type II:

 ✤ narrow permitted and forbidden lines,
 FWHM ~ several 100 km/s

✤ Possible mixing with emission from HII
 regions and diffuse ionized gas
You can also read