ALTIUM HALF YEAR INVESTOR PRESENTATION - Outstanding Performance Across All Key Metrics 24% Revenue Growth 58% Profit Growth
←
→
Page content transcription
If your browser does not render page correctly, please read the page content below
Outstanding Performance
Across All Key Metrics

24% Revenue Growth
58% Profit Growth

ALTIUM HALF YEAR
INVESTOR PRESENTATION
Aram Mirkazemi CEO
Joe Bedewi CFO          18– 22 February 2019
Kim Besharati VP IR     Sydney & Melbourne
Martin Ive VP Finance
Disclaimer

                                                                                Future performance - Forward looking statements, opinions and estimates provided
This presentation has been prepared by Altium Limited (ACN 009 568 772)
                                                                                in this presentation are based on assumptions and contingencies which are subject
and is for information purposes only. It does not constitute financial
                                                                                to change without notice, as are statements about market and industry trends,
product or investment advice or a recommendation to acquire Altium
shares and has been prepared without taking into account the objectives,        which are based on interpretations of current market conditions. Forward looking
financial situation or needs of individuals. Before making an investment        statements including projections, guidance on future earnings and estimates are
decision prospective investors should consider the appropriateness of the       provided as a general guide only and should not be relied upon as an indication or
information having regard to their own objectives, financial situation and      guarantee of future performance.      An investment in Altium shares is subject to
needs and seek legal and taxation advice appropriate to their jurisdiction.     investment and other known and unknown risks, some of which are beyond the
Altium is not licensed to provide financial product advice in respect of        control of Altium Limited. No representation or warranty, express or implied, is
Altium shares.                                                                  made as to the fairness, accuracy, completeness or correctness of the information,
                                                                                opinions and conclusions contained in this presentation. To the maximum extent
                                                                                permitted by law, none of Altium employees, its directors, employees or agents, nor
Altium, Altium Designer, Altium Vault, Ciiva, CircuitMaker, CircuitStudio,
                                                                                any other person accepts any liability, including, without limitation, any liability
Octopart, PCBWorks, Protel, TASKING, NEXUS, PCB:NG and Upverter, and
                                                                                arising out of fault or negligence, for any loss arising from the use of the information
their respective logos, are trademarks or registered trademarks of Altium
                                                                                contained in this presentation. In particular, no representation or warranty, express
Limited, or its subsidiaries. All other registered or unregistered trademarks
mentioned in this presentation are the property of their respective owners,     or implied is given as to the accuracy, completeness or correctness, likelihood of
and no trademark rights to the same are claimed                                 achievement or reasonableness of any forecasts, prospects or returns contained in
                                                                                this Presentation nor is any obligation assumed to update such information. Such
                                                                                forecasts, prospects or returns are by their nature subject to significant uncertainties
  Financial data                                                                and contingencies. Before making an investment decision, you should consider, with
  All dollar values are in US dollars (US$) unless as otherwise                 or without the assistance of a financial adviser, whether an investment is
  presented.                                                                    appropriate in light of your particular investment needs, objectives and financial
                                                                                circumstances.
                                                                                                                                                                       2
Agenda

    1    Company Highlights & Significant Achievements

    2    2019 Half Year Financial Performance & Metrics

    3    Driving Forces, Market Opportunity & Industry Transformation

    4    Appendix: Company Overview
Altium's Half Year FY19 Financial Highlights

$140M
                                                                                                 $140.2M               Strong revenue growth of 24%
$120M
                                                                                                                       Record EBITDA Margin of 36.3%
                                                                                                                       (36.7% underlying)
                                                                                  $110.9M
$100M
                                                                                                                       Strong net profit growth of 58%
                                                                                                         24%
                                                                                                          H1
                                                                   $93.6M
$80M
                                                                                                                       9% increase in subscriber base
                                                                                         30%                           to 39,179
                                                   $80.2M                                   H1
                                                                                                           $78.1M
                                  $71.0M                                    14%                                        34% increase in Altium Designer
$60M
                 $61.9M                                     13%
                                                                            H1               $63.2M                    seats with 3,544 new licenses sold
                                                              H1
                          11%              16%
         10%
$40M      H1               H1
                                            H1                               $48.7M
                                                              $42.6M
                                                                                                                       H1 Revenue
                                            $37.6M                                                             36.3%
$20M
        $48,34
            $29.0M          $32.3M                                                                                     Full Year Revenue
        2                                                                                        30.0%
                                              26.7%             25.0%            25.8%                                 H1 Revenue growth
               9.6%          18.4%
 $0M                                                                                                                   H1 EBITDA Margin

         H1 FY            H1 FY            H1 FY            H1 FY           H1 FY        H1 FY           H1 FY
         2013             2014             2015             2016            2017         2018            2019
                                                                                                                                                            4
Driving Performance from a Position of Financial Strength

      Altium’s H1 FY19 Financial Metrics

        $58M           A16c                                                                       18c
        Cash
                                                                   $75.9M Sales
                     Dividend                                                                     EPS
        (Up 11%)    (Up by 23%)          39,179                           (Up 26%)
                                                                                               (Up by 57%)

                                    Subscribers
        $78.1M Revenue                   (Up by 9%)             A$3.5B                  36.3%
             (Up by 24%)                                      Market Cap             EBITDA Margin
                                                                                      (Up from 30%)

         Debt       $26.8M Op Cash Flow                 3,544                    $28.4M          $23.4M
         Free              (Up by 80%)            Altium Designer seats          EBITDA           NPAT
                                                                                 (Up 49%)        (Up 58%)
                                                        (Up 34%)

                                                                                                             5
Progress Update - First Half Significant Achievements

     Core PCB delivered 17% revenue growth – with all regions and business segments delivering
     double-digit revenue growth

     Record growth in China – with 49% revenue growth and opening an office in Beijing in the 2nd
     half (in addition to Shanghai and Shenzhen)

     Octopart continued to outperform - through increased traffic and improved search experience
     delivering 80% revenue growth

     TASKING delivered 35% revenue growth – leveraging its relationship with semi-conductor
     manufacturer Infineon as the preferred supplier of the Aurix chip set to the automotive industry

     Released Altium Designer 19 – delivering further improvement in performance and reliability
     and introducing new and enhanced capabilities

     Introduction of Altium 365 - a cloud-based platform that provides PCB designers with the most
     connected and convenient experience for electronics design and development
                                                                                                    6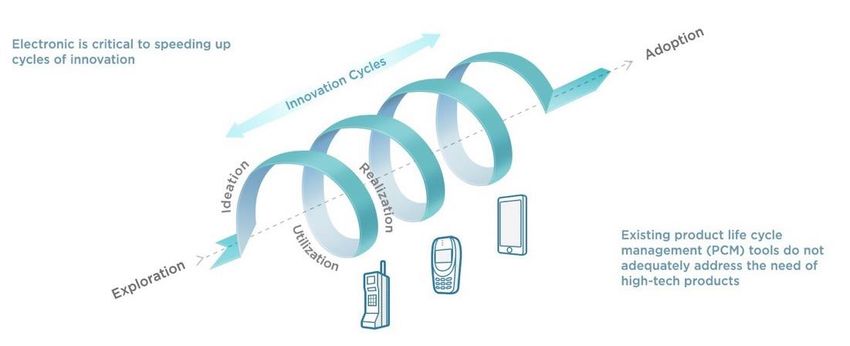
On Track to Achieve Market Leadership by 2020

                          2020 Target Revenue Breakdown
            Octopart

                                       9 - 10%
      TASKING                                                                    BSD - Americas

                             9 -10%
                                                                30 - 32%

                                                $200M
                                                 Revenue                                                                                                  2025
                        8 - 10%
  NEXUS                                          35% +                                                                                2020
                                         EBITDA Margin
                                                                                                                    2017
                            8 -10%

                                                           25 - 27%                               2015

                                      10 -12%
BSD – Rest of World
                                                                                                                                    PCB Market
                                                                           BSD - EMEA      Strong Strategy,    $100 + Million      Leadership &      Transforming
          BSD – China                                                                    Leading Technology Revenue & Expansion     Laying the     Electronic Design
                                                                                              & Revenue          of Market        Foundation for   and its Realization
                                                                                             Momentum           Opportunity          Industry
   BSD – Board and Systems Division (accounts for all PCB products excluding NEXUS)                                               Transformation

                                                                                                                                                                         7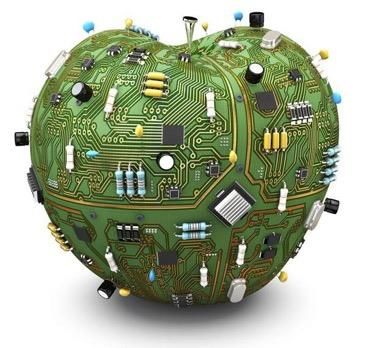
Laying the Foundation to Scale to 100,000 Subscribers

  Altium has started implementing the following initiatives:

       Scaling in China - Aggressively expanding operations in China and transitioning from
       perpetual to terms-based licensing

       Scaling in US - Establishing a global center in Dallas for customer intelligence and data
       analytics and moving away from commission-based sales in the US

       Investing in Next Gen Marketing – Scaling Altium’s unique content-driven marketing
       and delivering additional value through in-app engagement with customers

       Investing in Business Systems - Enhancing business systems to better support
       management decision-making and to maintain Altium’s strong operating leverage

                      For Altium to reach 100,000 subscribers by 2025 it
                      needs to lay the foundation for accelerated growth
                                                                                                   8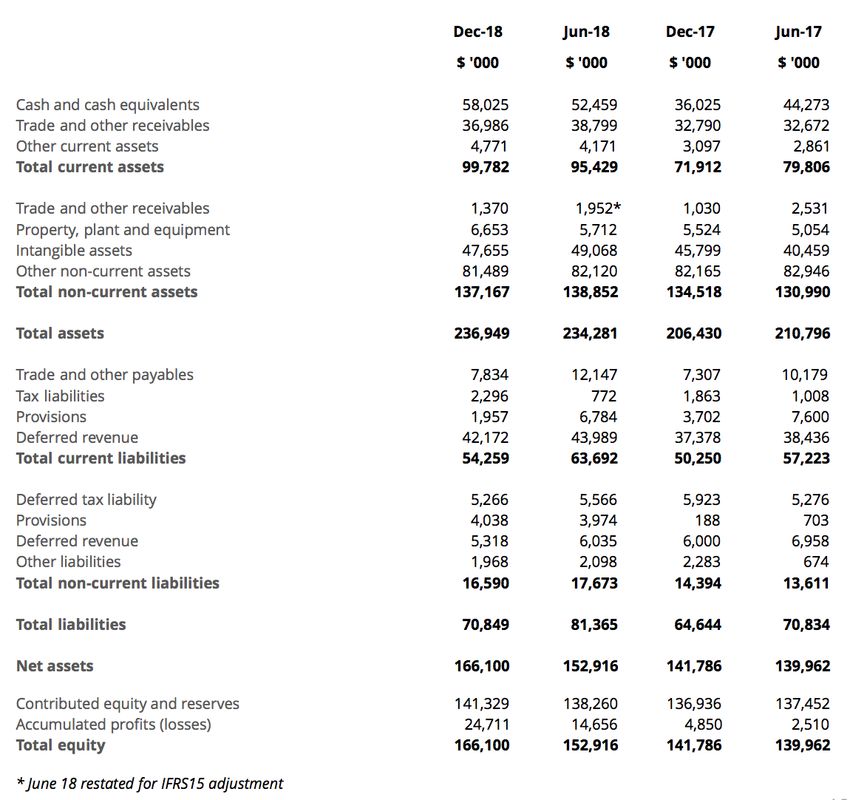
Aggressively Executing on a Product Strategy
for Dominance & Industry Transformation
                   *
                                  From Concept                    To Realization           Extreme Enterprises

                                                                                           Agile Enterprises

                                                                                           Power Users &
                                                                                           PCB Specialists
       365
                                                                                           Makers &
                                                                                           Entrepreneurs

 Four unique platforms                                                             Meeting the needs of
 for the design and                                                                every customer from a
 realization of electronic                                                         large enterprise to an
 products                                                                          aspiring start-up

                                                     Electronic
                                                        Parts

 *   Altium’s ECAD solution is built into Dassault
     Systemes’ 3DEXPERIENCE platform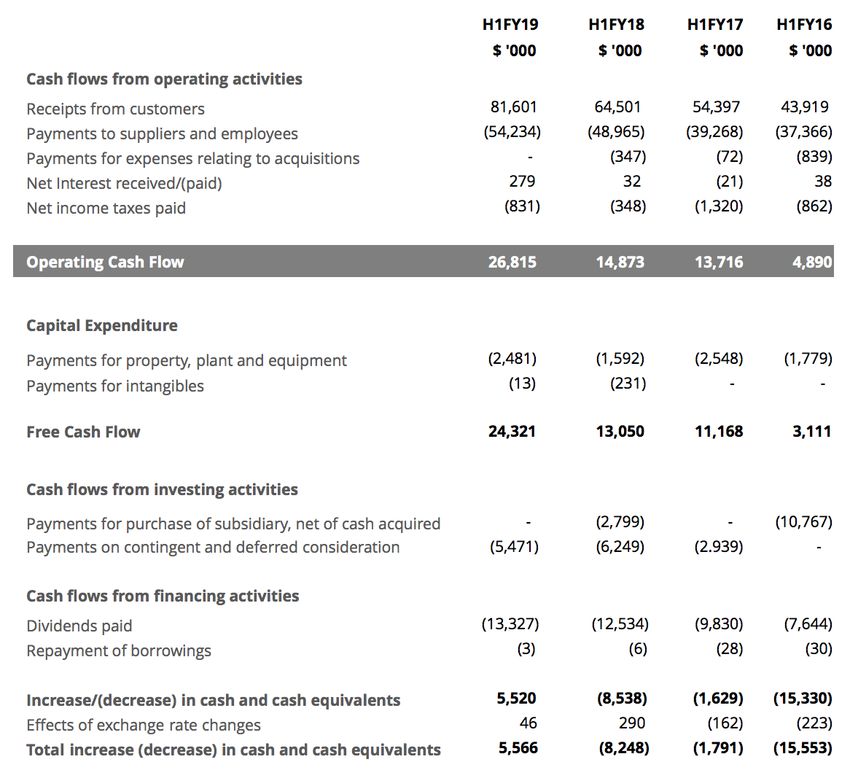
Committing to an Aspirational Revenue Target by 2025

                                                 Electronic Design
 2025 Target Revenue
 Breakdown

                                      60-80%

                                   100,000
                                   Subscribers                                                                                              2025

                                    $500M *                                                                              2020
                                    Revenue
                                                                                                       2017

                                                                                   2015
                          10-20%               10-20%

                                                                              Strong Strategy,    $100 + Million       PCB Market       Transforming
      Electronic Parts                                  Electronic          Leading Technology Revenue & Expansion    Leadership &    Electronic Design
                                                                                                                                           and its
      & Supply chain                                    Manufacturing &          & Revenue          of Market           Laying the
                                                                                                                                         Realization
                                                                                Momentum           Opportunity       Foundation for
                                                        Embedded Software                                                Industry
                                                                                                                     Transformation
* The target revenue of $500M may include 5-10% from future acquisitions                                                                                  10
Agenda
1 Company Highlights & Significant Achievements
2 2019 Half Year Financial Performance & Metrics
3 Driving Forces, Market Opportunity & Industry Transformation
4 Appendix: Company OverviewRevenue Sources – H1 FY19
US Millions
$0.5
$78.1
$1.8
$26.1 $4.8
(2.3%) (0.6%) (100%)
80 (33.4%) (6.1%)
Non-recurring
60 Revenue
$8.9 $1.1 $33.2
50 (11.4%) (1.4%) (42.5%)
$2.3
40 $2.7 $0.6 (2.9%)
$28.1 $1.3 (0.8%)
(3.5%)
(36.0%) (1.7%)
30 Recurring
Revenue
20
$44.9
(57.5%)
10
* Services includes revenue for
Services *
Subscription
Altium Designer
Term-based Licenses
Altium Designer
Maintenance
TASKING
Other Recurring
New Perpetual Licenses
Altium Designer
New Perpetual Licenses
TASKING
Other Non-recurring
Octopart
Term-based Licenses
TASKING
Term-based Licenses
NEXUS
Total Revenue
TASKING, Altium Designer and
NEXUS
12Revenue – Board and Systems by Region
BSD - Americas H1 Revenue: 11% 5 Yr Revenue CAGR: 17% BSD – EMEA USD H1 Revenue: 16% 5 Yr Revenue CAGR: 15%
5 Yr Recurring CAGR: 14% 5 Yr Recurring CAGR: 15%
$40m $40m
$35m
$30m $30m
$25m
$20m $20m
$15m
$10m $10m
$5m
H1 FY H1 FY H1 FY H1 FY H1 FY H1 H1 FY H1 FY H1 FY H1 FY H1 FY H1
2014 2015 2016 2017 2017 2019 2014 2015 2016 2017 2018 2019
Recurring
BSD – China H1 Revenue: 49% 5 Yr Revenue CAGR: 19%
BSD – ROW H1 Revenue: 4% 5 Yr Revenue CAGR: 12%
Revenue
5 Yr Recurring CAGR: 9%
5 Yr Recurring CAGR: 10%
$10m
$15m
$13m $8m
$11m
$6m
$9m
$7m $4m
$5m
$2m
$3m
H1 FY H1 FY H1 FY H1 FY H1 FY H1
H1 FY H1 FY H1 FY H1 FY H1 FY H1
2014 2015 2016 2017 2018 2019 2014 2015 2016 2017 2018 2019Revenue – BSD, NEXUS, Octopart and TASKING
BSD – Total H1 Revenue: 17% 5 Yr Revenue CAGR: 16% 5 Yr Recurring CAGR: 14% NEXUS H1 Revenue: 20%
$5m
$120m
$100m $4m
$80m
$3m
$60m
$2m
$40m
$1m
$20m
H1 FY H1 FY H1 FY H1 FY H1 FY H1 H1 FY H1 FY H1 FY H1 FY H1 FY H1
2014 2015 2016 2017 2018 2019 2014 2015 2016 2017 2018 2019 Recurring
Revenue
Octopart H1 Revenue: 80% 5 Yr Revenue CAGR: 54% TASKING H1 Revenue: 20% 5 Yr Revenue CAGR: 19% 5 Yr Recurring CAGR: 19%
$15m
$12m
$12m
$9m
$9m
$6m
$6m
$3m
$3m
H1 FY H1 FY H1 FY H1 FY H1 FY H1 H1 FY H1 FY H1 FY H1 FY H1 FY H1
2014 2015 2016 2017 2018 2019 2014 2015 2016 2017 2018 2019 14Board and Systems – Underlying Metrics
Altium Designer New Seats Sold Subscription Pool
6,321
39,179
7,000 (+801)
35,977 (+3,202)
40,000
(+3,656) 4,377 (- 38)
5,520 32,321
6,000 (+339)
5,181 35,000 (+1,187) 3,684 (+ 748)
29,320
(+863) (+2,377)
26,943 14,894 (+ 1,646)
5,000 4,318 30,000
(+2,122)
(-337)
3,544 25,000
4,000 (+893)
472 (+80) 20,000
2,651
3,000 2,178 (+473) 1,283 (+551)
2,162
16,224 (+ 846)
(+406) (+16) 15,000
1,756
2,000 (-160)
941 (+186) 10,000
1,000
848 (+76) 5,000
H1 FY H1 FY H1 FY H1 FY H1
-
Dec Jun Dec Jun
ч
Dec Jun Dec Jun Dec
2015 2016 2017 2018 2019 FY15 FY16 FY17 FY18 FY19
Americas EMEA China Rest of World Americas EMEA China Rest of World
15Altium’s Subscription Pool
+2,755 -6,580
45,000 +1,138 -3,823
+7,220 +3,947
39,179
40,000 37,917
Rejoins & Upgrades
Rejoins & Upgrades
Lapsed
34,522
New
Lapsed
35,000
Growth pool ~ Developed Countries
Subscription Pool Size
New
30,000
~85% of subscription pool
86.5% renewal rate (FY18 - 86.6%)
25,000
Constant pool ~ Developing Countries
20,000 ~15% of subscription pool
31.2% renewal rate (FY18 - 35.8%)
15,000
10,000
5,000
0
June June Dec
2017 2018 2019
15Operating Expenses
100%
Operating Leverage Drives
Expanding EBITDA
26.7 % 25.0 % 25.8 % 30.0 %
36.3 % Sales and Marketing has increased to support
80%
increased growth rates in the transactional
2.7 % 3.9 %
3.0 %
model (capacity) and increased solution selling
0.4 % capability
19.6 % EBITDA
60% 21.6 %
23.2 % 18.1 %
19.8 %
Acquisitions R&D spend efficiency as a percent of revenue
G&A is based on effective resources allocation and
40% leveraging low cost resources. Overall R&D
36.4 % Sales
33.1 % 32.8 % spending has increased half over half
32.3 % 29.6 % R&D
20%
17.3 % 17.6 % 14.8 % 16.1 % 13.9 %
H1 H1 H1 H1 H1
2015 2016 2017 2018 2019
17Balance Sheet
Cash and cash equivalents
$70m
61,9
$60m 58,0
52,5
$50m
44,3
$40m 38,1
$30m
22,0
$20m
$10m
$0
FY14 FY15 FY16 FY17 FY18 FY19 H1
18Cash Flow
Dividends declared
Final
Interim
14
25AUD¢
12
20AUD¢ 10
8 16
15AUD¢
8 13
11
10AUD¢ 10
8
5AUD¢
4
0
FY14 FY15 FY16 FY17 FY18 FY19 H1
19Half Year Results Key Metrics
H1 H1 +/- H1 H1 H1 H1 H1 H1
USD millions FY19 FY18 % FY17 FY16 FY19 FY18 FY17 FY16
Revenue (excl. interest) 78.1 63.2 24% 48.7 42.6 EPS 18.00 11.48 7.64 7.12
Reported expenses 36.1 31.9 Dividends (AU cents) 16 13 11 10
49.8 44.3 12%
Key Margin Analysis
• Business expenses 49.5 42.3 17% 34.2 30.7
EBITDA Margin 36.3% 30.0% 25.8% 25.0%
Underlying EBITDA Margin 36.7% 33.1% 29.6% 27.9%
• One-off expenses 0.3 1.9 -85% 1.9 1.2 Net profit before tax margin 33% 26% 22% 23%
Net profit after tax margin 30% 24% 20% 21%
EBITDA 28.4 19.0 49% 12.5 10.7 Effective tax rate 9.0% 9.7% 8.6% 6.1%
Depreciation and 1.7 0.9 Balance Sheet (USD millions)
2.9 2.5 13% Cash and equivalents 58.0 36.0 36.3 46.4
amortization
Net assets 166.1 141.8 131.6 125.8
EBIT 25.5 16.5 55% 10.8 9.7
Operating cash flows 26.8 14.9 13.7 4.9
Net interest -0.3 0.0 N/A 0.0 0.0
Profit before income 10.8 9.7
25.8 16.5 56%
tax
Income tax expense 2.3 1.6 45% 0.9 0.6
Profit after income tax 23.4 14.9 58% 9.9 9.1
20Agenda
1 Company Highlights & Significant Achievements
2 2019 Half Year Financial Performance & Metrics
3 Driving Forces, Market Opportunity & Industry Transformation
4 Appendix: Company OverviewRise of Smart Connected Devices
Web 1.0 Information
Search & Discovery
1990’s Is Indexed
Web 2.0 People are
Social Networking
2000’s Networked
Web 3.0 Electronics puts
Internet of Things Internet into
2010’s Things
Web 4.0 Electronics
2020’s Artificial Intelligence Binds Infotech
to Biotech
Internet of Things & Artificial Intelligence are driving the
proliferation of electronics
22Electronics at the Heart of All Intelligent Systems
Printed Circuit Boards are central to the design & realization of electronics
23IOT is Driving the Pace of Innovation
Electronics is critical
to speeding up
cycles of innovation
Existing tools do not
adequately address the
needs of high-tech
products
Success depends on the ability to move quickly through innovation cycles
24Current Engineering Tools Fall Short
MCAD - Mechanical Computer Aided Design
CAM
ECAD - Electronic Computer Aided Design
CAE - Computer Aided Engineering - Analysis and Simulation
CAM - Computer Aided Manufacturing
PLM PLM - Product Lifecycle Management
CAE
The current model for tool integration is old and
has evolved around the notion of “tool-chains”
25The Future of Engineering Tools is Multi-disciplinary…
Cloud System
Embedded Software
Electronic CAD
Mechanical CAD
Electrical CAD
ECAD and MCAD tools must communicate natively
and operate at the same level of abstraction
26IoT Requires Transformation of the Electronics Industry
Electronic Design & Manufacturing Services
Estimated size: $1,000 - $1,500Bn
Concept Realization
Requirements Validation
System Product
Design Assembly
Board & Board
Electronic Design Automation Tools
Circuit Fabrication & Global Printed Circuit Board Market
Estimated size: $2 - $5Bn Design Assembly Estimated size: $80 - $100Bn
Electronic
Components
IoT requires the “Uberization” of
the Electronics Industry -
$2 Trillion Global Semiconductor and Electronic Parts
Manufacturing & Distribution transforming electronic design and
Estimated Industry Estimated size: $600 - $800Bn its realization 27
SizeElectronics Design Needs to Connect to the Manufacturing Floor
365
Concept Realization
Requirements Validation
System Product
Design Assembly
Board & Board
Circuit Fabrication &
Design Assembly
Electronics Design Manufacturing
Floor
Connecting electronics design to the manufacturing floor with
bi-directional digital continuity is at the heart of transformation
28Electronics Industry Value Chain
Electronic Manufacturing
Equipment Vendors PLM IC Design Tools
Vendors Semiconductor
Vendors Manufacturers
Simulation
PCB Vendors
Electronic Testing Assemblers
Equipment Vendors Electronic
CAD Vendors
PCB Electronic Parts
Design
Fabricators Manufacturers
Tools Value
Chain
Electronic Parts
Electronic Distributors
Manufacturing Parts
Manuf.
Services (EMS) Value Chain Value
Search & Analytics
High-Tech Chain
Product Content Aggregators
Companies
The three segments of the value chain are completely
isolated and digitally disconnected within their own chain 29Transformation Through Dominance…
Market Leadership Market Dominance
Altium must target 100,000 active subscribers by 2025 so as to compel key industry
stakeholders to support its agenda to transform electronic design and its realization
30Altium’s Long-Term Outlook
The proliferation of electronics through the rise of smart connected devices continues to
drive growth for our business in the foreseeable future
Altium is confident of achieving its 2020 target of US$200 million revenue and commits to
an EBITDA margin of 35% or better
Altium has committed to the achievement of 100,000 Altium Designer subscribers before
2025 for market dominance and has committed itself to an aspirational revenue goal of
$500 million in 2025
Altium will continue to pursue partnership and M&A opportunities to support its long-
term vision of creating a product design and realization platform that is centered around
electronics
31Agenda
1 Company Highlights & Significant Achievements
2 2019 Half Year Financial Performance & Metrics
3 Driving Forces, Market Opportunity & Industry Transformation
4 Appendix: Company OverviewAltium's Journey - a Long History and a Promising Future
1- Altium creates a seamless online and offline design experience The company was founded by creating the
for a new breed of designers with Upverter 2.0 first version of Altium Designer, Protel PCB
2- Altium acquires board manufacturing company PCB-NG,
combining it with Ciiva to create the world’s first fully integrated
design-to-realization channel
Altium Launches Protel for Windows - 1985
World's first Microsoft Windows-based
PCB design system
Altium Successfully 1991
Now
completes an IPO on
Australian Stock Exchange
Altium partners with
Dassault Systemes 1999
SOLIDWORKS to deliver a
specialized version of its
PCB design software for 1- Altium acquires Octopart, the #1
2006
SolidWorks users electronic parts search engine in the
world
2- Altium acquires Ciiva, a
2017
cloud based electronic
components
management system Altium launches Altium
2010
Designer 6, the world’s
first Native 3D PCB
design software
2016 Altium launches Altium Designer
2014
13 introducing DXP 2.0, its next
generation integration platform
2015
1- Altium surpasses $US100 million revenue opening up Altium Designer to
target and delivers $US110 million for third-party developers
financial year 2017
2- Altium acquires Upverter, the developer
of the world’s first fully cloud, fully 1- Successful capital raising
collaborative electronics design systems of $44M on ASX
3- Altium releases Altium Designer 18 and 2- Altium relocated its HQ to
launches NEXUS California USA
33Printed Circuit Board Design and Manufacturing Process
Circuit Diagram Layout Film Bare Board Assembled Board
Design Capture Layout Fabrication Assembly
34Altium the “Easy to” Company
Altium DNA
Uncomplicated Easy to Get Up
Value and Running
Proposition
Direct Sales Easy to Learn,
Force Easy to Use
Free Technical Easy to Maintain with
Support No Hidden Costs
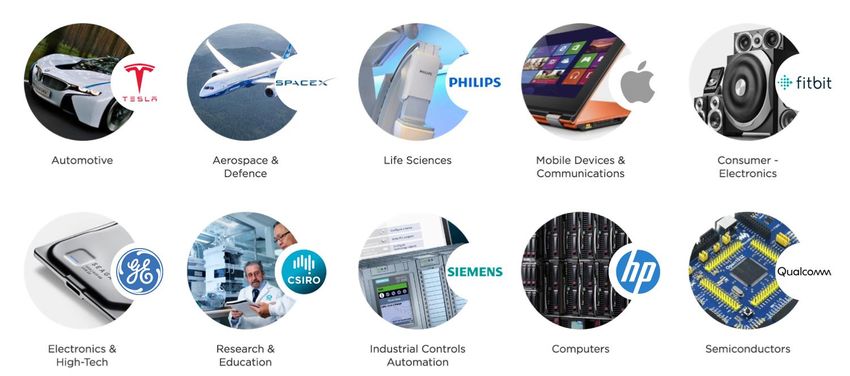
35Altium Products
36Diversity of Application
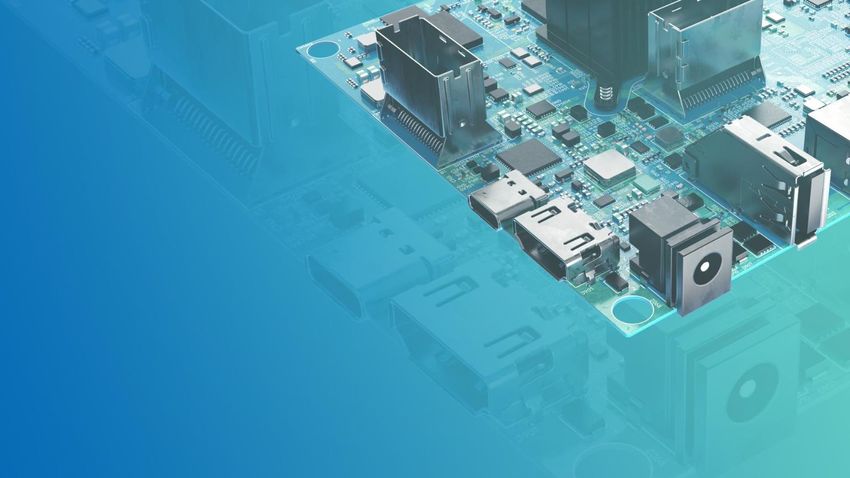
37High Profile Customers
Automotive Aerospace & Defence Life Sciences Mobile Devices Consumer- Electronics
Electronics & High-Tech Research & Education Industrial Controls Computers Semiconductors
38Global Reach
39Altium is Re-defining the Competitive Landscape…
Market Share by Revenue
Altium will dominate the competition well before 2025
This chart is produced using market data from Gary Smith EDA and Altium’s internal competitive model. 40The Altium Advantage
Transformational Leadership
Established Global Business User-Centric DNA
41Altium’s Strategy for Success
Maintaining Disciplined Disciplined Transforming Being True to Our Deep
Execution and Remaining Execution to Electronic Conviction that Altium’s Journey
Single-Minded About PCB Achieve Market Design & Its Will Bring About Transformation
Market Leadership Leadership Realization of the Electronics Industry
Building Strong
Strategic
Partnership
Building a Strong Partnership
with Leading Engineering
Software Companies to Connect
ECAD with MCAD & PLM 42Altium Values …
Diversity in Thoughts Transparency
Product Sales
“Regular Product Releases” and “High Volume Selling” and
“Delivering Next Generation “Sophisticated Value Proposition”
Products”
Perseverance Ingenuity
Finance 0 People
“Growing Revenue Strongly” and 4 “Diversity in Thinking” and
“Expanding Profit Margin” “Aligned in Action and Purpose”
“the Genius of AND”
Adaptability Agility 43Altium’s Long-Term Outlook
• The proliferation of electronics through the rise of smart connected devices continues to
drive growth for our business in the foreseeable future
• Altium is confident of achieving its 2020 targets of US$200 million revenue and commits to
an EBITDA margin of 35% or better
• Altium is committed to the achievement of 100,000 Altium Designer subscribers before
2025 for market dominance and has committed itself to an aspirational revenue goal of
$500 million in 2025
• Altium will continue to pursue partnership and M&A opportunities to support its long-term
vision of creating a product design and realization platform that is centered around
electronicsYou can also read