UNIMOT Group: business and development directions - Spring European Midcap Conference 25 June 2021 - UNIMOT ...

Page created by Jennifer Henry
 
CONTINUE READING
UNIMOT Group: business and development directions - Spring European Midcap Conference 25 June 2021 - UNIMOT ...
UNIMOT Group: business and development directions
Spring European Midcap Conference
25 June 2021
UNIMOT Group: business and development directions - Spring European Midcap Conference 25 June 2021 - UNIMOT ...
POLAND – STRATEGIC LOCATION IN THE HEART OF EUROPE

                                  GDP per
                                                  35,165 USD
                                   capita (PPP)

        No of cities exceeding
  16    200 thous.                                199.3 billion
                                         Export
        inhabitants                               USD

        Lowest median age                  Population    38,5m (6th in EU)
  2nd
        in CEE (39.6)
                                                                                              Vilnius
                                                                                                        Minsk
 Polish Zloty (PLN)
                                          Area    312,700 sq km (6th in EU)   Berlin   Warsaw
 1 EUR ~ 4.5 PLN                                                                                            Kiev
                       Currency
 1 USD ~ 3.8 PLN                                                                  Prague
                                                                                           Bratislava
 1 GBP ~ 5.1 PLN
                                                                                         Budapest

  Poland is the 3rd major exporter to Germany

Source: National Bank of Poland                                                                                    2
UNIMOT Group: business and development directions - Spring European Midcap Conference 25 June 2021 - UNIMOT ...
POLISH ECONOMY IS STILL DEVELOPING FASTER THAN EU

     The largest EU country in the CEE                         Percentage change in the Polish GDP in comparison with the Euro Zone and
                                                                             EU member states in the years 2016-2024**
                  region

                Population in the CEE*
            Others
             19%                         POLAND
                                          39%

       Romania
        21%

                                         Czech
          Hungary                       Republic
           10%                            11%

                                                                                    Euro zone    EU              Poland

*Source: MoED         ** source: International Monetary Fund                                                                              3
UNIMOT Group: business and development directions - Spring European Midcap Conference 25 June 2021 - UNIMOT ...
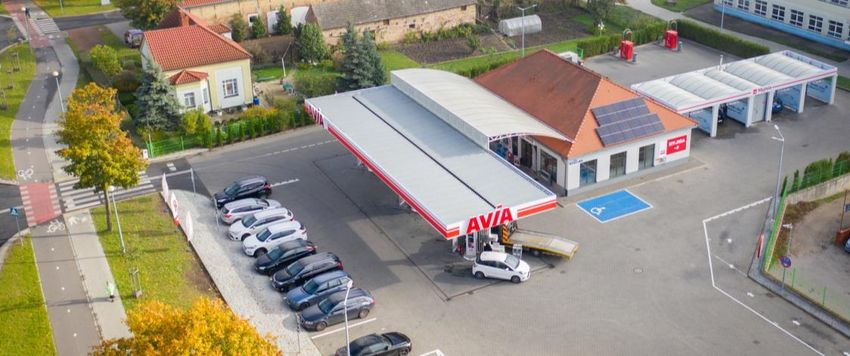
A RELIABLE, INDEPENDENT TRADE GROUP WITH A LONG HISTORY

                     Over               about                              almost                    almost

                 200        1 million m3                         5 billion PLN
                                                                   in annual revenue*
                                                                                               30 years
                employees     liters of fuel sold annually                                     of business history

                            A national capital group - not belonging to any fuel corporation

                                                                         Member
                                                                   of AVIA International

                             Presence in sWI80

                                                                                                                     4
* Revenue for 2020
UNIMOT Group: business and development directions - Spring European Midcap Conference 25 June 2021 - UNIMOT ...
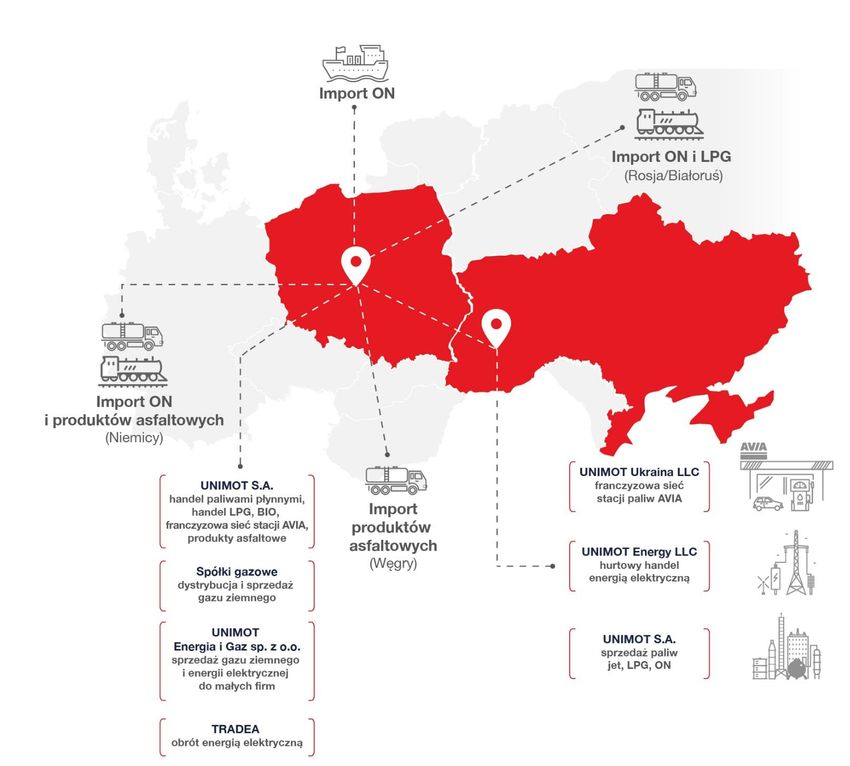
LONG-TERM EXPERIENCE IN THE FUEL AND ENERGY SECTOR

                                                                             2017
                                            2016
                                                                         99 million PLN obtained in
                                           Establishment of              public offering and a debut
  1992                                     cooperation                   on the main market of the
                                           with AVIA                     Warsaw Stock Exchange
Unimot is founded by members
of Sikorski family - trading in car
oils

             2012                        2014                                          2018                2020
         Debut on New                 Start of operations on the wholesale          Publication of the   Start of operations on the
         Connect market               Diesel and BIO fuel market                    Strategy for the     RES market
                                                                                    years 2018-2023

                                                                                                                                      5
UNIMOT Group: business and development directions - Spring European Midcap Conference 25 June 2021 - UNIMOT ...
SUPPORT BY OWNERS AND INVOLVEMENT OF FUNDS

                    Adam Sikorski
                    Co-founder of the company and owner of Unimot
                    Express and Zemadon Limited (together with the
                    Sikorski family)
                    President of the Management Board of UNIMOT
                    S.A.

                                    Unimot S.A. shareholder structure

      Including:*

       NN OFE                            36%                            Unimot Express sp.z o.o.
       Quercus TFI                                         44%
       Norges Bank                                                      Zemadon Limited
       Millenium TFI
       TFI BGŻ BNP Paribas                                              Other
       Other members of the
       Management Board of                      20%
       UNIMOT S.A.
                                                                                                   6
UNIMOT Group: business and development directions - Spring European Midcap Conference 25 June 2021 - UNIMOT ...
A TEAM OF THE BEST SPECIALISTS IN THE INDUSTRY

Board of Directors

                                                                                                                               A team with long-term
                                                                                                                                   experience and
                                                                                                                              extensive knowledge in
                                                                                                                               their respective areas

                                                                                                                                    Among over 200 employees
     Adam Sikorski                    Robert Brzozowski                     Filip Kuropatwa                           and co-workers of the Group, the Management Board relies
             President                    Vice-President of the               Vice-President of the
                                                                                                                        both on persons who have grown together with
     of the Management Board           Management Board for Trade         Management Board for Finance
                                                                                                                        UNIMOT, and those gaining experience in large
 Many years of international
                                       International trading and
                                                                              Experienced expert                                           corporations.
  experience in the area of                                               in dealership and financial
                                        managerial experience
          oil & gas                                                               operations

Supervisory Board
                                                                                        Isaac Querub – Member of the Supervisory Board
Andreas Golombek – Chairman of the Supervisory Board (independent member)
                                                                                        Prof. Dr Hab. Ryszard Budzik – Member of the Supervisory Board, Member of the Audit Committee (independent)
Bogusław Satława – Vice Chairman of the Supervisory Board
                                                                                        Piotr Prusakiewicz – Member of the Supervisory Board, Member of the Audit Committee (independent member)
Piotr Cieślak – Member of the Supervisory Board, Chairman of the Audit Committee
(independent member, Executive Director of the Association of Individual Investors)     Lidia Banach-Hoheker – Member of the Supervisory Board (independent member)

                                                                                                                                                                                                   7
UNIMOT Group: business and development directions - Spring European Midcap Conference 25 June 2021 - UNIMOT ...
UNIMOT - A SOCIALLY RESPONSIBLE COMPANY

  In all areas of its operations, the Group follows the principles of
 professionalism and business integrity, while ensuring the quality
and safety of products it trades in. It also cultivates its relationships
    with clients, suppliers, employees, the local community and
                investors, basing them on mutual trust
                              and respect.

Support for local communities as well as young talents,
among others:
▪ education of remarkable young Poles on the best universities
  in the US and Europe - cooperation with the IVY Poland Fund
▪ cooperation with Częstochowa University of Technology
▪ support for Zawadzkie commune
▪ Help in the fight against COVID-19 pandemic

                                                                            8
UNIMOT Group: business and development directions - Spring European Midcap Conference 25 June 2021 - UNIMOT ...
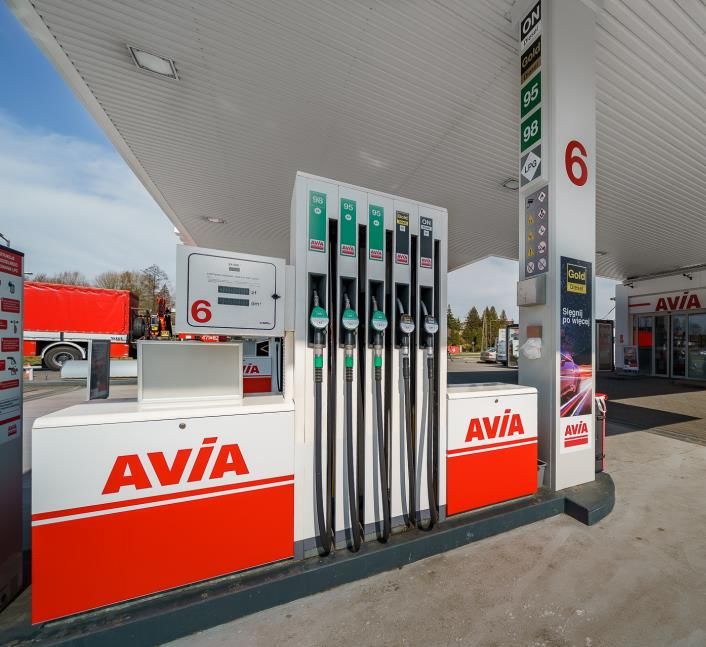
A GROWING LIQUID FUEL MARKET WITH A POSITIVE PERSPECTIVE FOR
       THE FUTURE

                                   Scenarios of liquid fuel demand in Poland*                                     Diesel fuel consumption in Poland*
                                                  [in million m3]                                                            [in million m3]

                                                                                                                                   20,3       21,0     20,7
                                                                                                                        19,8
                                                                                                          17,2                                 5,6     5,3
                                                                                                                                    5,9
                                      basic option                                                                       6,5
                                      optimistic option                                                     4,5

                                      pessimistic option

                                                                                                                                   14,5       15,4     15,4
                                                                                                           12,7          13,3

                                                                                                          2016          2017       2018       2019     2020

                                                                                                                                including import

                                                Share of UNIMOT in the imports of Diesel fuel to Poland in 2020***:

                                                                                 15.3%
                                                                                                                                                              9
* source: POPiHN   ** source: IAA Mobility report, PZPM    *** Own estimates based on market data from POPiHN
UNIMOT Group: business and development directions - Spring European Midcap Conference 25 June 2021 - UNIMOT ...
LEADING LIQUID FUEL WHOLESALER IN POLAND

 A broad distribution network in Poland                           Fuels offered by UNIMOT                      Fuels sold under the brand:

                                                                      diesel       diesel

                                                                      Fuels from UNIMOT “supplement” the offer of state fuel corporations in
                                                                         the portfolio of recipients for whom independence of supplies is
                                                                                                       important

                                                                      A diversified recipient base - 10 largest recipients provide for only about
                                                                                                   20% of revenue

                                                                  Clients - over 1000 active clients:
                                                                  ▪     transport and construction companies
 Bases – imported fuel                                            ▪     fuel wholesalers
 Bases – national fuel                                            ▪     fuel stations
 PERN product pipelines                                           ▪     agriculture

                         Developed, efficient logistics and well-established relationships with recipients
                                                                                                                                               10
AVIA STATIONS NETWORK

                                                          The number of stations in the AVIA network
                                                                          in Europe

                                                                                   6
                                                                                   65
                                                                                             13

   Over 3150 fuel stations in 14 countries in
   Europe. Founded in 1927 in Switzerland.

       The number of stations in the AVIA
              network in Poland
                                                  90
                    Target
                    Existing stations
                                         60
                                50
                       42

             15

           End of    End of   End of    End of   End of
           2017      2018     2019      2020     2021P

                    TARGET: 200 stations

                                                                                                       11
* source: Data of AVIA International
THERE IS A HUGE AMMOUNT OF IMPORTED USED CARS TO POLAND

                                                                                        Share of electric and hybrid cars of plug-in**
              850 thousand used cars are imported to Poland every year.                 type in the total vehicle registrations in 2020

                         58% of which come from Germany.                                     Country                Share
                                                                                             Norway                    74.8%
                                                                                             Island                    44.6%
                                                                                             Sweden                    32.1%
                                                                                             Netherlands               24.7%
                                                                                             Finland                   17.7%
                                                                                             Denmark                   16.4%
                                                                                             Switzerland               14.3%
                                                              490 thousand                   Germany                   13.5%
                                                                                             Portugal                  13.5%
                                                               cars annually
                                                                                             Luxembourg                11.4%
                                                                                             Europe                    11.4%
                                                                                             France                    11.3%
                                                                                             United Kingdom            10.9%
                                                                                             China                       6.3%
                                                                                             Italy                       4.3%
                                                                                             USA                         2.1%
                                                                                             Poland                      1.9%
                        GERMANY                                                POLAND
                                                                                             Australia                   0.5%
                                                                                             Russia                      0.0%

Source: Automotive Market Research Institute; data for 2020                                                                          12
ELECTRICAL ENERGY - GREEN ENERGY

                                  SALES OF            2. Production of photovoltaic panels
                                  INSTALLATIONS FOR
                                  ENERGY PRODUCTION

Clients:
1. Individuals
2. Companies
FOCUS ON B2B

 Use of AVIA stations as an additional                            Production of panels suited to clients’ needs
 sales channel

                                                      3. Development of photovoltaic farms

                                                           Projects with the total power of over 100 MW in the pipeline

                                                                                                                          13
MARKET TRENDS SUPPORT OUR BUSINESS
      Poland, Estonia, Cyprus, Greece, Czech Republic, Malta, Bulgaria, Netherlands, Germany

EU countries with most intense CO2 emissions in the energy                                                       Expected emission intensity of electricity Production in 2030
                     sector, in g/KW                                                                                                   [gCO2/KWh] **
     724                                                                                          Polska                                                                                            566
            669     653                                                                          Czechy                                                                     425
                            522                                                                 Bułgaria                                                          365
                                   386     356     352                                           Niemcy                                          248
                                                          318     301
                                                                                                  Belgia                                       229
                                                                                                Rumunia                                     203
                                                                                                 Włochy                             156
                                                                                                  EU-27                             153
                                                                                                 Irlandia                         145
                                                                                                  Grecja                         137
                                                                                                Holandia                        124
                                                                                                  Węgry                  83
                                                                                               Hiszpania               69
                                                                                                  Austria            59
                                                                                               Portugalia           50
                                                                                               Finlandia          37
                                                                                                Słowacja           42
                                                                                                 Francja        22
                                                                                                Szwecja        14
                                                                                                   Dania       14

                                                                                                   Poland has the largest fleet of trucks and buses in the EU,
                                                                                                   but there are still many old vehicles driven throughout the
                                                                                                   country.***
                                                                                                                                                                                                          14
                                                                                     * Source: Ember        **National Energy & Climate Plans (NECPs)   *** source: Vehicles in use – Europe 2019
TURNOVER AND SALES OF NATURAL GAS - THE WHOLE CHAIN

                                         Own infrastructure –    Further market liberalization and the projected
        ▪    Imports
                                 ▪   over 100 km of pipelines              increase in gas demand
        ▪    Wholesale trade
                                 ▪   3 regasification stations
        ▪    Distribution
        ▪    Sales                                                  Projected demand for transmission services by 2040*
                                                                                          [mld m3]
        ▪    Regasification of
             LNG

                                                                          moderate growth forcast   optimum growth forecast

                                                                                                                              15
* source: Gaz-System
GROWING DIVERSIFICATION IN THE DIRECTION OF GREEN ENERGY

        LIQUID             FUEL             FUELS      ELECTRICAL
                         STATIONS            GAS         ENERGY   PHOTOVOLTAICS               OTHER CRUDE OIL
        FUELS                                                                                   DERIVATIVES

FUELS   BIOFUELS   LPG   FUEL STATIONS   NATURAL GAS ELECTRICAL ENERGY PHOTOVOLTAICS      ASPHALT           OILS CRUDE OIL
                                                                         since 06.2020   PRODUCTS        since 09.2019
                                                                                                                         since 05.2020
                                                                                         since 09.2019

                                                                                                                                16
UNIMOT GROUP – INTERNATIONAL OPERATIONS

                                                                  Diesel import

                                                                                              Import of diesel and LPG
                                                                                                 (Russia/Belarus)

                  Import of diesel and
                   asphalt products
                      (Germany)

                                                                                          Franchise network of
                                   Trade in liquid fuels, trade in                         AVIA fuel stations
                                   LPG, BIO, franchise network        Import of asphalt
                                   of AVIA fuel stations, asphalt
                                      products, photovoltaics        products (Hungary)

                                                                                           Wholesale trade in
                                                                                           electrical energy
                                         Gas companies
                                   Natural gas distribution and
                                              sales

                                                                                            Sale of jet, LPO,
                                    Sales of natural gas and                                 diesel, fuels
                                    electrical energy to small
                                            companeis

                                   Trade in electrical energy
                                                                                                                         17
Reference chart
INCREASE IN THE SCALE OF OPERATIONS OVER THE YEARS

                                       Revenue                                                              adjusted EBITDA*
                                     [million PLN]                                                                  [million PLN]                                      Target EBITDA
                                                                                                                                                                         adjusted for
                                         +1479%                                                                        +3230%
                                                                  +7%                                                                    +37%                       2023 = 75 million PLN
                                                                                                                                            87,2
                                                                      4 770
                                                             4 445                                                                                 75,3            (Strategy for the years 2018-
                                                                                                                                    63,7
                                         3 005
                                                   3 371                                                                                                                       2023)
                                2 532                                                                      44,7**
                                                                                                                            31,5
                                                                                                                    24,7
              302                                                                           2,7*
                                                                                                                                                                   Met several years before
             2013      (…)      2016      2017      2018     2019       2020                2013       (…)2016      2017   2018     2019    2020   2021F
                                                                                                                                                                     the scheduled time
                                                                                                                                                                      (in spite of COVID-19
                                                                                                                                                                            pandemic)

                                                                                               2018                          2019                          2020    1Q21 LTM          GOAL 2023

  Financial liquidity ratio (current assets / short-term liabilities)                               1.33                          1.45                      1.36          1.31             min 1.2
  Interest coverage ratio (adj. EBITDA / interest)                                                  3.71                          6.92                     15.42         14.81             min. 3x
  Equity Ratio (equity / balance sheet total)                                                      32.0%                      35.9%                        33.6%        27.7%             min 20%
  ROCE (adj. EBITDA / fixed assets – working capital)                                              14.4%                      26.4%                        31.9%        28.2%               15.0%
  Total net debt ratio (total liabilities - cash / assets)                                         60.2%                      58.4%                        51.7%        61.9%                      -

* Adjusted for the estimate of the mandatory stock, justified shifts and one-time events.                                                                                                          18
** Until 2016 – accounting EBITDA.
DEBT AND FUNDING

Credit facilities as of 31.03.2021

  Main banks                                  Total limit*                                                 Covenants (depending on the bank)                                           Renewal

                                                 PLN 95m                                                                                                  Main credit facilities are renewed every
  mBank, ING Bank Śląski,                                        Current liquidity ratio, net profit ratio, profit on sales ratio, EBITDA/interests,          year. The other ones – for periods
  Bank Millennium, PKO BP                                                  net debt ratio/EBITDA, equity to balance sheet total ratio                     compliant with the investment schedule
                                                 USD 62m                                                                                                                (natural gas infrastructure

  [PLN MM]                                          31.03.2021
                                                                                                                                             Margin of liabilities due to credits, loans and other
                                                                        We have sufficient credit limits and high liquidity
 Debt in total                                          -213 331                                                                             debt instruments depends on variable interest rate it
                                                                        levels. A part of our debt corresponds to a credit                   refers to. Interval analysis of margins:
 Limit for compulsory reserves funding                   106 213
                                                                        for compulsory reserves.                                             ▪ WIBOR 1M – margin 0.9%-1,1%
 Used limit for compulsory reserves funding                  82 267                                                                          ▪ LIBOR 1M – margin in interval 1.35% - 2%
                                                                        We are maintaining highest quality cooperation                       ▪ EURIBOR 1M – margin in interval 1.3% - 1.35%
  Current liquidity ratio                                      1,3      levels with the insurance companies: Atradius,
  Fast liquidity ratio                                         1,0      Euler Hermes, KUKE, Coface and are provided
  Cash liquidity ratio                                         0,2      brokerage support from Marsh Polska.

As of 31.12.2020
* Including trade finance                                                                                                                                                                         19
AN AMBITIOUS BUT FEASIBLE DEVELOPMENT STRATEGY (2018-2023)

                                                      Being flexible about our operations,
                                                                                   in 2023: we focus on the most
                                                          attractive business in the fuel and energy sector.

                                                                            in 2023:
                                                                                       Strategy assumption: 75  million PLN in
          1            Increase in adjusted EBITDA
                                                                                       2023; result in 2020: 80.7 million PLN

          2            Increase in efficiency                                          ROCE*: 15%; result in 2020: 31.9%

                       Development of the AVIA network
          3            in Poland
                                                                                       200 fuel stations

          4            Annual dividend payment                                         at least 30% net profit of UNIMOT S.A.
* ROCE = EBITDA / fixed assets less working capital                                                                              20
MAIN INVESTMENT DIRECTIONS

                Investments in the expansion of the
                fuel station network under the AVIA
                brand (including acquisition of
AVIA STATIONS
                stations) in Poland

                Implementation of projects on
                the RSE power market, including
                photovoltaic farms
PHOTOVOLTAICS   (development)

                Increase of the business
                consisting in trade in natural gas
                using caverns
NATURAL GAS

                                                      21
SYSTEMATIC PAYMENT OF DIVIDENDS

       Dividend policy of UNIMOT S.A.
       If net profit is achieved in the given financial year, the Management Board recommends to the General Meeting of the Company the
       annual payment of dividend in the amount of at least 30% from the unit net profit achieved in the given financial year.

       The recommendation of the Management Board depends each time, among others, on the current and expected operating and financial
       situation of the Company.

                                                          Historically paid dividend per share from profits for the indicated year
                                                                                         [PLN/share]

                                                                                                                 1,97   1,97
                                                                                                  1,70

                                                                                         1,20

                                                                                  0,68

                                                             0,24          0,24                           net
                                                                    0,10                                 loss*

                                                             2012   2013   2014   2015   2016     2017   2018    2019   2020F

* Because of the valuation of the diesel oil compulsory reserves                                                                          22
THE PRICE OF UNIMOT SHARES IS INCREASING

                 Projected consolidated adjusted EBITDA                               100                                                                                                                                                                                                                                                                                                                                                                                                                                                                           120 000
                                                                                                                                                Volume (right axis; in pcs.)                                                                                                                                                December 2020: joining sWIG80
                                   [million PLN]                                                                                                Exchange rate (left axis; in PLN)
                                                                                      90
                                                                                                                                                                                                                                                                                                                                                                                                                                                                                                                                                                    100 000
                                                                                      80

                                                                                      70
                                                                                                                                                                                                                                                                                                                                                                                                                                                                                                                                                                    80 000
                                           86.5                                       60
                                                             75,3                     50                                                                                                                                                                                                                                                                                                                                                                                                                                                                            60 000
                                  63.7
                                                                                      40
                                                                                                                                                                                                                                                                                                                                                                                                                                                                                                                                                                    40 000
                         31,5                                                         30
                24,7
                                                                                      20
                                                                                                                                                                                                                                                                                                                                                                                                                                                                                                                                                                    20 000
                                                                                      10

                                                                                       0                                                                                                                                                                                                                                                                                                                                                                                                                                                                            0

                                                                                            2015-01-05
                                                                                                         03/11/2015
                                                                                                                      05/19/2015
                                                                                                                                   07/23/2015
                                                                                                                                                09/25/2015
                                                                                                                                                             12/01/2015
                                                                                                                                                                          02/10/2016
                                                                                                                                                                                       04/18/2016
                                                                                                                                                                                                    06/23/2016
                                                                                                                                                                                                                 08/29/2016
                                                                                                                                                                                                                              11/02/2016
                                                                                                                                                                                                                                           01/10/2017
                                                                                                                                                                                                                                                        03/15/2017
                                                                                                                                                                                                                                                                     05/24/2017
                                                                                                                                                                                                                                                                                  07/28/2017
                                                                                                                                                                                                                                                                                               10/03/2017
                                                                                                                                                                                                                                                                                                            12/07/2017
                                                                                                                                                                                                                                                                                                                         02/14/2018
                                                                                                                                                                                                                                                                                                                                      04/23/2018
                                                                                                                                                                                                                                                                                                                                                   06/29/2018
                                                                                                                                                                                                                                                                                                                                                                09/04/2018
                                                                                                                                                                                                                                                                                                                                                                             11/08/2018
                                                                                                                                                                                                                                                                                                                                                                                          01/21/2019
                                                                                                                                                                                                                                                                                                                                                                                                       03/26/2019
                                                                                                                                                                                                                                                                                                                                                                                                                    06/04/2019
                                                                                                                                                                                                                                                                                                                                                                                                                                 08/08/2019
                                                                                                                                                                                                                                                                                                                                                                                                                                              10/14/2019
                                                                                                                                                                                                                                                                                                                                                                                                                                                           12/19/2019
                                                                                                                                                                                                                                                                                                                                                                                                                                                                        02/28/2020
                                                                                                                                                                                                                                                                                                                                                                                                                                                                                     05/06/2020
                                                                                                                                                                                                                                                                                                                                                                                                                                                                                                  07/10/2020
                                                                                                                                                                                                                                                                                                                                                                                                                                                                                                               09/14/2020
                                                                                                                                                                                                                                                                                                                                                                                                                                                                                                                            11/18/2020
                                                                                                                                                                                                                                                                                                                                                                                                                                                                                                                                         01/28/2021
                                                                                                                                                                                                                                                                                                                                                                                                                                                                                                                                                      04/06/2021
                2017     2018     2019      2020             2021P

                                                                                                                                                                                                                                                                     1M                                                                            3M                                                                        6M                                                                                1Y                                                       5Y
         Recent recommendations for UNIMOT S.A. issued by BOŚ Brokerage
                                                                                                         Return rate*                                                                                                                                   +12%                                                                      +35%                                                                         +65%                                                                        +75%                                                                    +181%
                            V 2020       VII 2020   X 2020       I 2021     IV 2021
       Recommendation           Buy        Keep      Keep            Buy       Buy
                                                                                                                                                                                                                                                                     2016                                                        2017                                                     2018                                                         2019                                                     2020                                                1Q21
                                40.0        45.0      32.0           49.0      65.0             Average daily volume
       Target price                                                                                                                                                                                                                                                               0.2                                                     5.5                                                          7.9                                                 14.5                                                     28.7                                            18.9
                                PLN         PLN       PLN            PLN       PLN              (thousand pcs.)*

*source: Bankier.pl
Data as of 13 May 2021
                                                                                                                                                                                                                                                                                                                                                                                                                                                                                                                                                                              23
PROACTIVE, OPEN AND RECOGNIZED COMMUNICATION WITH INVESTORS

                                                                                                                                                    Best        Adam Sikorski
                                                        ▪ conferences                                      Best online
                                                                                                                                                  investor     CEO of the year
                                                        ▪ online conferences                             communication*
                                                                                                                                                 relations**       2020***
                                                        ▪ roadshows
                                                        ▪ investor chats
                                                        ▪ presentations
                                                        ▪ spreadsheets
                                                        ▪ one-pagers
                                                        ▪ Factsheets
                                                        ▪ Newsletter
                                                        ▪ Twitter

                                                                Loyalty program
                                                                for shareholders
                                                                 UNIMOT Klub+
                                                                                                               IR Team: gielda@unimot.pl

                                                                                                                                                                                 24
* Contest organized by polish Association of Listed Companies      ** Polish business daily „Puls Biznesu” award   *** Polish business daily „Parkiet” award
WHAT DISTINGUISHES UNIMOT?

       Experienced team of experts
       Strong position on the market – the largest independent fuel importer in Poland
       Operating on growing markets
       Independence ensuring efficient and flexible operations
       Own network of fuel stations, part of the pan-European AVIA network
       Dividend-paying company
       Company audited by PWC

                                                                                         25
Appendix
LAST FINANCIALS - INCOME STATEMENT AND MARGINS

  [in PLN million]                                                                                                                     1Q20                                        1Q21                                1Q21/1Q20

 Net revenues                                                                                                                   1 195 381                                    1 572 324                                          31.5%

 Gross profit on sales*                                                                                                              31 065                                      90 734                                       192.1%

 Gross profit on sales margin*                                                                                                         2.6%                                        5.8%                                       3.2 p.p.

 Operating profit                                                                                                                   -11 382                                      39 375                                            n/a

 Operating profit                                                                                                                         n/a                                      2.5%                                            n/a

 EBITDA**                                                                                                                            -9 861                                      42 584                                            n/a

 EBITDA margin**                                                                                                                          n/a                                      2.7%                                            n/a

 Adj. EBITDA**                                                                                                                       32 861                                      28 311                                         -13.8%

 Adj. EBITDA margin**                                                                                                                  2.7%                                        1.8%                                       -0.9 p.p.

 Net profit                                                                                                                         -10 616                                      30 022                                            n/a

 Net profit margin                                                                                                                        n/a                                      1.9%                                            n/a

* The  item includes realised and unrealised exchange rates and assets and liabilities valuation, in this inventories
** Earnings  Before Interest, Taxes, Depreciation and Amortization
*** adjusted with impact of the valuation of liquid and gas fuel stocks and stocks of other energy products, deferrals for costs and revenues associated with trade in liquid and gas fuels and other energy products as well

as other one-off events

Change in historical data: The Company reclassified the valuation of financial derivatives from own sales costs to profits/losses on account of financial instruments associated with fuel trade and on account of electric           27
energy trading activities from financial revenues
EBITDA VS. ADJUSTED EBITDA

                                                                                                              37,6
           Adj. EBITDA                                             34,4          32,9
           EBITDA*                                                                                             28,0
                                                                                               26,2
       In PLN million
                                               22,9                                                                                     ADJUSTMENTS TO THE EBITDA IN
                                    18,7                  16,7            17,6                                                          1Q2021:
                         16,3
                                                                                                       10,9
                                                                                                                                        ▪ Impact of valuation of liquid fuel stocks:
                                                                   18,3   17,8
                                                           14,9                                15,5                                       - PLN 4 116 thousand
   5,9                                          11,1
                          8,2
                                                                                                                                        ▪ Impact of moving costs over time as a
               -1,4
                                                                                                       4,4                                result of fulfilllment of the National Index
   0,8                               1,0                                                                                                  Target [NCW], National Reduction Target
               -4,6                                                                                                                       [NCR] and maintenance of compulsory
                                                                                   -9,9                                                   reserves: - PLN 10 157 thousand

  1Q18**     2Q18**     3Q18**      4Q18       1Q19        2Q19    3Q19   4Q19   1Q20      2Q20        3Q20   4Q20     1Q21

 [in PLN milion]                                                                    1Q19              2Q19     3Q19           4Q19    1Q20       2Q20        3Q20        4Q20            1Q21

 EBITDA*                                                                                22.9          14.9      34.4          17.8     -9.9       26.2         4.4        37.6           42.6
 EBITDA adjusted with impact of the valuation of liquid and gas fuel stocks
 and stocks of other energy products. deferrals for costs and revenues
                                                                                    -11.8             +1.7     -16.0           -0.2   +42.7      -10.7        +6.4         -9.6          -14.3
 associated with trade in liquid and gas fuels and other energy products as
 well as other one-off events
 Adj. EBITDA                                                                            11.1          16.7      18.3          17.6     32.9       15.5        10.9        28.0           28.3

                                                                                                                                                                                             28
* Earnings Before Interest, Taxes, Depreciation and Amortization
LAST FINANCIALS - BUSINESSES CONTRIBUTION TO ADJ. EBITDA
1Q21 [in PLN million]

                                                                                                                       14,3    42,6

                                                                       0,8     0,3     0,2     1,8
                                                              1,3
                                                      4,5                                              1,6
                                                                                                              28,3
                             3,3     0,1     0,2
                    22,1

                  ON + BIO
                   Diesel+   LPG
                             LPG   Stacje
                                     Fuel    AVIA
                                             AVIA     Gaz
                                                    Natural   UEiG  Tradea Natural
                                                              UEiG Tradea    Spółki Produkty  Foto- Corporate
                                                                                      Other Photovo- Centrum EBITDA
                                                                                                               Adj.   Korekty EBITDA
                                                                                                                      Adjust- EBITDA
                    BIO             Paliw Ukraina
                                   Stations Ukraine Ziemny
                                                      Gas                   Gazowe
                                                                             gas      Ropo- woltaika
                                                                                     refined           korp. Skorygo-
                                                                                             ltaics functions EBITDA ments     1Q21
                                                                          companies pochodne
                                                                                    products          i nowe
                                                                                                     and  new wana
                                                                                                     projects
                                                                                                     projekty

                                                                                                                                       29
BALANCE SHEET

 [PLN thousand]                     31/12/2020 31/03/2021   [PLN thousand]                       31/12/2020 31/03/2021   ▪ Increase in stocks results from the
                                                                                                                           higher valuation of the
                                                                                                                           compulsory diesel oil stock and
Fixed assets, including:                                    Equity, including:
                                                                                                                           higher levels of operating stocks
                                                                                                                           of that fuel as of the end of March
Tangible assets                         35 834    36 970     Share capital                            8 198     8 198      2021
                                                                                                                         ▪ Higher receivables result from a
                                                             Other capitals                        218 816    218 816
Intangible assets                       21 714    21 664                                                                   significant increase in the sales
                                                                                                                           levels of diesel oil and LPG, and
                                                            Total equity                           265 881    296 183      launch of sales, within the area of
Fixed assets in total                 148 732    148 404
                                                                                                                           those 2 segments, to major
                                                            Long-term liabilities, including:                              wholesale customers, to whom
Current assets, including:                                                                                                 the company grants a trade credit.
                                                            loans and other debt instruments         48 996    58 694      The amount of receivables was
 Inventories                          166 695    239 773                                                                   also affected by the growth of
                                                            Total long-term liabilities              52 690    71 747      advance payements made for
                                                                                                                           deliveries of goods as a result of a
 Trade and other receivables          332 671    510 803
                                                                                                                           seasonal increase in fuel sales
                                                            Short-term liabilities, including:
                                                                                                                         ▪ Higher liabilities result from a
 Financial derivative instruments       14 885    43 610
                                                            overdrafts                             172 440    216 824      development of trade activities
                                                                                                                           just like in case of higher
 Cash and cash equivalents             116 063   110 471                                                                   receivables
                                                            Total short-term liabilities           471 764    699 770

Total current assets                  641 603    919 296    LT and ST Liabilities                  524 454    771 517

Total assets                          790 335 1 067 700     TOTAL LIABILITIES                      790 335 1 067 700

                                                                                                                                                          30
CASH FLOW

[PLN thousand]                                                                       1Q20        1Q21      ▪ Negative operating cash flows result first
                                                                                                             and foremost from:
Operating activity cash flows                                                                                  • Increase in depreciation levels, mostly
                                                                                                                 as a result of new station leases and
Profit before taxation                                                              (12 805)     38 030          their settlement according to MSSF16
                                                                                                               • Payment of the income tax for 2020
Adjustments by items, in this:
                                                                                                               • Increase of receivables and stocks as
  Amortisation                                                                        1 518       3 209          a result of a dynamic growth of trade
                                                                                                                 operations and occurrence of new
  Net interests, transactional costs (concerning credits and loans) and dividends     1 450       1 376          customers benefitting from credit
                                                                                                                 limits
  Receivables change                                                                 37 113    (176 495)   ▪ Negative investment cash flows result
                                                                                    117 768     (73 078)     mostly from higher amounts of loans
  Inventories change                                                                                         granted to entities from outside the group
                                                                                                             in relation to returns obtained
  Trade payables change                                                              20 868     153 716
                                                                                                           ▪ Negative financial cash flows result mainly
                                                                                                             from the levels of interest paid for debt
Net operating activity cash flows                                                   146 515     (32 851)
                                                                                                             financing and payments related to
                                                                                                             financial leases
Net investment activity cash flows                                                    (189)      (4 924)

Net financial activity cash flows                                                    (3 922)     (4 538)

Financial resources and their equivalents net
                                                                                    (36 022)   (106 353)
of overdrafts as of 30th September
                                                                                                                                                      31
Thank you for your
                                                                                                          attention!
This presentation was prepared by Unimot S.A. (“Company”) for its shareholders, analysts
and other contractors. This presentation was prepared solely for information purposes and
does not constitute a purchase offer or a sales offer, nor an offer aimed at obtaining a sales or
a purchase offer for any securities or instruments. This presentation does not constitute an
investment recommendation or an offer for provision of any service. Data in the presentation
are presented with due diligence, however, it must be noted that some of the data come from         INVESTOR RELATIONS
external sources and have not been independently verified. No guarantees or representations
can be made with regard to the exhaustive nature or reliability of the information provided in      UNIMOT S.A.
this presentation. The Company is not liable for any decisions made based on the information        e-mail: gielda@unimot.pl
and opinions included in this presentation. Unimot S.A. hereby informs that in order to obtain
information on the Company, one should refer to periodical or current statements published in
accordance with provisions of the Polish law.
You can also read