Tactical Thoughts - February 2019
←
→
Page content transcription
If your browser does not render page correctly, please read the page content below

Tactical Thoughts – February 2019
         Equity markets around the world rose in January with the MSCI World Index rising +7.8%, the
         largest monthly move since October 2011. Sentiment shifted markedly after the US Federal
         Reserve announced caution on any further interest rate rises. Much of the market volatility over
         the last twelve months has been indirectly attributable to concerns about the path to higher
         interest rates. By signalling a pause, the Fed has underpinned a renewed sense of investor
         confidence that they will back‐stop any material fall in asset prices.

         New Zealand equities participated in the global rally but by a smaller magnitude. The benchmark
         NZX50G returned +2.0% in January and has almost retraced all of its losses since last
         September’s record high. Defensive yield names were well bid, buoyed by the prospect of lower
         interest rates while at the same time growth stocks like a2 Milk were also firmer. Tourism related
         stocks fell after weaker than expected net migration figures and slower inbound tourism were
         reported. Air NZ in particular announced a material drop in 2019 earnings expectations and the
         stock fell sharply as a result.

         The S&P/ASX 200 advanced +3.9% in January as energy stocks delivered a strong performance
         buoyed by the recovery in oil prices. Financials continued their slide with banks dragging the
         sector lower ahead of the release of the recommendations from the Royal Commission. The
         report was released in early February and on first impressions, appears to be more benign than
         many thought it would be. Fortescue Metals Group (FMG) was the best performing stock on the
         Australian exchange, rising +35.1% after the release of a solid quarterly update. Much of the
         move though was likely to be attributable to spiking iron ore prices after Vale, the world’s largest
         producer, reported a large dam failure in Brazil that will take a considerable amount of supply
         out of the market.
         US equities (S&P 500) racked up their best January since 1987 on the back of a more subdued
         Fed Chairman and optimism regarding US‐China trade talks. The Fed signaled it would be patient
         on interest hikes and flexible on reducing its balance sheet which encouraged sentiment. The
         more dovish turn eased fears that the Fed would continue to hike even if the economic data
         pointed otherwise. Energy and industrials were the best performing sectors while technology
         stocks lagged after Apple announced poor results, hurt especially by the slowdown in China.
         The UK saw ongoing political tension as it inches closer to its agreed March deadline to exit
         the European Union. The FTSE 100 lagged last month, as Brexit remains a source of uncertainty,
         especially given weak leading economic indicators for Europe most notably in Germany. The UK
         parliament rejected a Brexit proposal from Prime Minister May and the market must still wait
         for a resolution.
         China remains an area of focus for global investors. Weak manufacturing data was reported early
         in the month but slower growth also led to more stimulus, including a reduction of the required
         reserve ratio (RRR) and a promise of tax cuts and additional government spending. Investors
         interpreted these stimulus measures as a positive which supported global growth expectations
         and risk assets.

1 of 6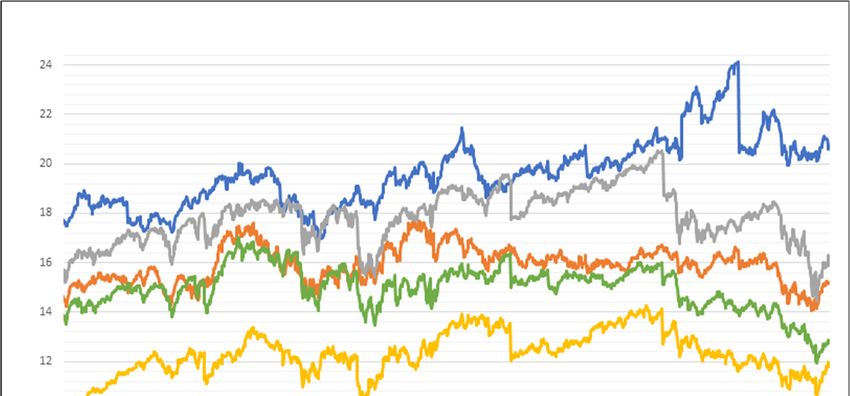
We have seen a significant shift take place in 2019 for the outlook for global interest rates, in part
         as a response to the US Federal Reserve Chairman’s comment that they are now sitting at a
         neutral level in terms of their current interest rate setting. The result being that markets are not
         pricing in any interest rate increases for 2019 in any of the developed economies. In fact,
         Australasian markets are now mostly pricing in an interest rate reduction within the next 18
         months. Despite record low rates, we prefer holding fixed income instead of cash, as
         bondholders receive a higher yield especially if we were to see a lower official cash rate.
         ASB announced to the market that they were repaying at par ($1.00) retail investors who hold
         either the ASBPA or ASBPB Perpetual Preference Shares. These securities which total NZ$550m
         have been outstanding since 2002 and have traded in an extremely wide range due to their
         structure and perpetual nature. This is a timely boost for investors as they were trading around
         the ~0.85 cents level at the time of the announcement and this sign of ‘good faith’ does seem
         to tie in coincidentally with the Banking Royal Commission that has been on‐going across the
         Tasman.
         Markets have bounced materially off their fourth quarter 2018 lows, and one might argue that
         investors who added to their holdings and essentially bought the dip have proven to be correct.
         We would agree to an extent but we would also say that the evidence appears to be pointing
         that we are towards the later stages of the current economic cycle. An investment manager was
         in our office earlier this month, and he relayed a recent interaction with a highly‐regarded NZ
         CEO, who had said to him “we are in year 11 of a ten‐year property cycle”. We feel the same
         could be said of equities and think it is prudent to be more cautious at this point in the
         investment lifecycle. At the same time, this should be balanced with the belief that there will
         continue to be rewarding opportunities for clients to participate in.

         Asset allocation remains key, and sticking to one that matches your risk profile is the best way to
         achieve your investment goals as the next phase starts to form. The fixed income pipeline for
         primary issuance looks strong in 2019 which will provide a number of compelling opportunities.
         Likewise, 2018 saw several takeover deals of local companies and we see this trend as
         continuing. Domestic IPOs with the exception of Napier Port look few and far between this year,
         however private equity funds continue to raise capital and deploy it across the local mid‐market
         space. We expect a blue‐chip private equity manager to begin marketing a follow‐on fund in the
         coming months so please reach out to your adviser if you would like to learn more.

         We are excited by the current opportunity set and believe the next down‐cycle is not around the
         corner just yet. We expect 2019 to have further chances for wealth creation in both equities and
         fixed interest and we encourage clients to not let short‐term market gyrations distract them
         from their long‐term investment goals.

2 of 6
Recommended Tactical Asset Allocation
Underweight Overweight
Asset Class Tactical Rationale
NZ Equities We retain our Neutral recommendation on New
Zealand equities. We see a slowing economy and
rising policy uncertainty as risks but despite this
believe there are attractive individual names to own.
Australian The Royal Commission and US/China trade dispute
Equities has had a harmful impact on sentiment and we stick
to our Moderately Underweight recommendation.
US Large Cap US GDP growth is likely to slow in 2019 but corporate
Equities earnings growth should remain resilient. It is late in
the cycle but we still see opportunities before markets
move to the next phase.
US Small Cap With the Fed now on hold, deregulation and tax
Equities reform continue to be tailwinds for US small caps, and
therefore have become constructive again.
Developed World Brexit has dominated the headlines in the UK and
Equities Europe and clouded the near‐term outlook. Japan is
leveraged to a strong US but heightened volatility has
made investing in this market challenging.
EM Equities Emerging Markets appear to have bottomed and have
benefitted from sizeable net fund inflows. We prefer
Asia. Chinese equities should benefit from a
resolution to trade tensions or stimulus measures.
NZ Listed Revaluation gains and lower debt serving costs have
Property helped to keep gearing levels in check. Limited growth
opportunities however underpin our Neutral rating.
Fixed Interest Fixed income remains supported despite an increase
in supply. We stay Neutral as the sector balances
historically low interest rates domestically against
safe‐haven demand from rising equity volatility.
Cash With the RBNZ explicitly stating their desire to keep
short term interest rates at low levels, we see little
benefit in holding large quantities of cash.
3 of 6Market Price Earnings ratios
Price Earnings ratios 2013 – 2019*
*Price/Earnings Ratios are Bloomberg Best estimates for forecast year one.
Price Earnings ratios versus average*
NZ Australian US Large US Small Cap Developed EM
Price Earnings*
Equities Equities Cap Equities Equities World Equities
As at 31 January 20.8 15.2 16.3 21.9 12.9 12.0
10‐year average 17.4 14.9 16.2 26.2 14.1 12.1
5‐year average 19.6 15.9 17.9 26.9 15.0 12.3
*Price Earnings ratios are Bloomberg Best estimates for forecast year one.
FX Returns to 31 January 2019
NZ$ FX performance percentage returns to 31 January 2019
Currency Pair 1m 3m 6m 12m
NZ$/ US$ 2.9% 6.1% 1.4% ‐6.1%
NZ$/ AU$ ‐0.3% 3.2% 3.6% 4.0%
Source: IRESS, Bloomberg, January 2019.
4 of 6Index Returns to 31 January 2019
Index percentage returns in their currency
Asset Class Index 1m 3m 6m 12m
NZ Equities S&P/NZX 50 Gross NZ$ 2.0 2.7 0.7 6.4
Australian Equities S&P/ASX Accumulation 200 AU$ 3.9 1.5 ‐4.6 1.4
US Large Cap Equities Russell 1000 Total Return US$ 8.4 0.5 ‐3.0 ‐2.2
US Small Cap Equities Russell 2000 Total Return US$ 11.2 ‐0.4 ‐9.6 ‐3.5
Developed World Equities MSCI EAFE* US$ 6.5 0.9 ‐8.7 ‐15.0
EM Equities MSCI EM* US$ 8.7 9.8 ‐3.5 ‐16.3
NZ Listed Property S&P/NZX Property Gross NZ$ 1.8 7.5 8.0 13.6
Fixed Interest S&P/NZX Corporate A NZ$ 0.6 1.4 2.9 5.0
Cash ANZ New Zealand Call Rate NZ$ 0.1 0.4 0.9 1.8
Source: IRESS, Bloomberg, January 2019 (*not total return index).
Index percentage returns translated into NZ$
Asset Class Index 1m 3m 6m 12m
NZ Equities S&P/NZX 50 Gross 2.0 2.7 0.7 6.4
Australian Equities S&P/ASX Accumulation 200 4.2 ‐1.7 ‐7.9 ‐2.5
US Large Cap Equities Russell 1000 Total Return 5.3 ‐5.3 ‐4.4 4.2
US Small Cap Equities Russell 2000 Total Return 8.1 ‐6.2 ‐10.9 2.7
Developed World Equities MSCI EAFE* 3.4 ‐4.9 ‐10.0 ‐9.4
EM Equities MSCI EM* 5.6 3.5 ‐4.8 ‐10.9
NZ Listed Property S&P/NZX All Real Estate 1.8 7.5 8.0 13.6
Fixed Interest S&P/NZX Corporate A 0.6 1.4 2.9 5.0
Cash ANZ New Zealand Call Rate 0.1 0.4 0.9 1.8
Source: IRESS, Bloomberg, January 2019 (*not total return index).
Macquarie Interest Rate and FX Forecasts
Rate 4Q2018A 1Q2019E 2Q2019E 3Q2019E 4Q2019E
Australia Cash Rate 1.50 1.50 1.50 1.50 1.50
Australia 10yr govt 2.70 2.80 2.90 3.00 3.10
US Fed Funds Rate 2.25 2.50 2.75 3.00 3.25
US 10yr Treasury 3.03 3.35 3.55 3.75 3.75
NZD OCR 1.75 1.75 1.75 1.75 1.75
NZ 10yr govt 2.65 2.75 2.85 2.95 3.10
NZ$/ US$ 0.6600 0.6600 0.6600 0.6700 0.6800
AU$/ US$ 0.7100 0.7000 0.7100 0.7300 0.7400
NZ$/ AU$ 0.9296 0.9429 0.9296 0.9178 0.9189
EUR/ US$ 1.1200 1.0900 1.1000 1.1100 1.1200
US$/ JPY 112.00 110.00 109.00 109.00 106.38
GBP/ US$ 1.2500 1.3300 1.3500 1.3700 1.4000
Source: Macquarie Securities, January 2019.
5 of 6General Disclaimers
This document has been distributed in confidence to New Zealand resident clients of Hobson Wealth Partners Limited (Hobson Wealth). If you are not
the intended recipient of this document, please notify Hobson Wealth immediately and destroy all copies of this document, whether held in electronic
or printed form or otherwise.
This document has been issued and distributed in New Zealand by Hobson Wealth, an NZX Advising Firm and a registered financial services provider.
The disclosure statements for Hobson Wealth and your adviser are available free of charge by contacting us on 0800 742 737. Hobson Wealth is not
a wholly owned subsidiary of Macquarie Group Limited (MGL) but MGL holds an interest in, and provides certain business and research services to,
Hobson Wealth. There is also a security distribution agreement in place between MGL and Hobson Wealth.
This document contains market commentary and factual information or class advice only. It is not research. Nothing in this document shall be
construed as a solicitation to buy or sell any security or product, or to engage in or refrain from engaging in any transaction. The information in this
document does not take account of any particular person’s objectives, financial situation or needs. Before acting on this information, investors should
therefore consider the appropriateness of the information having regard to their situation. We recommend investors obtain financial, legal and taxation
advice before making any financial investment decision. The views contained in this document may not constitute the views of Macquarie Group
Company. While we believe the information to be accurate and any recommendations to have reasonable basis, no warranty is made as to the accuracy
or reliability thereof. There are risks involved in securities trading. The price of securities can and does fluctuate and an individual security may even
become valueless. International investors are reminded of the additional risks inherent in international investments, such as currency fluctuations and
international stock market or economic conditions, which may adversely affect the value of the investment. The forecasts are predictive in character
and therefore investors should not place undue reliance on the forecast information. Whilst every effort has been taken to ensure that the assumptions
on which the forecasts are based are reasonable, the forecasts may be affected by incorrect assumptions or by known or unknown risks and
uncertainties. The actual results may differ substantially from the forecasts and some facts and opinions may change without notice. Hobson Wealth
does not give, nor does it purport to give, any taxation advice. The taxation discussion in this document is based on laws current at the time of writing.
Those laws and the level of taxation may change. The application of taxation laws to each investor depends on that investor’s individual circumstances.
Accordingly, investors should seek independent professional advice on taxation implications before making any investment decisions. This document
is based on information obtained from sources believed to be reliable but we do not make any representation or warranty that it is accurate, complete
or up to date. We accept no obligation to correct or update the information or opinions in it. Opinions expressed are subject to change without notice.
Hobson Wealth accepts no liability whatsoever for any direct, indirect, consequential or other loss arising from any use of this document and/or further
communication in relation to this document. Hobson Wealth, its associates, and Macquarie Group, their officers or employees may have interests in
the financial products referred to in this document by acting in various roles including as investment banker, underwriter or dealer, holder of principal
positions, broker, lender, director or adviser. Further, they may act as market maker or buy or sell those securities as principal or agent and, as such,
may affect transactions which are not consistent with the recommendations (if any) in this document. Hobson Wealth and members of Macquarie
Group may receive fees, brokerage or commissions for acting in those capacities and the reader should assume that this is the case.
Disclosures
Important disclosure information regarding MGL interest in the subject companies covered in this report is available at
www.macquarie.com/disclosures.
Contacts
For more information, call us on 0800 742 737 or visit our website at hobsonwealth.co.nz
Auckland Tauranga Wellington Christchurch
Level 17, Lumley Centre Level 2, Suite 6, The Vault Level 12, Deloitte Building Level 3
88 Shortland Street 53 Spring Street 20 Customhouse Quay 151 Cambridge Terrace
Auckland 1010 Tauranga 3110 Wellington 6011 Christchurch 8013
6 of 6You can also read