Black Monday hit the markets exactly thirty years ago and, on that single day, the Dow lost nearly a quarter of its value. Just how different are ...
←
→
Page content transcription
If your browser does not render page correctly, please read the page content below
Black Monday hit the markets exactly
thirty years ago and, on that single
day, the Dow lost nearly a quarter of
its value.

Just how different are the markets now?
The crash of October 19, 1987 is one of history’s             This is extraordinary. Why did the worst one-day market
great outliers.                                               crash in history have no follow through?

Americans woke up to this headline the next morning           One reasonable theory credits the lack of government &
in the New York Times:                                        central bank intervention. Without Quantitative Easing,
                                                              excessive interest rate cuts, or bailouts to cushion the fall,
 STOCKS PLUNGE 506 POINTS, A DROP OF 22.6%
                                                              stocks rapidly found their new clearing prices. Investors
 604 MILLION VOLUME NEARLY DOUBLES RECORD
                                                              adjusted and we avoided a drawn-out bear market. And
                                                              importantly, the recession that that many economists were
“Stunned” doesn’t begin to describe the feeling on Wall
                                                              calling for never came.
Street. Stupefied is more accurate.
                                                              By 1989, the market had fully recovered to new highs.
Thirty years later, Black Monday still stands as the most
                                                              It did so with minimal help from the Federal Reserve.
volatile day in U.S. stock market history. Not even the
                                                              Chairman Alan Greenspan cut interest rates just once,
2008 financial crisis came close to challenging its record.
                                                              from 7.25% to 6.88%.
The market’s biggest one-day loss during that period
occurred on October 10, 2008. Markets panicked on news        Amazingly, 1987 was a winning year for the stock market;
that the bonds of bankrupt Lehman Brothers had sold for       the Dow posted a 5.2% overall gain. Everyone knows
just 8.6 cents on the dollar. Even so, the Dow lost “just”    Black Monday was a historic crash. But many folks forget
7.9% that day.                                                it was preceded by an equally historic rally.

Dig deeper into the price action during October 1987 and      The Dow had skyrocketed 40%+ to start the year.
you’ll find even worse losses. In the nine days leading up    So, unlike the 2001 and 2008 stock market crashes,
to Black Monday, the market lost 11%. In total, the Dow       1987 didn’t wipe out years of gains. It merely completed
dropped a nauseating 34% in just ten trading days.            a yearlong roundtrip:

But as painful as they were, these ten days were the          Dow index on January 1st 1987: 1,927.31
entirety of the crash. Investors didn’t know it yet, but      Dow index at its 1987 peak in August: 2,709.50
when the closing bell rang on the afternoon of Black          Dow index on New Year’s Eve 1987: 1,938.83
Monday, the bear market was already over. The Dow
never flirted with its Black Monday lows again.               1987 was an endlessly fascinating year.

                                                              While 1987 was one of the most volatile
                                                              years ever, 2017 is setting records in the
                                                              opposite direction
                                                              So far, this has been the quietest, most tranquil year ever
                                                              for the stock market. The VIX, a popular measure of
                                                              market volatility, sunk to all-time lows earlier this summer.

                                                              Historically, October has been the stock market’s most
                                                              volatile month. But October 2017 is on pace is to be the
                                                              least volatile ever. Not the least volatile October ever…
                                                              the least volatile month ever.

                                                              Looking solely at price action, you might conclude that
                                                              1987 and 2017 have absolutely nothing in common.
                                                              But, look beneath the surface and there are similarities
                                                              worth exploring.
The widespread use of “portfolio insurance” was a main reason the 1987 crash spiraled out of control. This practice involved selling futures and options as markets declined, to offset losses in stocks. Like many financial innovations, it was a great idea… until everyone started doing it. By 1987, most large institutions had computer programs instructed to “dynamically hedge” their portfolios. This means they sold more and more as the stock market declined. Their relentless selling largely caused the record-setting losses. Here’s how this ties back to today. Many Real Vision contributors have expressed concern over the unstoppable growth of passive ETFs. As we’ve discussed in prior issues, millions of investors are putting their money in passive ETFs, which have low fees and have generated good returns over the last several years. The truth is, passive investing is the right move for many people. But there’s a persuasive argument that its out-of-control growth is “hollowing out” the markets. As passive ETFs grow, the number of human stock analysts – whose job function helps keep stock prices honest – is dwindling. Many laugh at the idea that passive ETFs could be destabilizing. What could be safer than buying an S&P 500 ETF to spread your money around the largest 500 U.S. companies? Of course that is a compelling argument. The excellent results that passive investing has produced in the past few years must be acknowledged. But keep in mind these results have come in a bull market. Much like portfolio insurance prior to Black Monday, widespread passive ETF investing has not seen a challenging market. The real test will come in the next bear market. Financial history is littered with strategies that worked wonderfully in bull markets, but turned disastrous when a bear market began. Computerized trading also took a lot of the blame for the 1987 crisis. The computers did what they were programmed to do: hedge when prices declined. This automation led to questionable behavior that a human with a brain may have avoided, such as continuing to sell when prices were already down 20%. If computers’ influence on the stock market was a problem then, it’s a much bigger one now. Many estimates suggest that 80%+ of the trades in today’s market are executed by high-frequency computer algorithms. These robots are thousands of times more advanced than their 1987 predecessors. But are they smart enough to avoid causing a meltdown when stock prices turn? We can’t know until that time comes. We do know, however, that these robots can liquidate an entire portfolio faster than a human can login to an Etrade account. There’s one area where 2017 and 1987 truly have nothing in common: valuation. Shiller’s CAPE ratio, which smooths earnings over 10 years, peaked at about 18 in 1987. It currently sits at 31.2, having recently surpassed its 1929 peak of 30. This is notable because the market only briefly touched this level in 1929, just before the historic stock market crash that kicked off the Great Depression. In fact, measured by CAPE, today’s market is now the second priciest in history. It trails only the dot-com bubble’s mind-boggling 44.2 reading. Finally, we come to perhaps the biggest difference between markets in 1987 and today. As we mentioned, the U.S. government and central bank generally did not interfere with markets during the 1987 crash. Today, things are decidedly different. Governments stand ready with short-selling bans, bailouts, Quantitative Easing, bottomless interest rate cuts, stock market “circuit breakers,” and threats of nationalization (remember those from 2008?). They employ this arsenal to combat any market moves they don’t like. In fact, one of the government’s most controversial tools has its roots in Black Monday. In response to the 1987 crash, President Reagan created the “Working Group on Financial Markets.” Or as its better known, the “Plunge Protection Team.” The PPT has been rumored – but not confirmed – to buy stocks to support prices on certain occasions. Including during the 2008 crisis. Overall, these many “safeguards” mean that a crash as swift and severe as Black Monday is unlikely to happen today. Is this a good or bad thing? Your answer will vary depending on your role in the financial markets. But “unlikely” does not mean “impossible.” Above all else, the lesson we take from Black Monday is this: Anything can happen in the markets. See you next week.
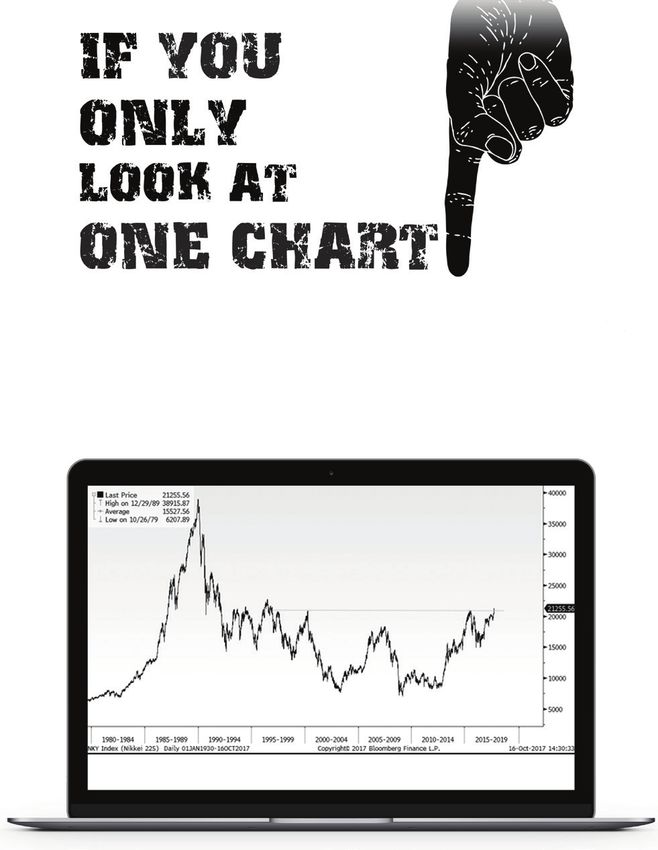
The Nikkei looks to be in a stealth rally – potentially breaking out of
a 21-year resistance – and helping the BOJ, who owns over 60% of
the ETF market.
Thirty years ago today, the impossible happened. The Dow crashed 22.6% in a
single day, which in statistical terms is mind-bogglingly unlikely. Stock market
returns do not follow the normal bell-curve distribution that much of statistical
theory is based on. But if they did, a 22% one-day crash should occur roughly
once every vigintillion years. That’s a 1 followed by 63 zeroes.

Three decades later, Black Monday remains by far the biggest one-day decline in
U.S. stock market history.

Looking back at that time, the list of Dow components in 1987 reads like a history
textbook. Bethlehem Steel, Woolworth’s, Minnesota Mining & Manufacturing, and
Sears were 4 of the 30 stocks tracked by the Dow Jones Average. Similarly, the U.S.
economy still largely produced “stuff” rather than services. Five of the ten largest
U.S. companies were oil producers. Two others were car makers. The other three
were General Electric, AT&T, and the gargantuan IBM.

IBM was the Apple of its day. It was by far the biggest company in the world in
1987 and dominated the computer market. Prior to the crash, it had a market cap
of $63 billion and it earned $4.8 billion in profits in 1987.
Black Monday was painful for all investors, but it was exceptionally awful for IBM
shareholders. As the largest component of the Dow, its stock was hammered by
relentless selling. At the end of that day, IBM stock had dropped 30%, erasing $18.8
billion from its market cap.

But worse was to come: while the broader market recovered to new highs by 1989,
IBM stock remained languishing for years. The 1987 crash kicked off a downtrend
that IBM remained stuck in until it bottomed in 1993.

In fact, it took until 1997 for IBM stock to finally climb back and surpass its 1987
high. It was the last of the 30 stocks still in the Dow to do so.

The stunning losses suffered by IBM and other U.S. stocks were exacerbated
by excessive leverage. Prior to Black Monday, the market had surged an
incredible 44% in 1987. Giddy from these huge gains, investors had borrowed
record amounts of money to speculate in stocks. Margin debt surged to
all-time highs.

Predictably, it ended in pain. A record number of margin calls occurred on
Black Monday, forcing many investors to sell positions whether they wanted
to or not. A Federal Reserve paper noted that “margin calls were about ten
times the average size on Black Monday.”
Few things are worse than getting a margin call during a market crash. When the
broker calls, you have two bad options. Put up more money and potentially lose
it. Or sell and lock in your losses. Multiply this panicky feeling across tens of thousands
of investors and you can see how a crash like 1987 can spiral out of control.

But for investors who are prepared, this widespread panic can result in a
once-in-a-generation opportunity. For investors who weren’t hostage to
margin calls and could control their emotions, 1987 was one of these times.

As we mentioned earlier, the Dow lost a stunning 34% in ten days in October
1987. But it had recovered all these losses and gone on to make new highs by 1989.

Even IBM, whose stock price slid 77% from its 1987 peak, is now worth around
$150 billion. That’s approximately triple its market cap at the beginning of 1987.
And remember, this was one of the worst performing stocks in the Dow after
the crash.

We don’t know when the next bear market is coming. No one does. But as we
chronicled in Edge of the Cliff, many successful investors are starting to warn that
we’re at elevated risk for a sharp correction – or worse. Not to mention that two
of the key ingredients for a bear market are present today: elevated valuations
and widespread complacency.

Given these facts, it makes sense to prepare. First, you may want to “stress test”
your portfolio. Imagine the market takes a 15-20% dive. Are there any stocks
in your portfolio you’d be uncomfortable owning? Consider selling them. Or, at
least scaling back those positions to a risk level you can tolerate under less
favorable market conditions.

Lastly, consider doing your homework and assemble a ‘shopping list’ of
stocks you’d consider buying at much lower valuations. You may just get that
opportunity… and doing the work now means you can step into falling markets
as a cool-headed and prepared buyer when, all around you, panic-selling is
taking place.
From the trader who bankrupted Barings,
the Queen’s Bank, with his misplaced (and
ultimately fraudulent) derivatives trades
on the N225. He bet on the Japanese equity
market going higher, but it collapsed after
the Kobe earthquake in 1995. After a 22
year waiting game, Nick Leeson: 1, Barings: 0
question
    Milton,

                       answer
    There seems to have been a lot of negative news about TSLA recently,
    but the stock still seems fairly bulletproof. Storm in a teacup or a sign
    of something more?

                       OK well I’ve been dreading this one as I’m bound to upset the
                       Teslafarians out there, but you asked so I’ll answer.

                       I think TSLA stock price has gotten way ahead of itself given
                       the fact that they burn through so much cash, can’t seem to make
                       a profit and are about to get deluged by the kind of competition
                       (Audi, Porsche, BMW and Mercedes to name but four) that no
                       sane car manufacturer ever wants to start
                       playing in their sandbox.

                       Leave aside the production shortfalls, the management turnover and
                       the increasingly negative press, and a lot of what you have left is
                       the Dreams of Elon (what a great name for an indie band).

                       I’m sorry but that ain’t enough for this puppet. Elon’s sellin’ but I
                       ain’t buyin’.

                       (Please address all Tesla-related hatemail to Milton c/o CNBC,
                       Englewood Cliffs, NJ)

                       Don’t forget to tip your waitress.

                                                                             Milton
What’s hot on Real Vision this week…
WHO
Global Intelligence Expert Dee Smith
HOW
Joined by more than a dozen senior experts,
Dee Smith examines the rising risks in an
increasingly complex world. In Episode one,
WHAT
Episode 1 of the Real Vision Original Documentary
they analyze the origins of dominant political
and social systems, and the ever-increasing
pressures they face today.
A World on the Brink, igniting one of the most heated
(and polarizing) debates we ever had amongst the
subscribers in our comments section. This is exactly
the kind of discussion we love on Real Vision.
Get in on the conversation with a 7-day free trial.
WHERE
The world of geopolitics
WHEN
Last week on Real Vision Television
WHY
Modern society is struggling with the breathtaking rate of
change in technology, globalization, and politicsCLICK HERE FOR THE
COLOR VERSION.
SEND COMMENTS TO 2020@REALVISION.COMYou can also read